
Monitoring key performance indicators (KPIs) throughout project lifecycles helps determine which projects are on the right track. And which ones need help to hit your company’s financial and operational targets.
Let’s explore the importance of KPIs and our top 9 project KPIs to monitor to boost your profits.
What is a KPI in project management?
KPIs are quantifiable metrics used to measure progress toward specific business goals. In project management, KPIs are used in relation to the famous Iron Triangle: balancing your project budget and costs, your schedule, and your scope.
Project management KPIs give you concrete insight into what is (and isn’t) working with your projects. And help you catch problems before they derail the project—and your company’s profits.
They’re also helpful for determining historical trends, showing you where to improve project lifecycles moving forward.
Top 9 project management KPIs for profitable projects
Let’s unpack the most important project management KPIs that help you track budget, costs, and scope. And set you up for success.
1. Budgeted vs. actual cost
Budgeted vs. actual cost looks at the difference between what you planned to spend on a project and what you actually spent.
This project performance indicator tells you how accurate your financial forecasts were. And how on-point your project spending has been.
Example
Say your team is working on a marketing campaign for a client. The project is expected to take six weeks and cost $10,000 (budgeted cost). After two weeks, you notice you’ve already spent $6,000 on labor costs alone (actual cost). If this trend continues, you’ll go over budget.
This is a red flag that something is way off—whether scope creep or a resource allocation issue.
Why it matters
Monitoring budgeted vs. actual cost is key for supporting your organization’s bottom line. If a project costs more than you planned, that’s going to eat away at your profit margin.
Project managers may face increased scrutiny when projects consistently exceed their budgets, leading to stress and a higher workload. This financial mismanagement also strains team morale and undermines client trust, jeopardizing long-term business relationships.
Tracking this KPI allows you to make corrections before your company loses money on the project. It can also help you set more accurate cost estimates in the future.
How to track it
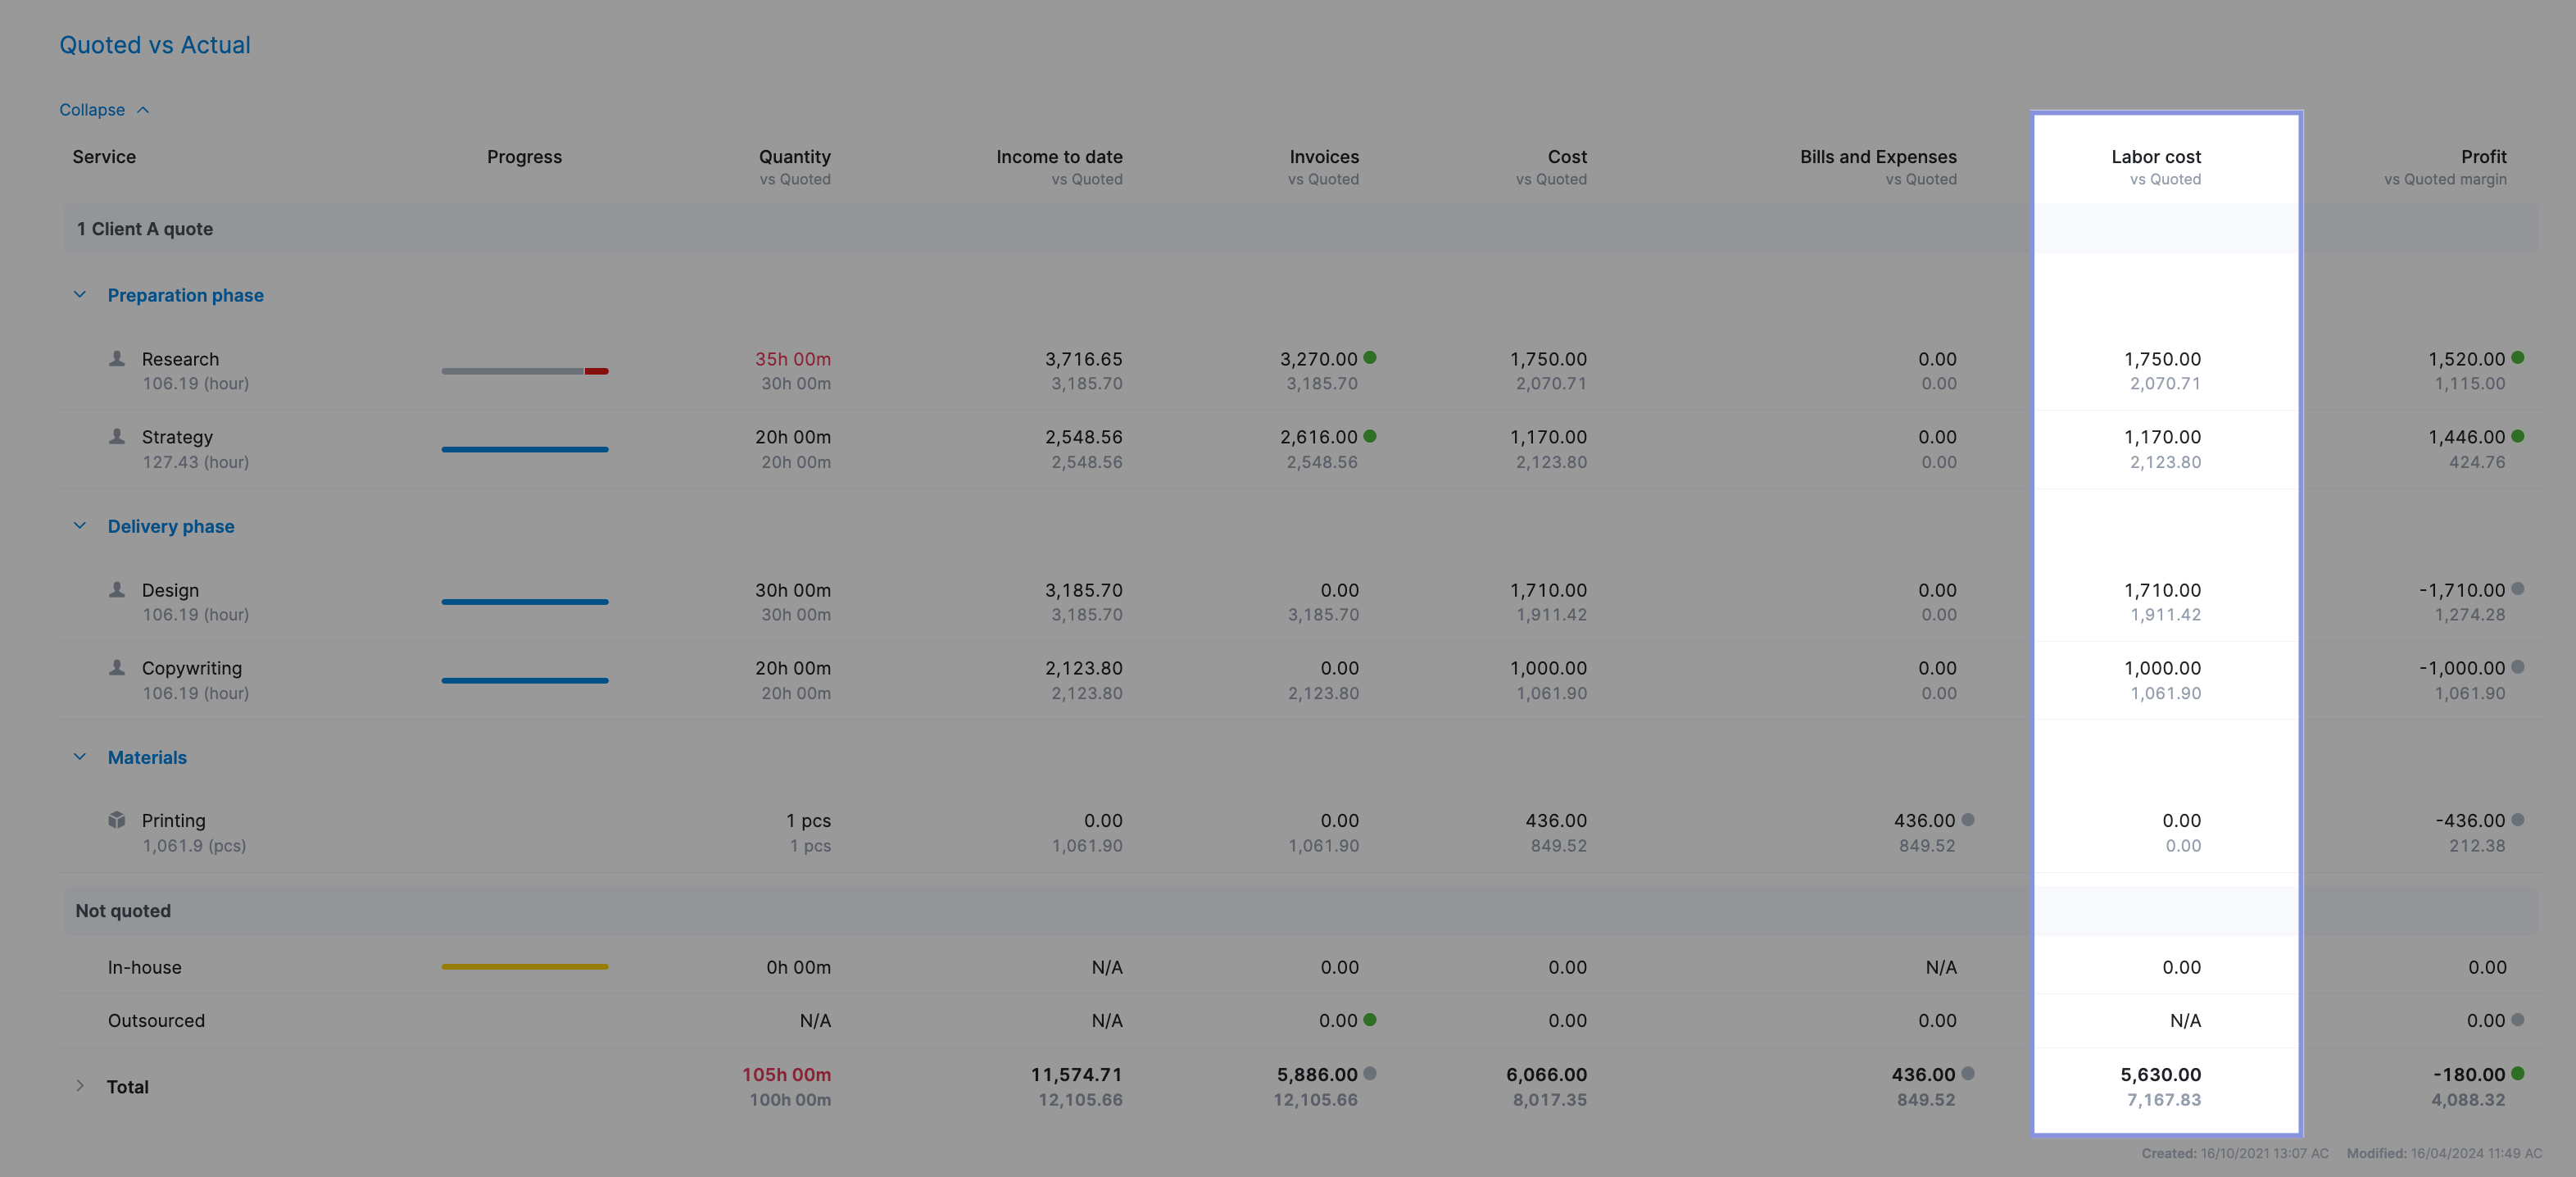
Compare your planned budget with your actual costs using Scoro’s “Quoted vs. Actual” table for each project.
You can find it by clicking on any project and then navigating to the “Budget” tab, followed by the “Quoted vs. Actual” tab.
The “Quoted vs. Actual” table displays each service’s scope, progress, revenue, cost, and profit-related data.
For each service line, you’ll see two rows of data:
- The bottom row (in gray) shows the estimated values from the quote
- The upper row (in black) shows the actual current results
If the actual value exceeds the quoted value, it will be highlighted in red for easier tracking.
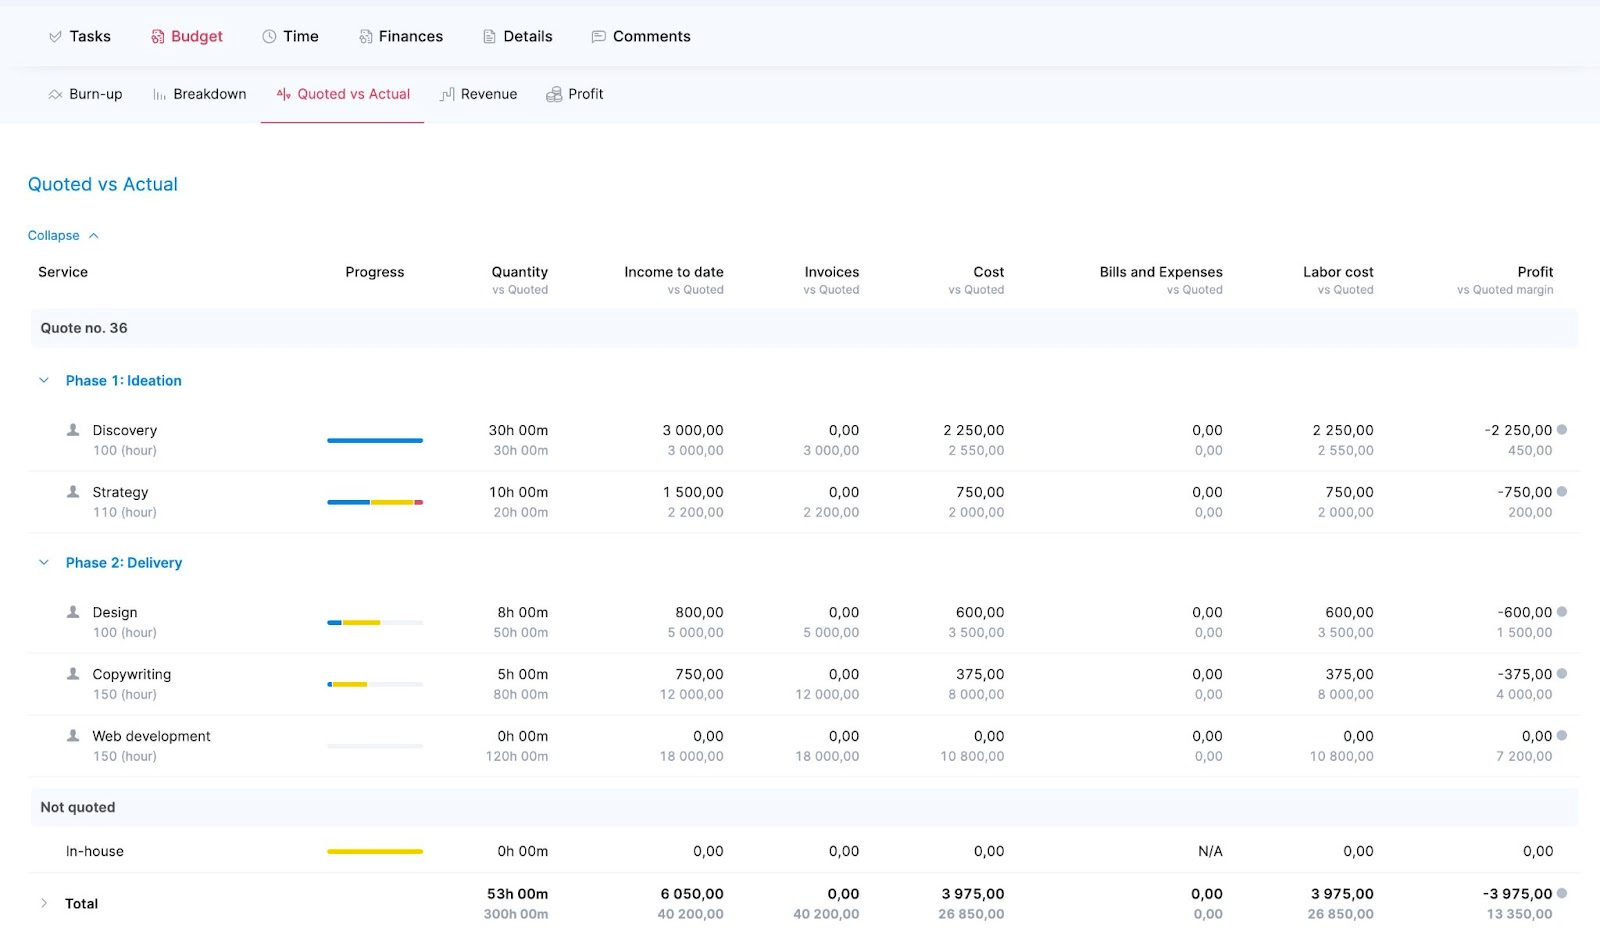
Pay special attention to the “Cost vs Quoted” column. This column includes all your labor costs, bills, and expenses. If your number exceeds your planned costs, look in the other columns to see where the excess spending comes from.
Further Reading: Project Cost Tracking: A Beginner’s Guide
2. Budgeted vs. actual time
Budgeted vs. actual time is a project management KPI that compares the time a project or task was supposed to take with the time it actually took.
Example
Say you’ve agreed to design a website for a client and estimated it would take about 50 hours. As you get into the project, unexpected technical issues push your team’s working hours up to 60.
That’s 10 extra hours of work that will reduce your profit margin. And could delay your project timeline.
Why it matters
Whether your team bills hourly or uses a fixed pricing structure, tracking billable utilization is crucial.
You need to ensure you’re spending the expected amount of time on the project.
If you spend too much time on projects, they will be less profitable. If your team consistently misses deadlines and takes too much time to complete tasks, clients might complain, demand a discount, or churn completely, ultimately impacting your profits.
On the flip side, if you expect a project to take longer, you could be missing out on opportunities to take on more work, which means you’re leaving money on the table.
So, your initial estimate needs to be as accurate as possible.
How to track it
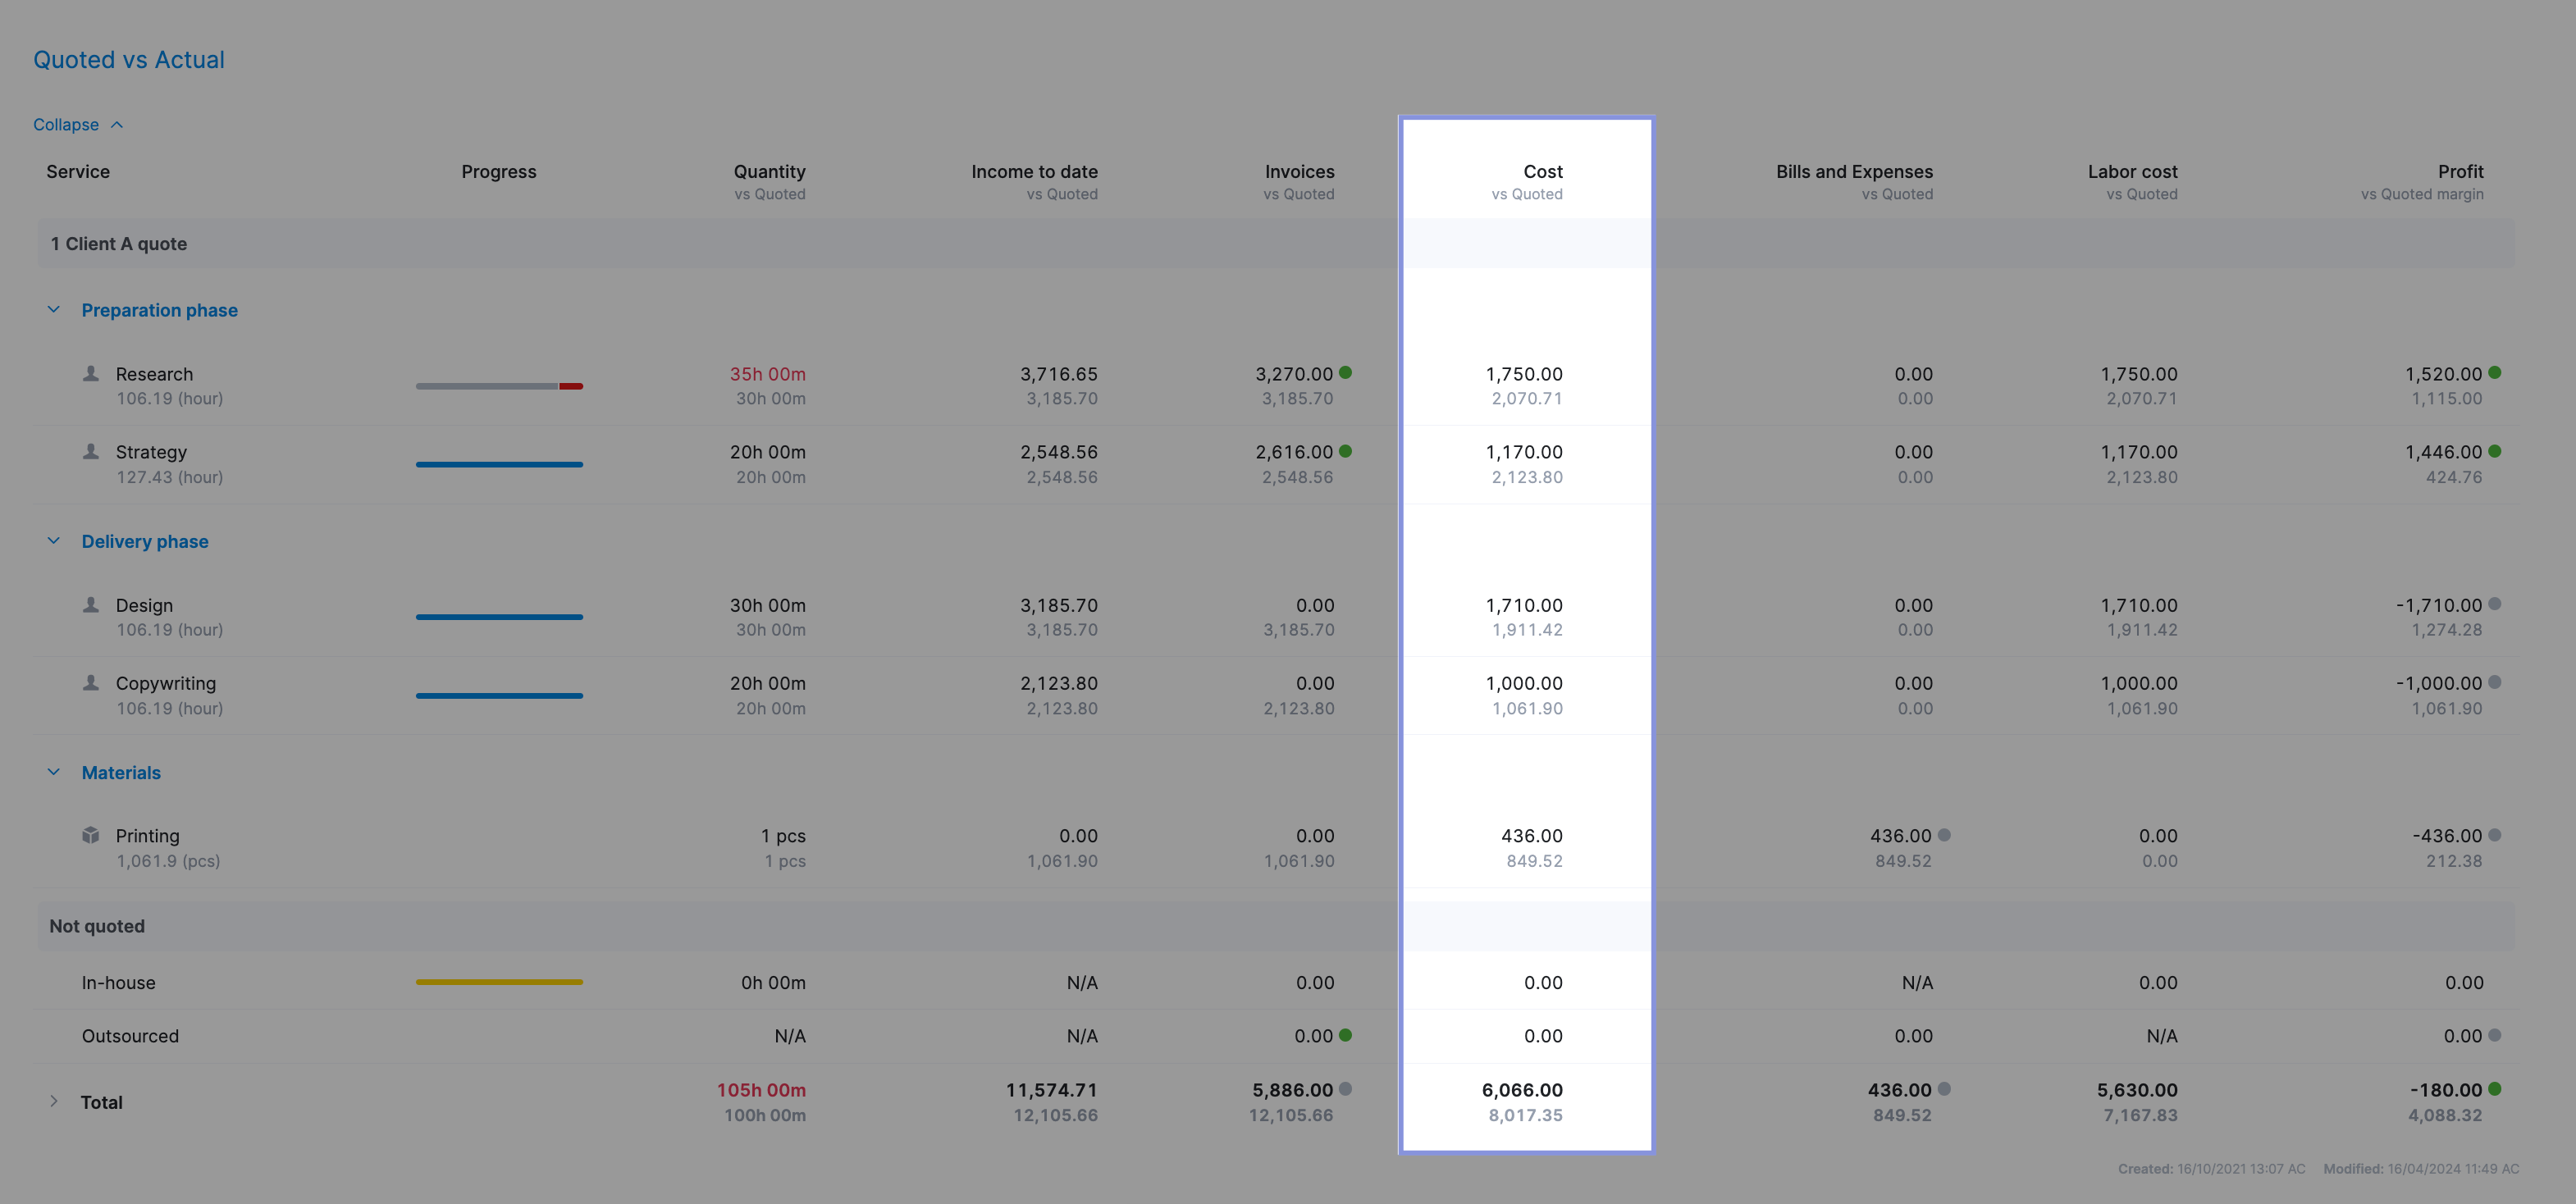
Scoro’s “Gantt” chart view can show how long each project task was supposed to take (in hours) and how long it took your team.
Head to the “Projects” module, click on any project, and navigate to “Tasks” and then “Gantt” to see a Gantt chart displaying your tasks and project timeline.
The task progress bar visually indicates how the task is progressing against the planned time. The progress line turns red once you exceed the planned hours. Hover over the task name to quickly see the exact breakdown of estimated time vs. done time vs. overtime so far.
If you notice your team is spending too much time on particular projects or tasks, you can talk to your team to find out why this is happening. This will help you out when it comes to scoping, planning, and allocating resources for future projects.
Further Reading: Gantt Chart in Scoro
3. Delivery costs (labor and pass-through costs)
The Delivery Costs KPI refers to all expenses incurred while working on a project, including staff salaries, materials, and any other expenses related to project delivery.
These costs can be broken down into two main categories: labor and pass-through.
Labor costs refer to the salaries and wages of your team members who work directly on the project. This includes the time spent by developers, designers, project managers, and other staff members dedicated to delivering the project.
Pass-through costs encompass all other expenses related to the project, such as materials, equipment, software licenses, travel expenses, subcontractor fees, shipping, and licensing. These costs are typically billed directly to the client without any markup.
Example
Imagine your team is launching a new website for a client.
You travel to their office to discuss the project. Then, your developer and graphic designer work with a freelance copywriter to create the new website.
By tracking all project costs, such as travel (pass-through), staffing (labor), and external support (pass-through), you won’t unexpectedly reduce your project profits. The more historical data you get on delivery costs, the easier it is to price projects to ensure healthy profit margins.
Why it matters
Delivery costs are essentially the total cost of a project—which directly impacts profitability.
If your delivery costs are higher than expected, you should find ways to reduce costs, charge more, or focus on different types of projects that are more financially viable. So you can strike the right balance between revenue and costs to maintain healthy profit margins.
How to track it
Use Scoro to keep track of all your labor and pass-through costs (bills and expenses) in one place.
First, input the hourly labor costs for each team member by clicking “Settings.” in the top right-hand corner, followed by “Labor cost.”
You can enter a default hourly rate for your team, by role, or by individual team member.
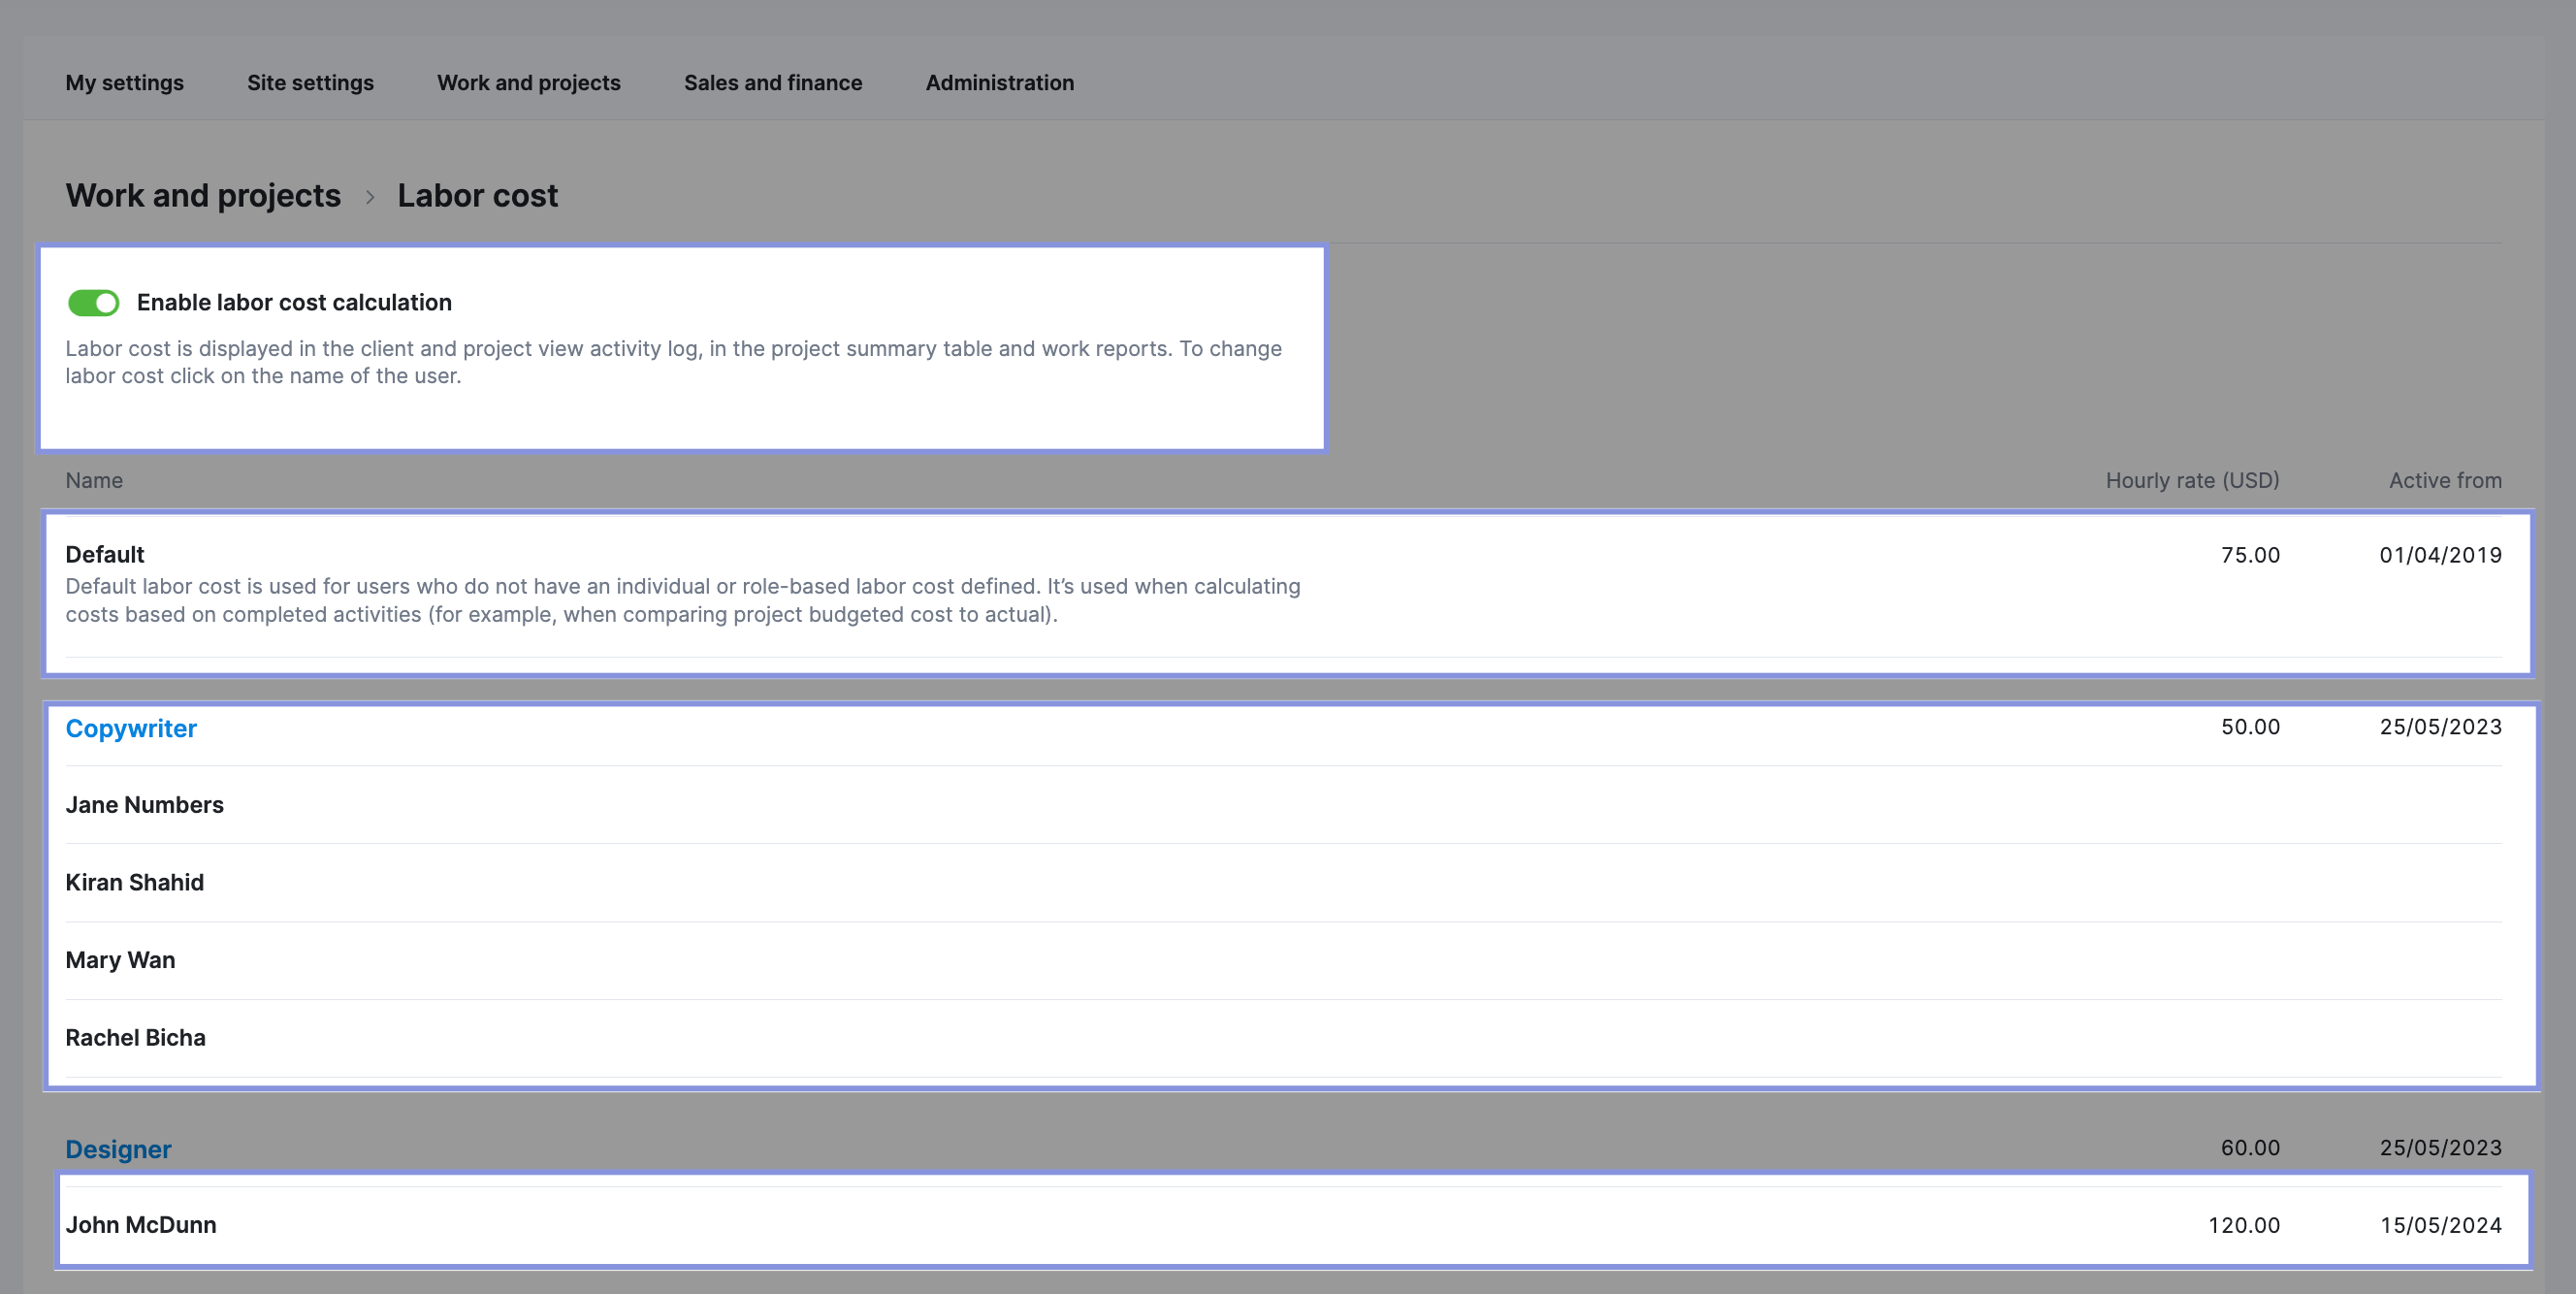
To calculate a full-time employee’s hourly labor cost, add up their:
- Annual salary
- Training costs
- Equipment costs
Then, divide by 2,080 (40 hours a week x 52 weeks).
For contractors, multiply their hourly rate by their expected hours.
After you enter your team members’ hourly rates, Scoro will automatically calculate their labor costs based on the time they track on project tasks.
You can easily find the labor costs for a project by looking at the “Quoted vs Actual” table, which will break the labor costs down into phases/tasks.
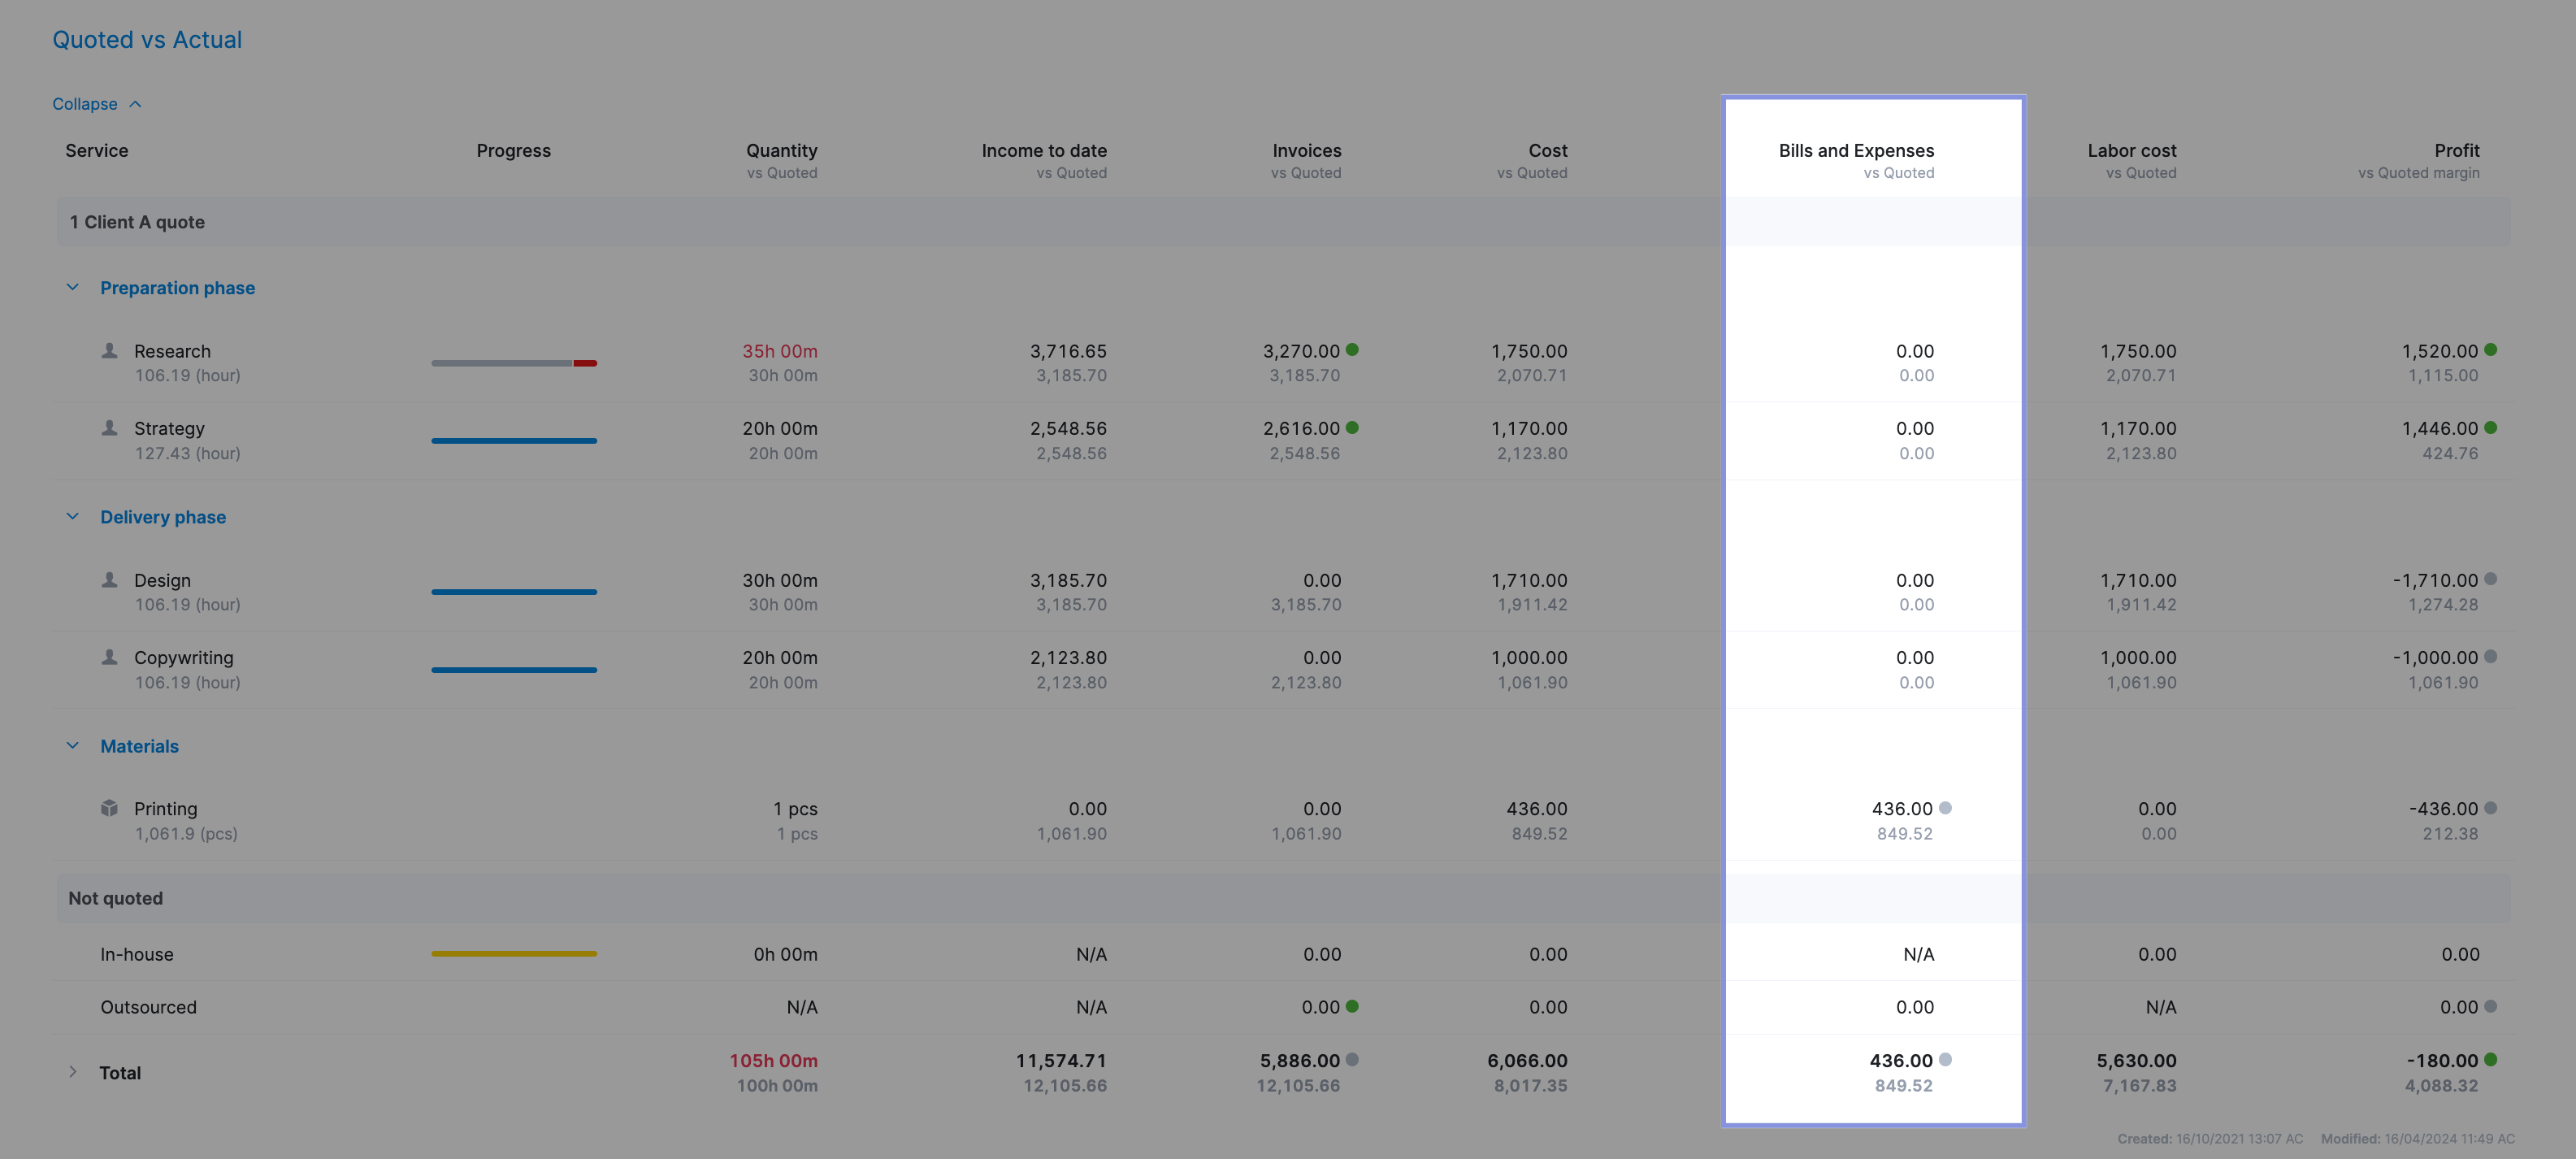
For pass-through costs, you can either:
- Use Scoro’s integrations with Expensify and accounting software like Quickbooks to automatically pull invoices and expenses into the platform
- Enter project bills and expenses individually in Scoro with the “New bill” and “New expense” buttons, which you can find by clicking on the “+” symbol in your site menu.
After logging bills and expenses, Scoro will automatically display the total amount in the “Quoted vs Actual” table in the “Cost” column.
4. Delivery (profit) margin
Your delivery margin, or profit margin, is a key project KPI. It measures the difference between what you charged the client and what it costs to deliver that work.
It’s usually expressed as a percentage of the total project revenue, and the formula looks like this:
Delivery Profit Margin % = ((Gross Revenue – Delivery Costs) / Gross Revenue) x 100
Where:
- Gross Revenue = Total Revenue – Pass-Through Costs
- Delivery Costs = Internal labor costs (payroll)
A healthy delivery margin is usually between 55% and 75%. Many shoot for 60% or even 70%. The higher the delivery margin, the more profitable the project. If it is lower, it threatens the profitability of your entire business, making it difficult to remain in operation.
Example
Say you charged a client $10,000 for a project, and your delivery costs were $6,000 ( $5,000 in labor costs and $1,000 in bills and expenses).
Your delivery margin would be 40% (($10,000 – $6,000) / $10,000), which is lower than 50%. If this happens often, it will negatively impact the profitability of the entire business. In this case, you would need to either reduce your costs, increase project revenue, or both.
Further Reading: Calculating Agency Margins: A Beginner’s Guide
Why it matters
Staying on top of your delivery margins helps you prioritize projects that bring in more money for the business and take action to minimize your losses on underperforming projects.
How to track it
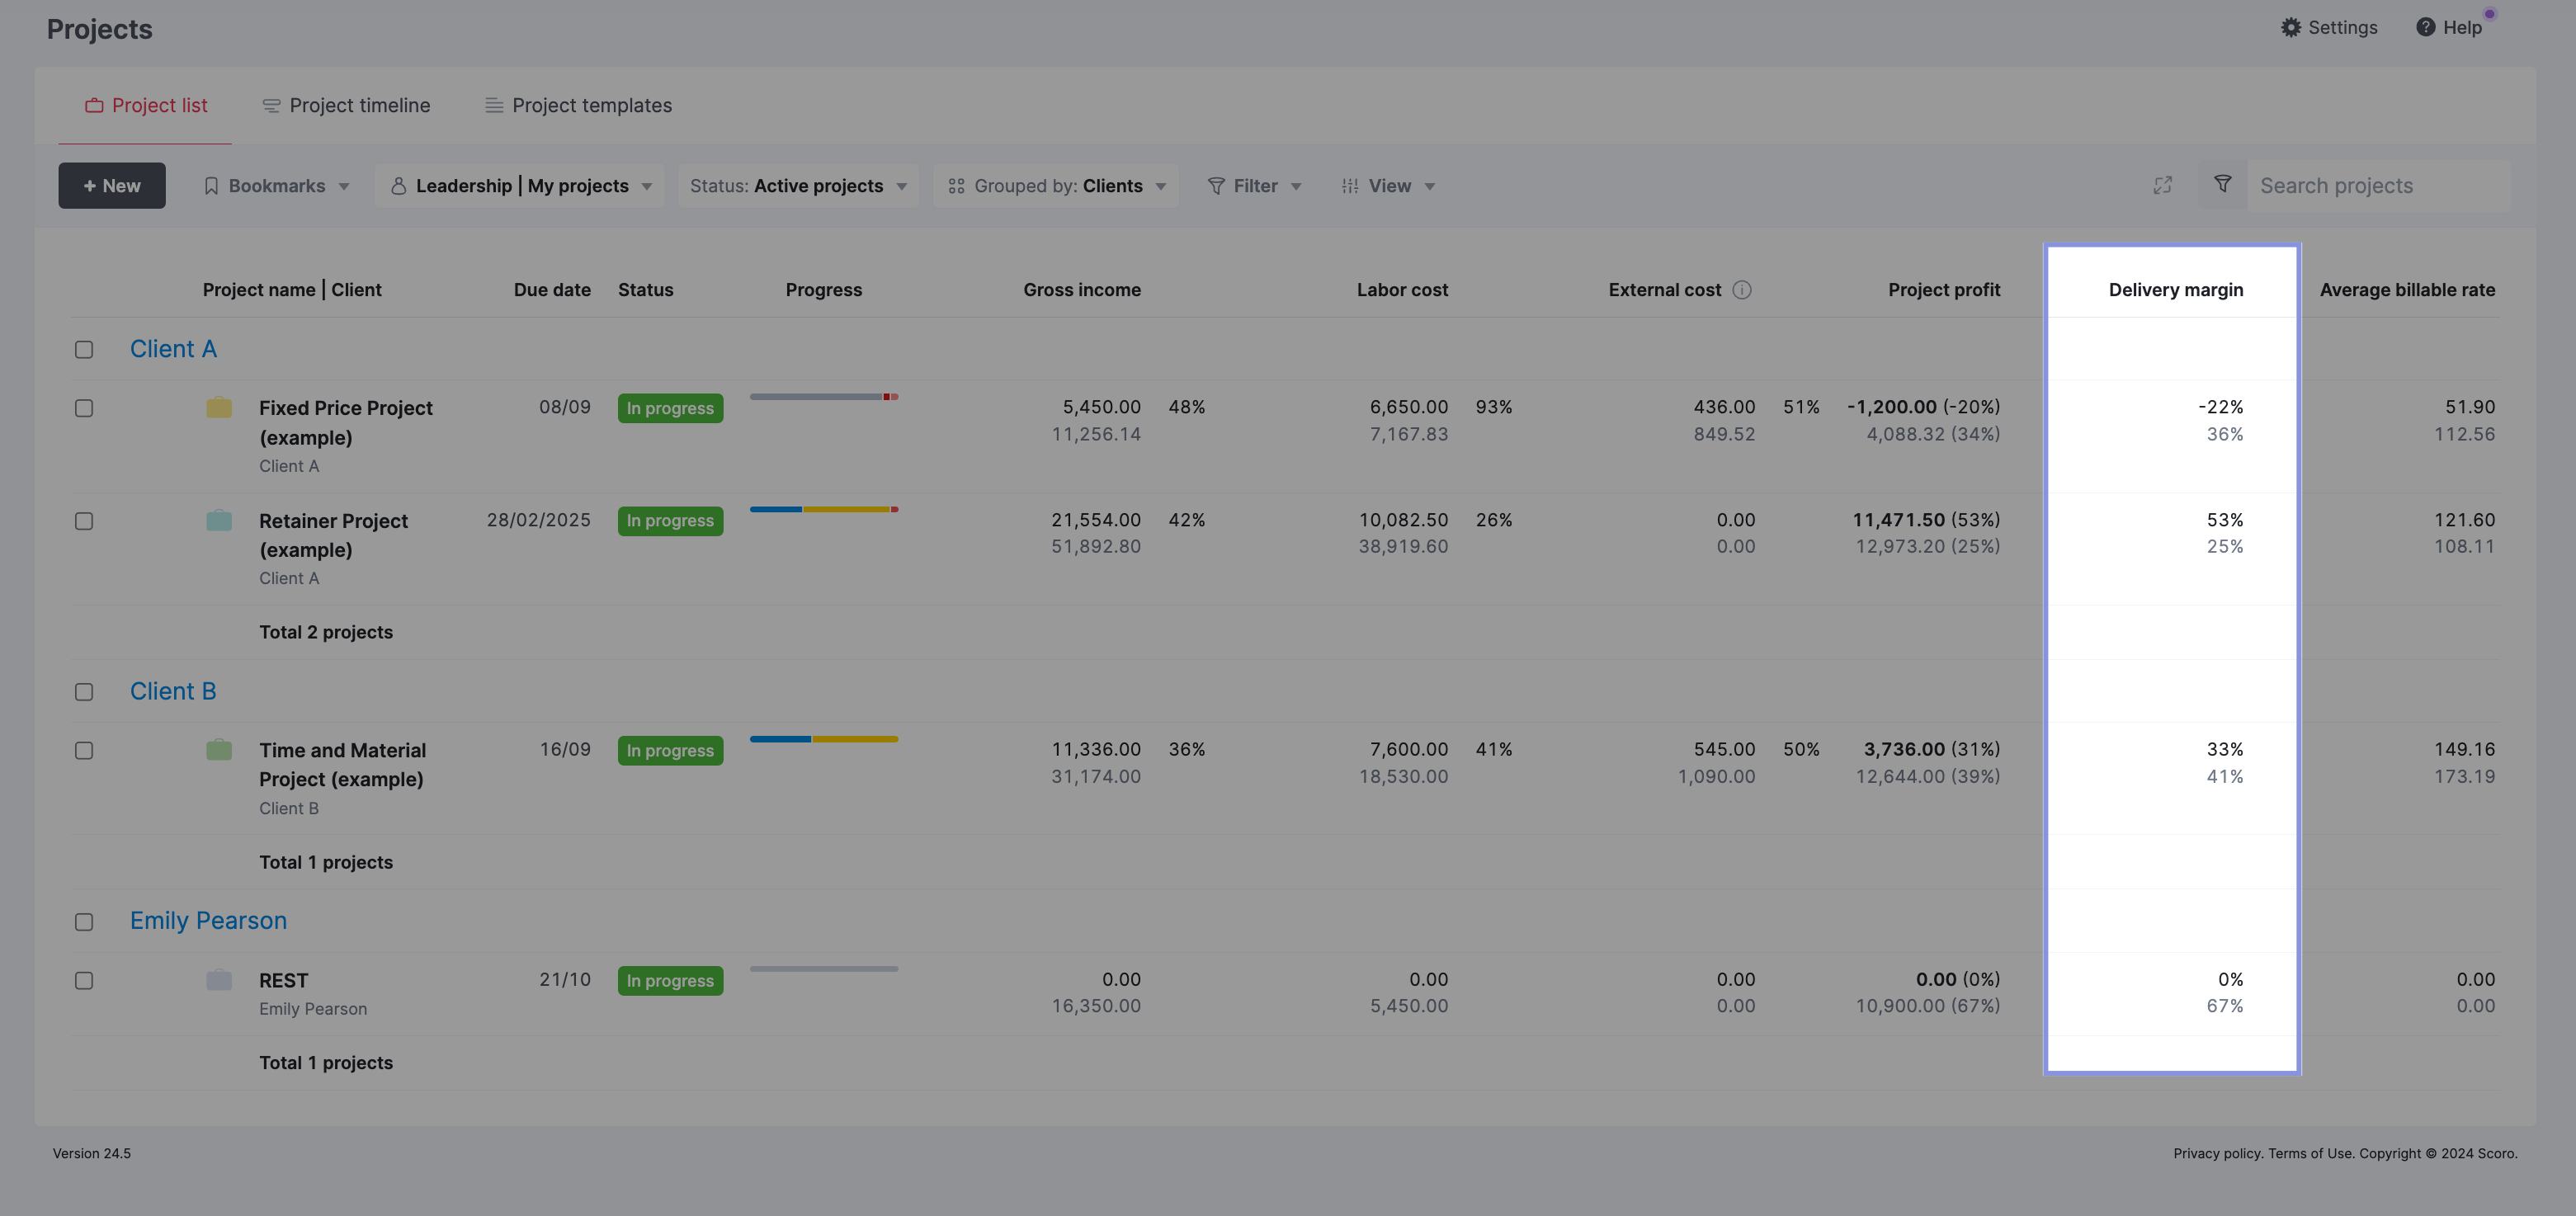
Add the delivery margin metric in the “Project list” view in Scoro.
Just click “View” and then “Data columns.” Select “Project profit” and “Delivery margin” from the drop-down menu and hit “Display.”
You’ll then see the delivery margin for each project. So you can see which projects are helping (or hurting) your bottom line.
5. Average billable rate
Your average billable rate (ABR) is the amount you charge clients for each hour of work.
Tracking your ABR can help you identify which services and project types bring in the most revenue relative to the time your team is investing.
To calculate it, divide your billable revenue by the number of hours.
Like this:
ABR = Gross income / Total hours to deliver the project
Where:
Gross income = Project revenue – pass-through costs (bills and expenses)
Example
Imagine your business’s average billable rate (ABR) is $150 per hour. You analyze the ABR for two projects:
| Project | Gross income | Hours to complete | ABR |
|---|---|---|---|
| Project X | $12,000 | 100 | $120 per hour |
| Project Y | $10,000 | 50 | $160 per hour |
At first glance, Project X would seem more lucrative based on its gross income alone. However, Project Y yields a better return on investment (ROI) per hour worked.
Based on your ABRs, you might consider prioritizing or seeking more projects like Project Y that are more efficient in terms of time-to-revenue ratio. You could also review the operational aspects of Project X to streamline future processes. Or adjust project pricing to better account for the labor investment.
Why it matters
Tracking your ABR helps you understand which clients and projects bring in the most money in the most efficient time. This helps you decide which projects to focus on—and spot areas for improvement.
A low ABR is a sign to review that account to identify potential bottlenecks slowing things down.
For example, does the client require more revisions than most? Do you need more team members with niche expertise on their projects?
Identify the factors that make a project more (or less) profitable. Use those insights to inform decisions about taking on certain projects and clients that are actually worth your team’s time.
How to track it
To track your ABR, open the “Project list” list view in Scoro. Then, click “View” and then “Data columns.” Select “Average billable rate” and hit “Display.”
You’ll see the ABR for each project. The top number (black) shows your current billable rate based on completed work. The number underneath (grey) shows your expected billable rate based on what was planned.
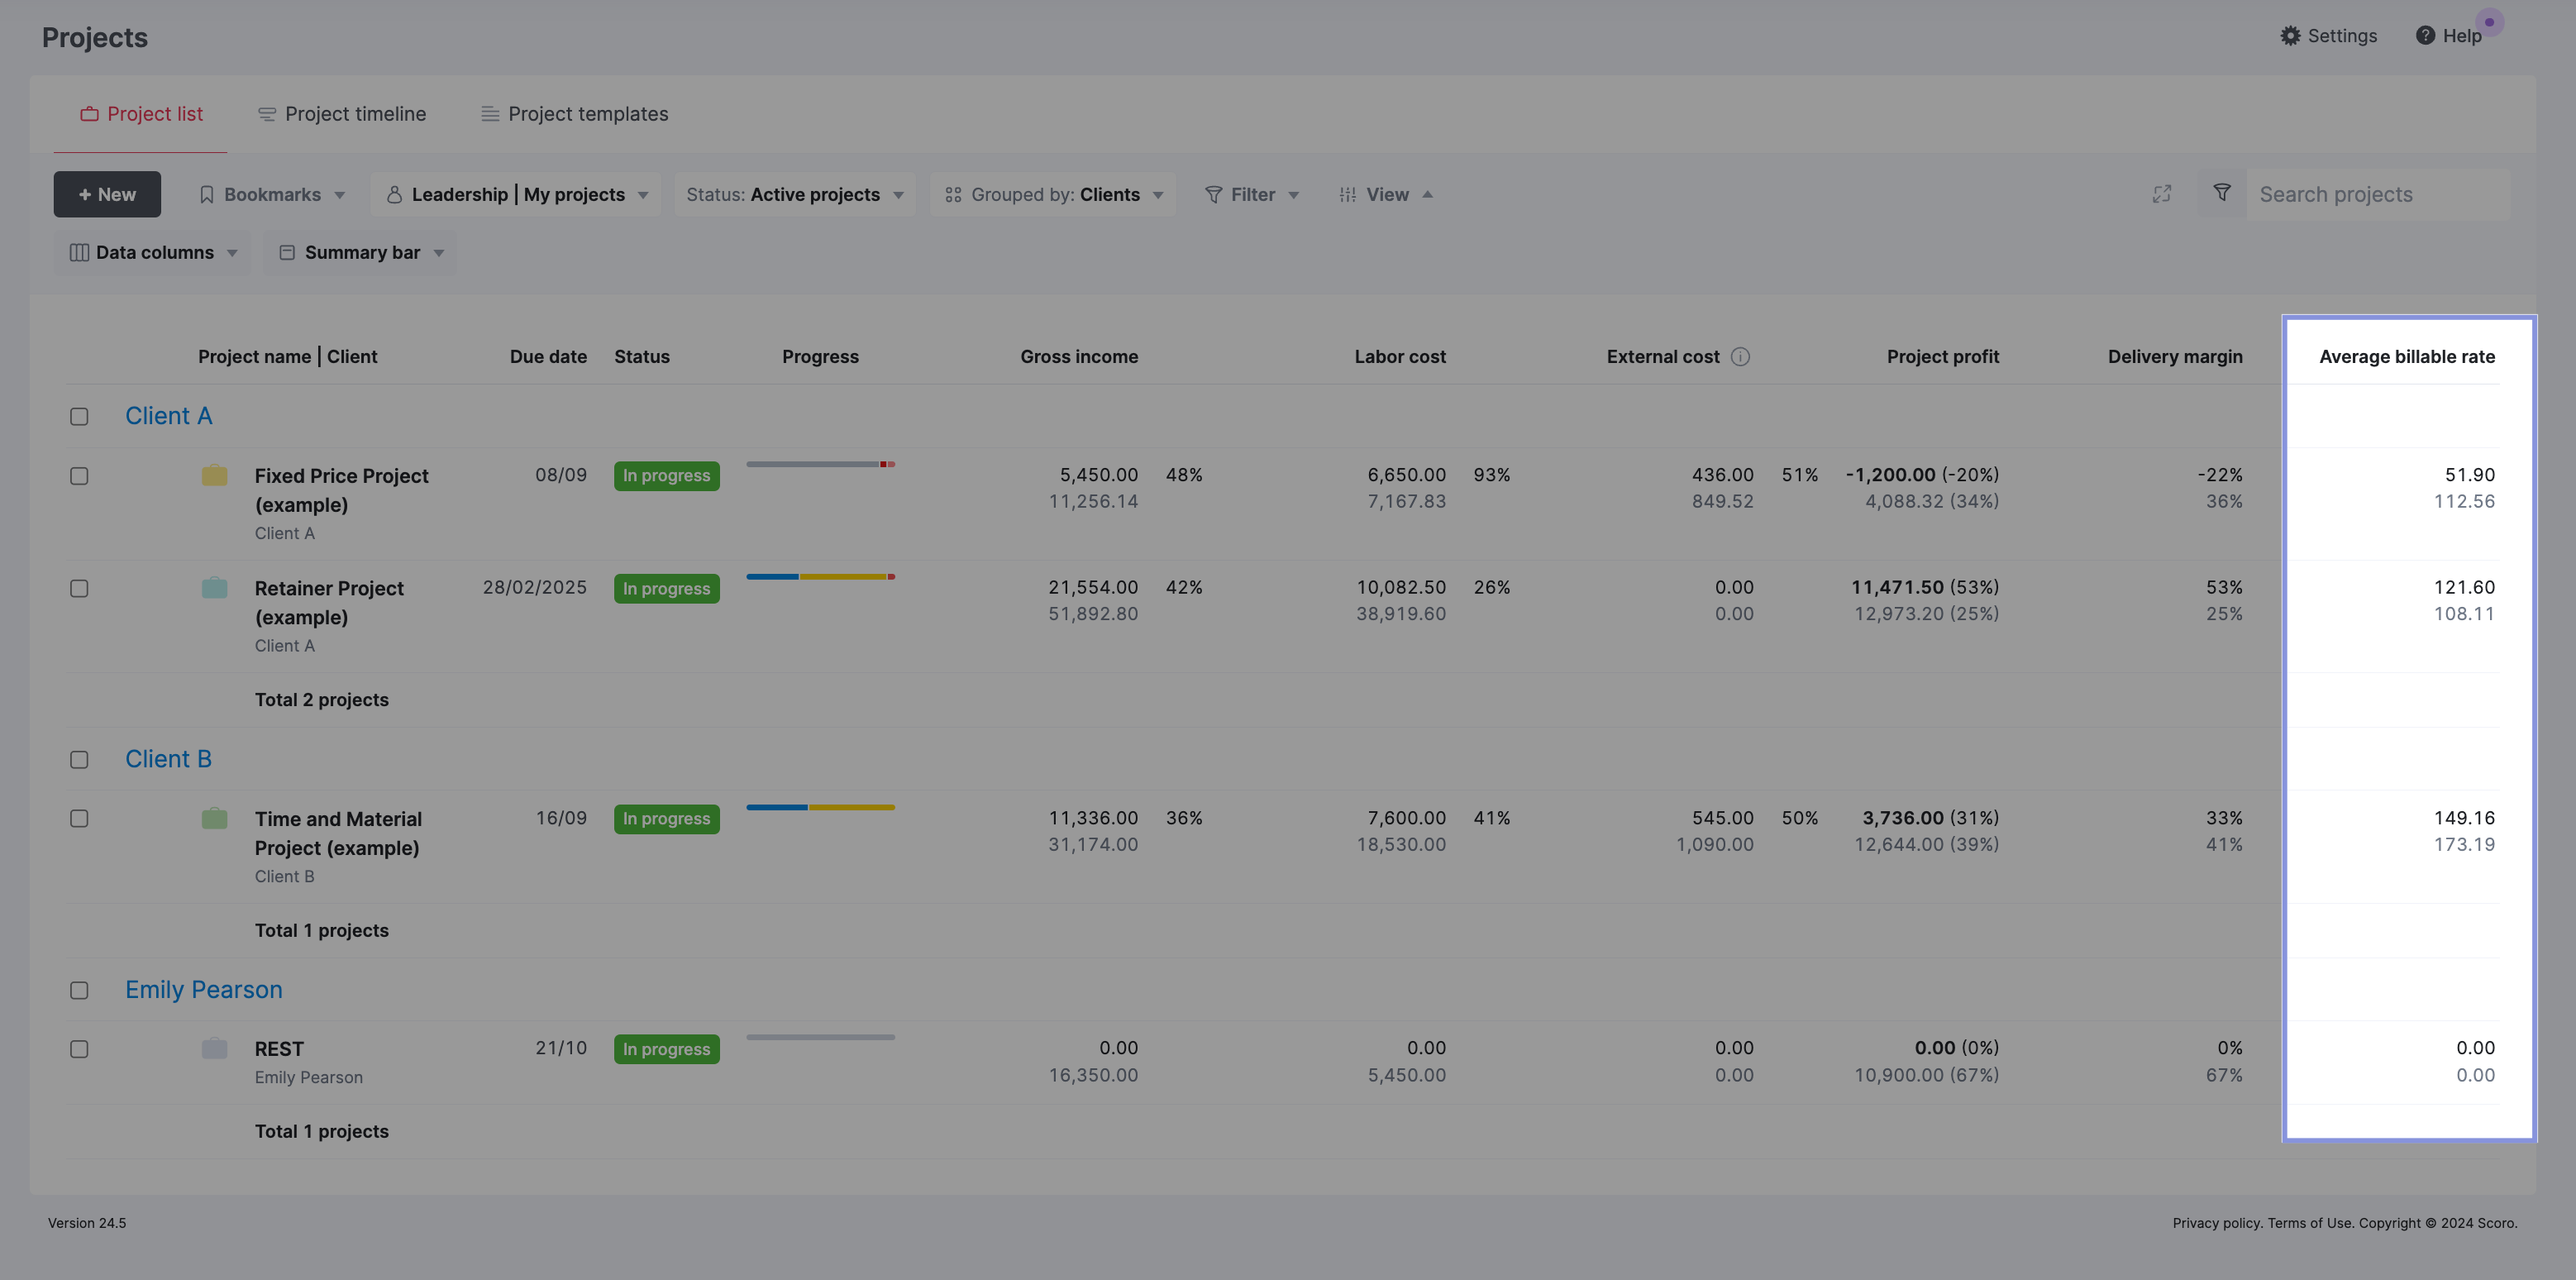
By comparing the current and expected billable rates, you can quickly assess whether each project is on track to meet its expected profitability.
Top Tip: You can use the filter button to select “Status: Completed” for completed projects or “Status: In Progress” for ongoing projects. This allows you to focus on specific subsets of projects based on their completion status.
6. Overdue tasks
Keeping an eye on overdue tasks shows which project activities missed their deadlines. This gives you insight into the effectiveness of your project planning. And find patterns in any roadblocks that cause project delays.
Example
Let’s say you’re managing a social media campaign for a client.
Your team needs to prepare graphics and copy and publish the posts. You notice that both the graphics and copy tasks are overdue. If you spot the issue quickly, you can check in with the team to identify the hold-up, address it, and communicate with the client.
Why it matters
Tracking overdue tasks while a project runs and after it has concluded is helpful.
Analyzing which tasks frequently miss deadlines can highlight inefficiencies or bottlenecks in your project workflows.
You might spot recurring patterns or common factors that lead to delays. Understanding these patterns allows for better planning and resource allocation in future projects, whether it’s certain types of tasks, specific teams, or times of the year.
How to track it
In Scoro, open any project. In the summary bar, you’ll see the total number of overdue tasks (1) and the list of tasks with how many days they’re overdue (2).
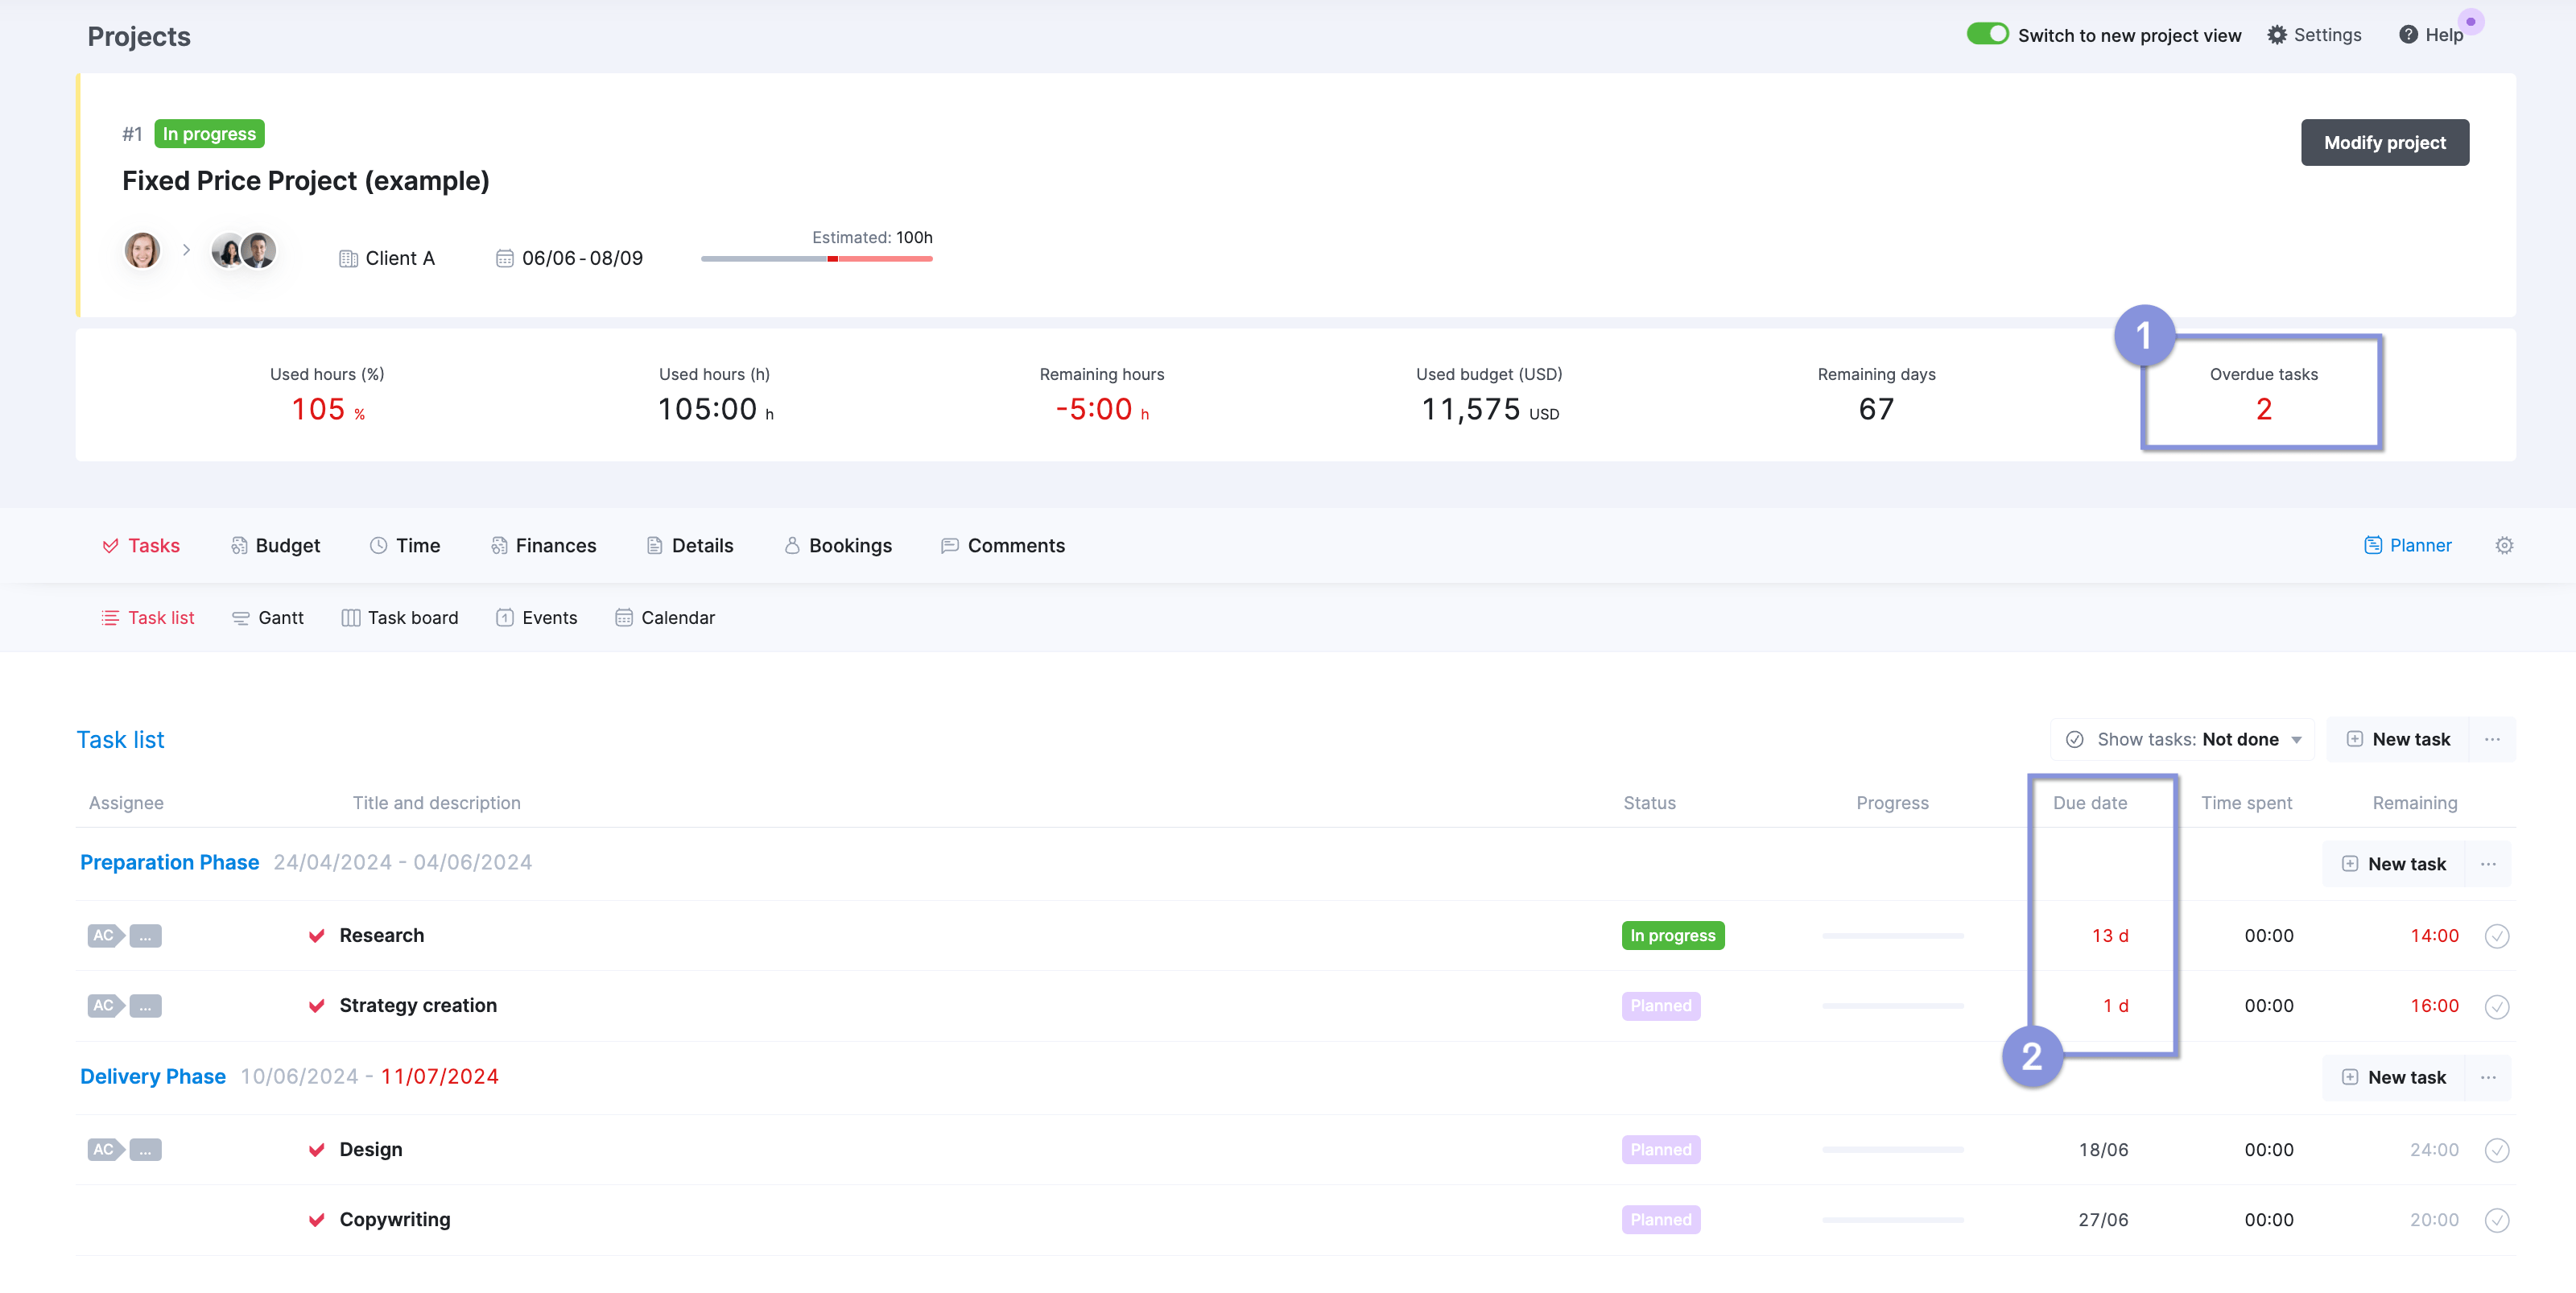
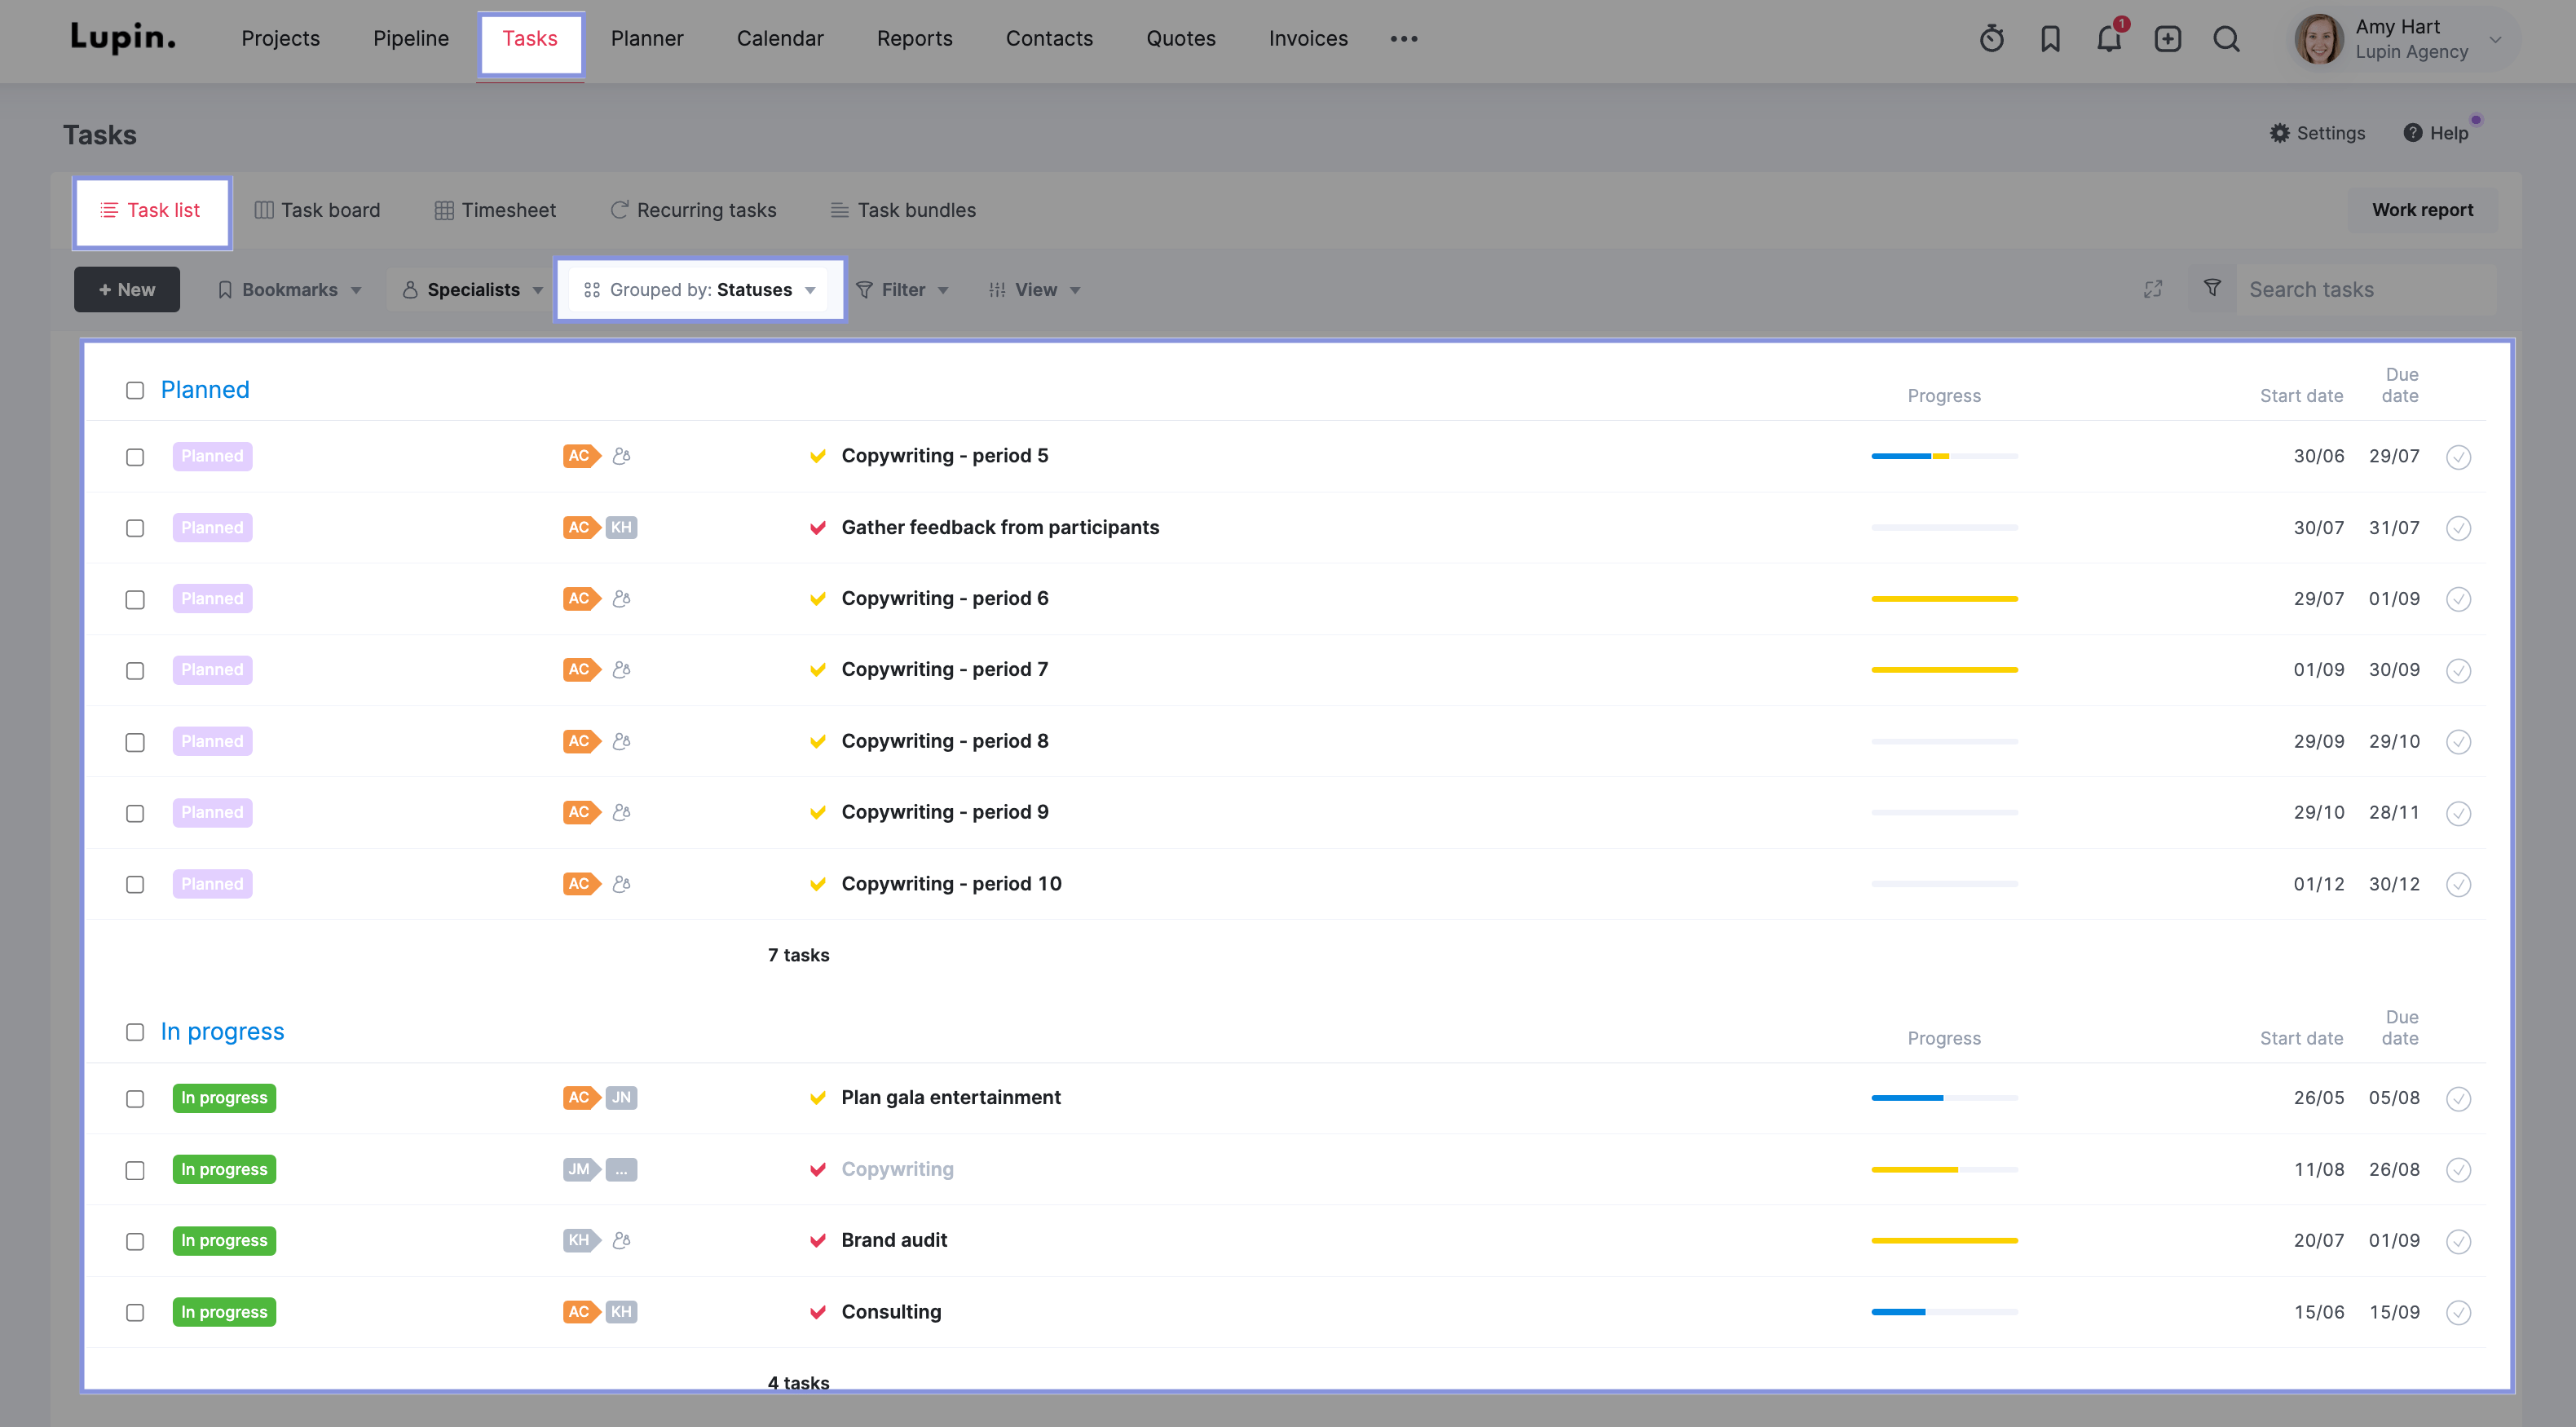
For a deeper dive, head to the “Tasks” module and click the “Task list” tab. Then, select “Statuses” from the “Grouped by” drop-down menu to get an overview of all project tasks by status.
7. Time usage by all projects
Tracking the total hours logged by your team across different projects helps you avoid underutilization and overutilization issues and makes better scoping, scheduling, and staffing choices for future projects.
Example
Let’s say your team has been working on three projects over the month. You notice Project A has consumed 70% of the total hours logged while only accounting for 30% of the project revenue.
This suggests that Project A is taking up more resources than it should. So, you will probably need to make some adjustments to get back on track, like identifying the issue, aligning expectations, and ensuring the right people are working on the project.
Why it matters
Tracking time usage tells you much about whether you are scoping projects and allocating resources efficiently.
If a project takes way longer than expected, you may need to reassess the scope, redistribute tasks, or adjust processes. Otherwise, a tricky project can become a “time suck” that detracts from overall productivity and profitability.
How to track it
Scoro’s “Detailed work report” shows how long each project was supposed to take (in hours) and how long it actually took your team.
You can find it by clicking on the “Reports” module and then on “Detailed report” within the “Work” section.
To see a breakdown of projects and tasks, select “Projects” in the first “Grouped by” drop-down menu, followed by “Tasks/events” in the second “Grouped by” drop-down menu.
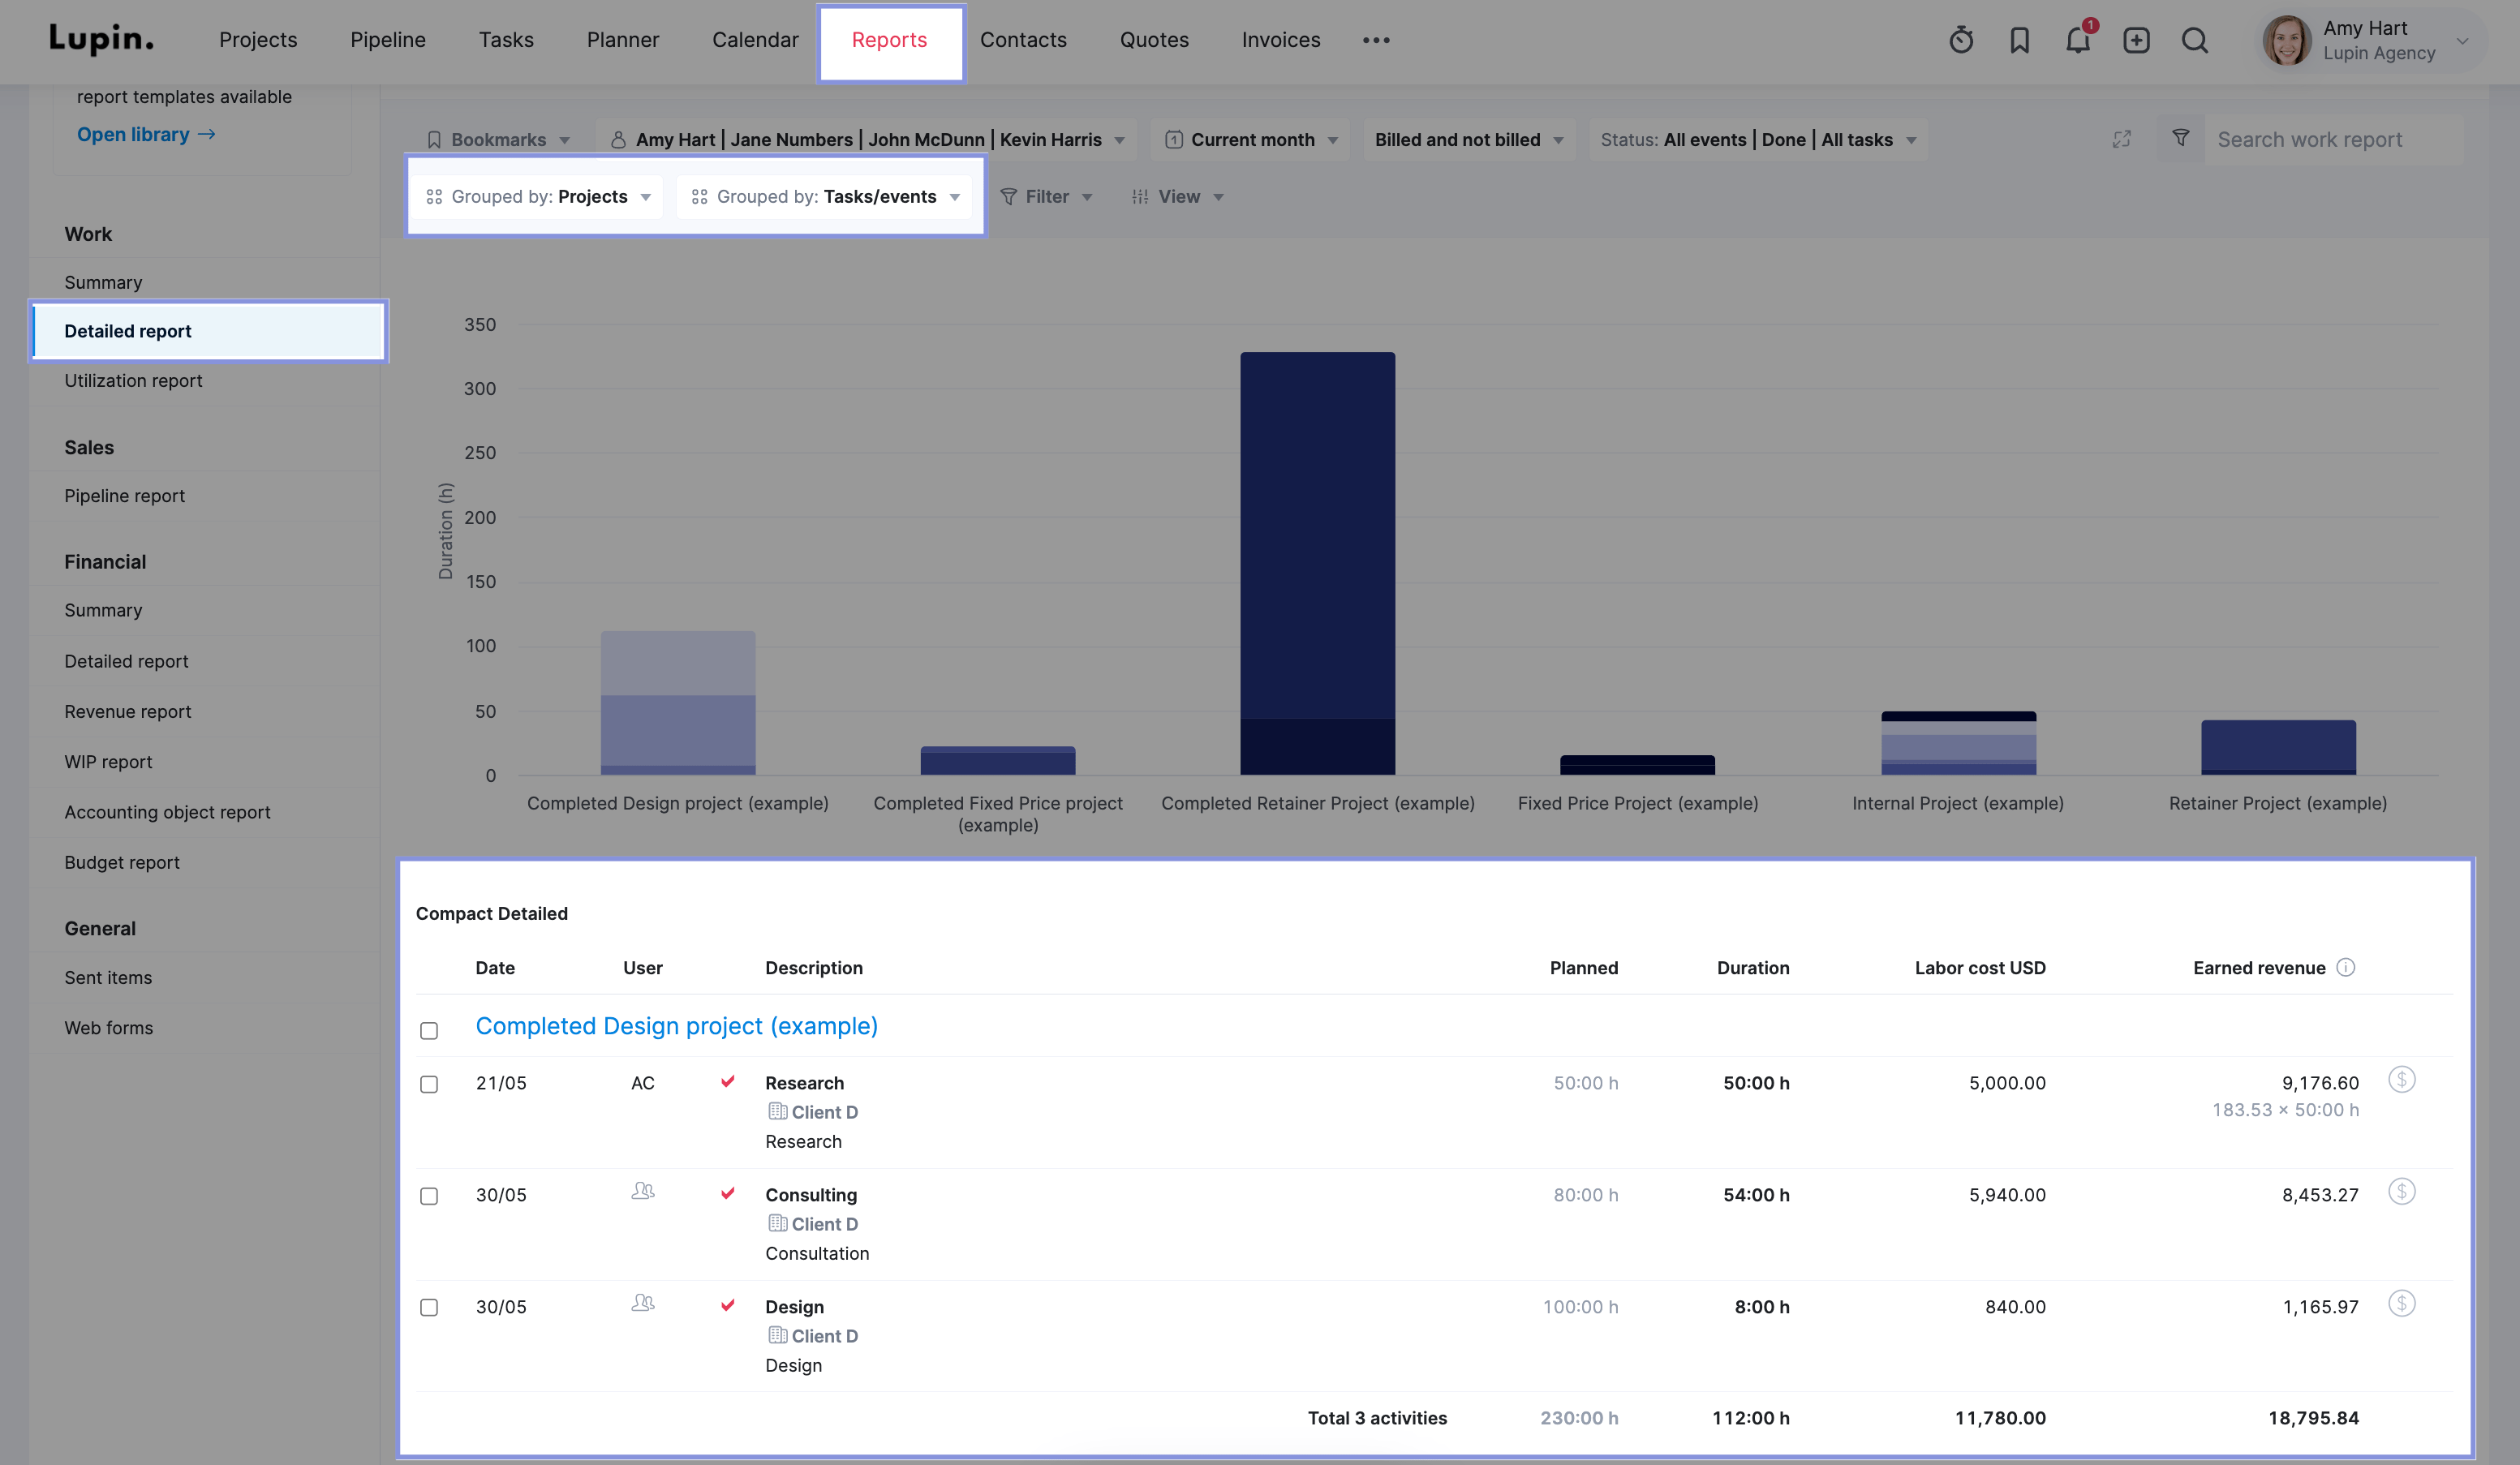
You’ll then see all of your projects showing “Planned” and “Duration” columns to show you how much time has been spent on all tasks within each project.
8. Profitability by projects
Looking at your project profits and losses can help you make informed decisions about which projects to take on and which to pass on.
This metric provides a clear picture of each project’s financial contribution to the business by calculating the project profit after accounting for all direct project revenues and costs (labor and pass-through costs).
Example
Imagine your project generated $10,000 in revenue. After accounting for all associated direct costs, including materials (pass-through costs) and labor, the total expenses amounted to $6,000. This leaves you with a net profit of $4,000.
Why it matters
Profitability by project helps you identify which projects are the true “money makers.” While projects that bring in tons of revenue might initially seem lucrative, you need to factor in your direct costs to determine whether they’re actually worth it.
Digging into the profitability of each project allows you to make informed decisions about where to focus your efforts and resources. So you can support the business’s bottom line and strike a balance between revenue and direct costs.
How to track it
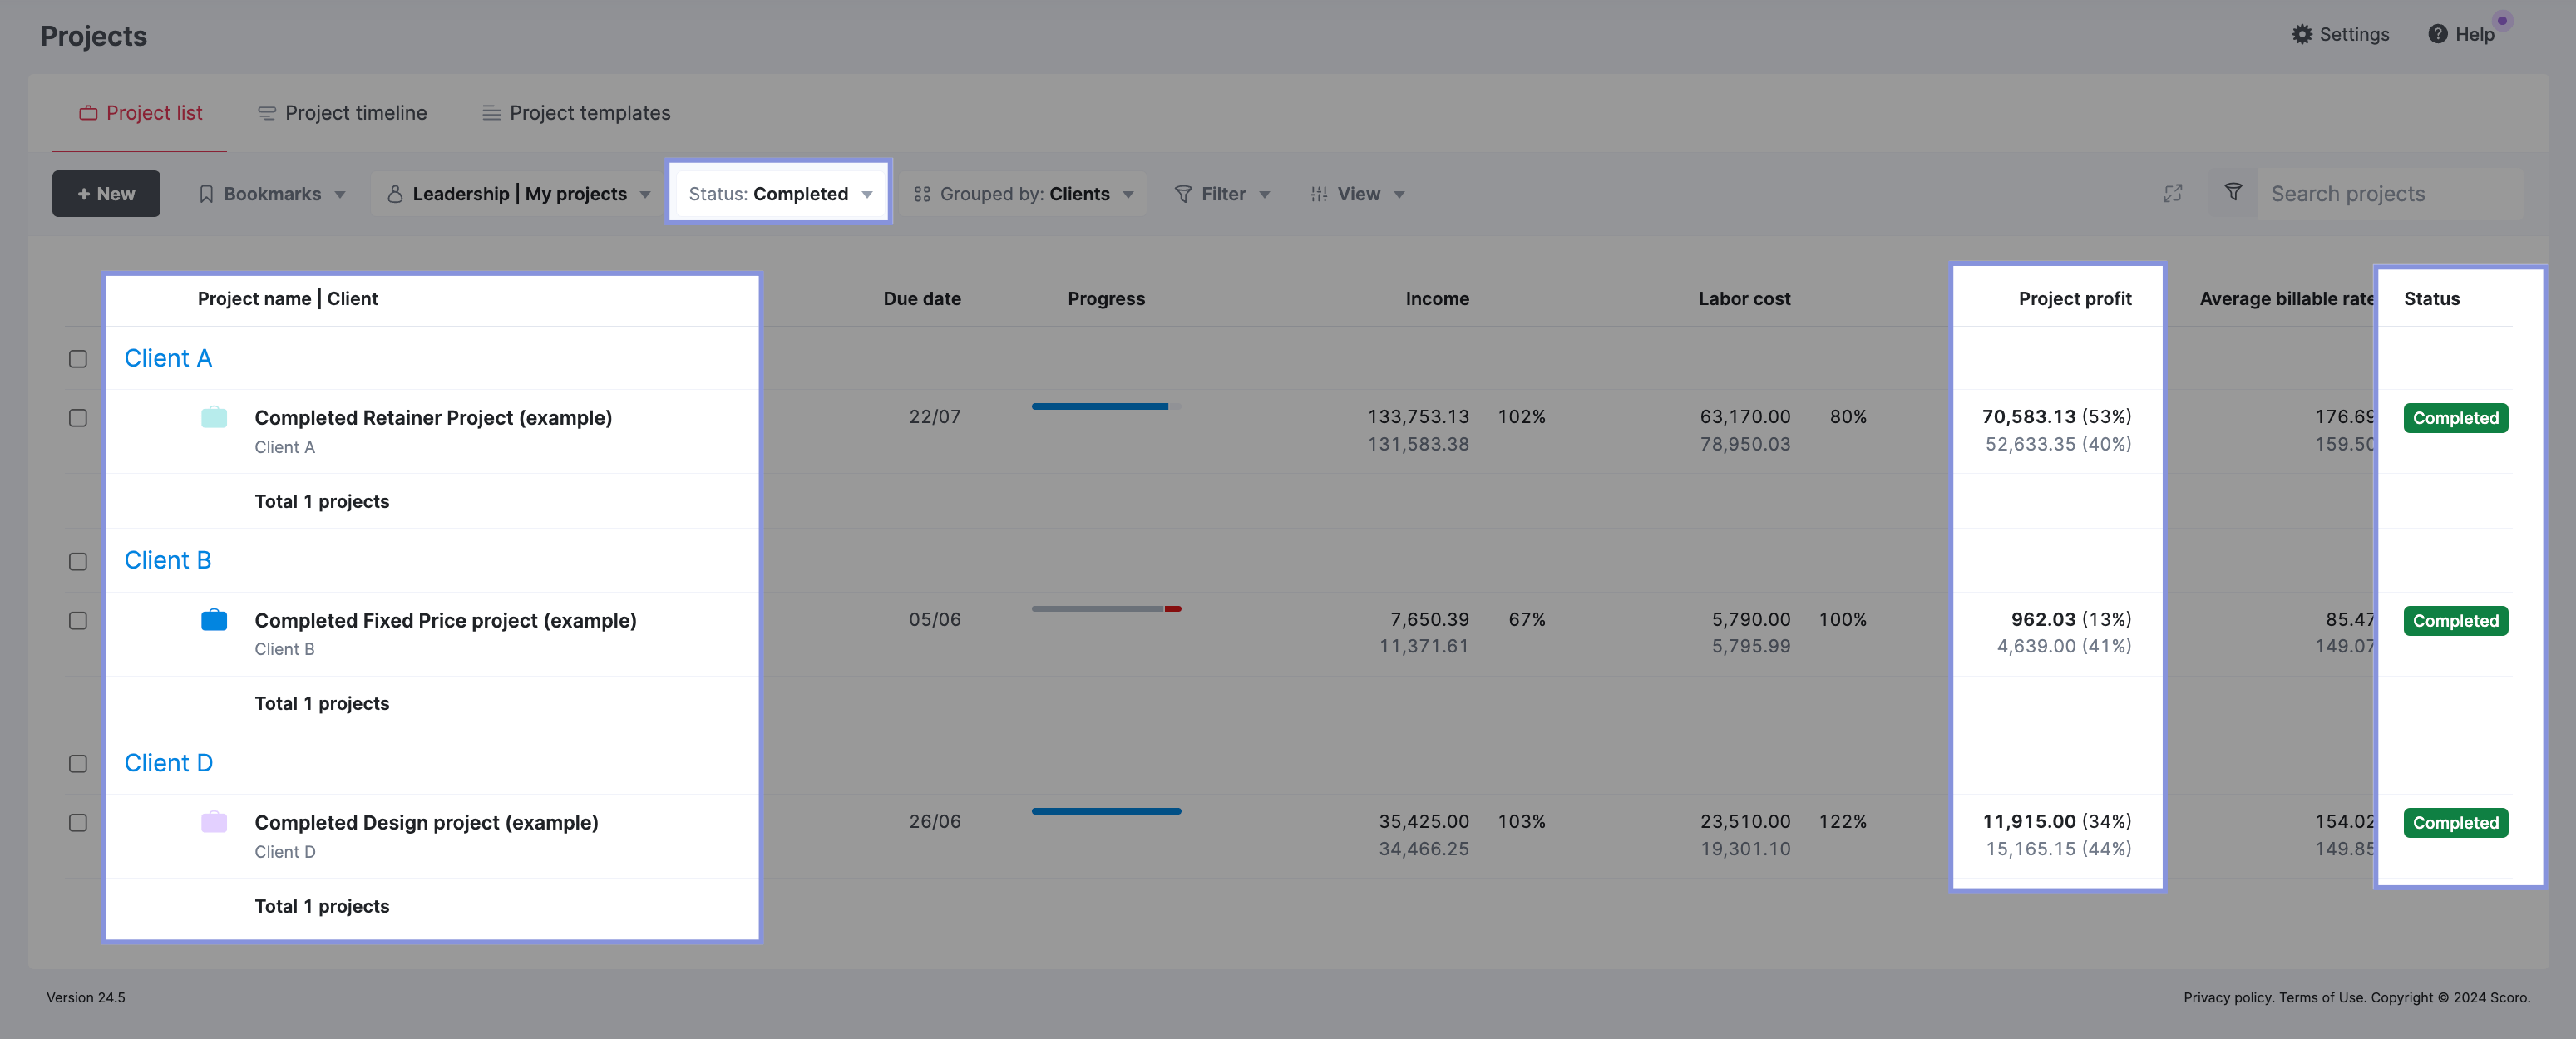
In Scoro, go to the “Project list” view, select “Project profit” in the “Data column” drop-down menu, and select “Completed” in the “Status” drop-down menu.
You can see which past projects made the most profit and which could have done better financially. Understanding what had a better ROI can help you plan and price future projects better.
To view active projects, you can also select “In progress” in the “Status” drop-down menu. This can alert you to issues impacting the budget, allowing you to adjust to improve profitability before the project finishes.
9. Due dates by project
Monitoring when each project needs to be finished helps you manage and prioritize tasks, so your team delivers work on time.
Example
Imagine you have three upcoming deadlines:
- Project A is due tomorrow
- Project B is due next week
- Project C is due in two months
You can strategically plan and prioritize work by keeping a close eye on these due dates. You can also assign the right people to each project based on their availability and skills, which helps prevent bottlenecks and missed deadlines.
Why it matters
Tracking due dates for each project is essential for delivering work on time. It helps you avoid potential delays and adjust project schedules proactively if there’s an issue or delay—like if a team member is sick or on vacation.
Meeting deadlines consistently is key to keeping your clients happy and maintaining your agency’s reputation.
It’s also important for profitability. Regularly missing deadlines can lead to dissatisfied clients who are likely to churn.
How to track it
With Scoro, the “Project list” view provides an overview of all your current projects. And their due dates:
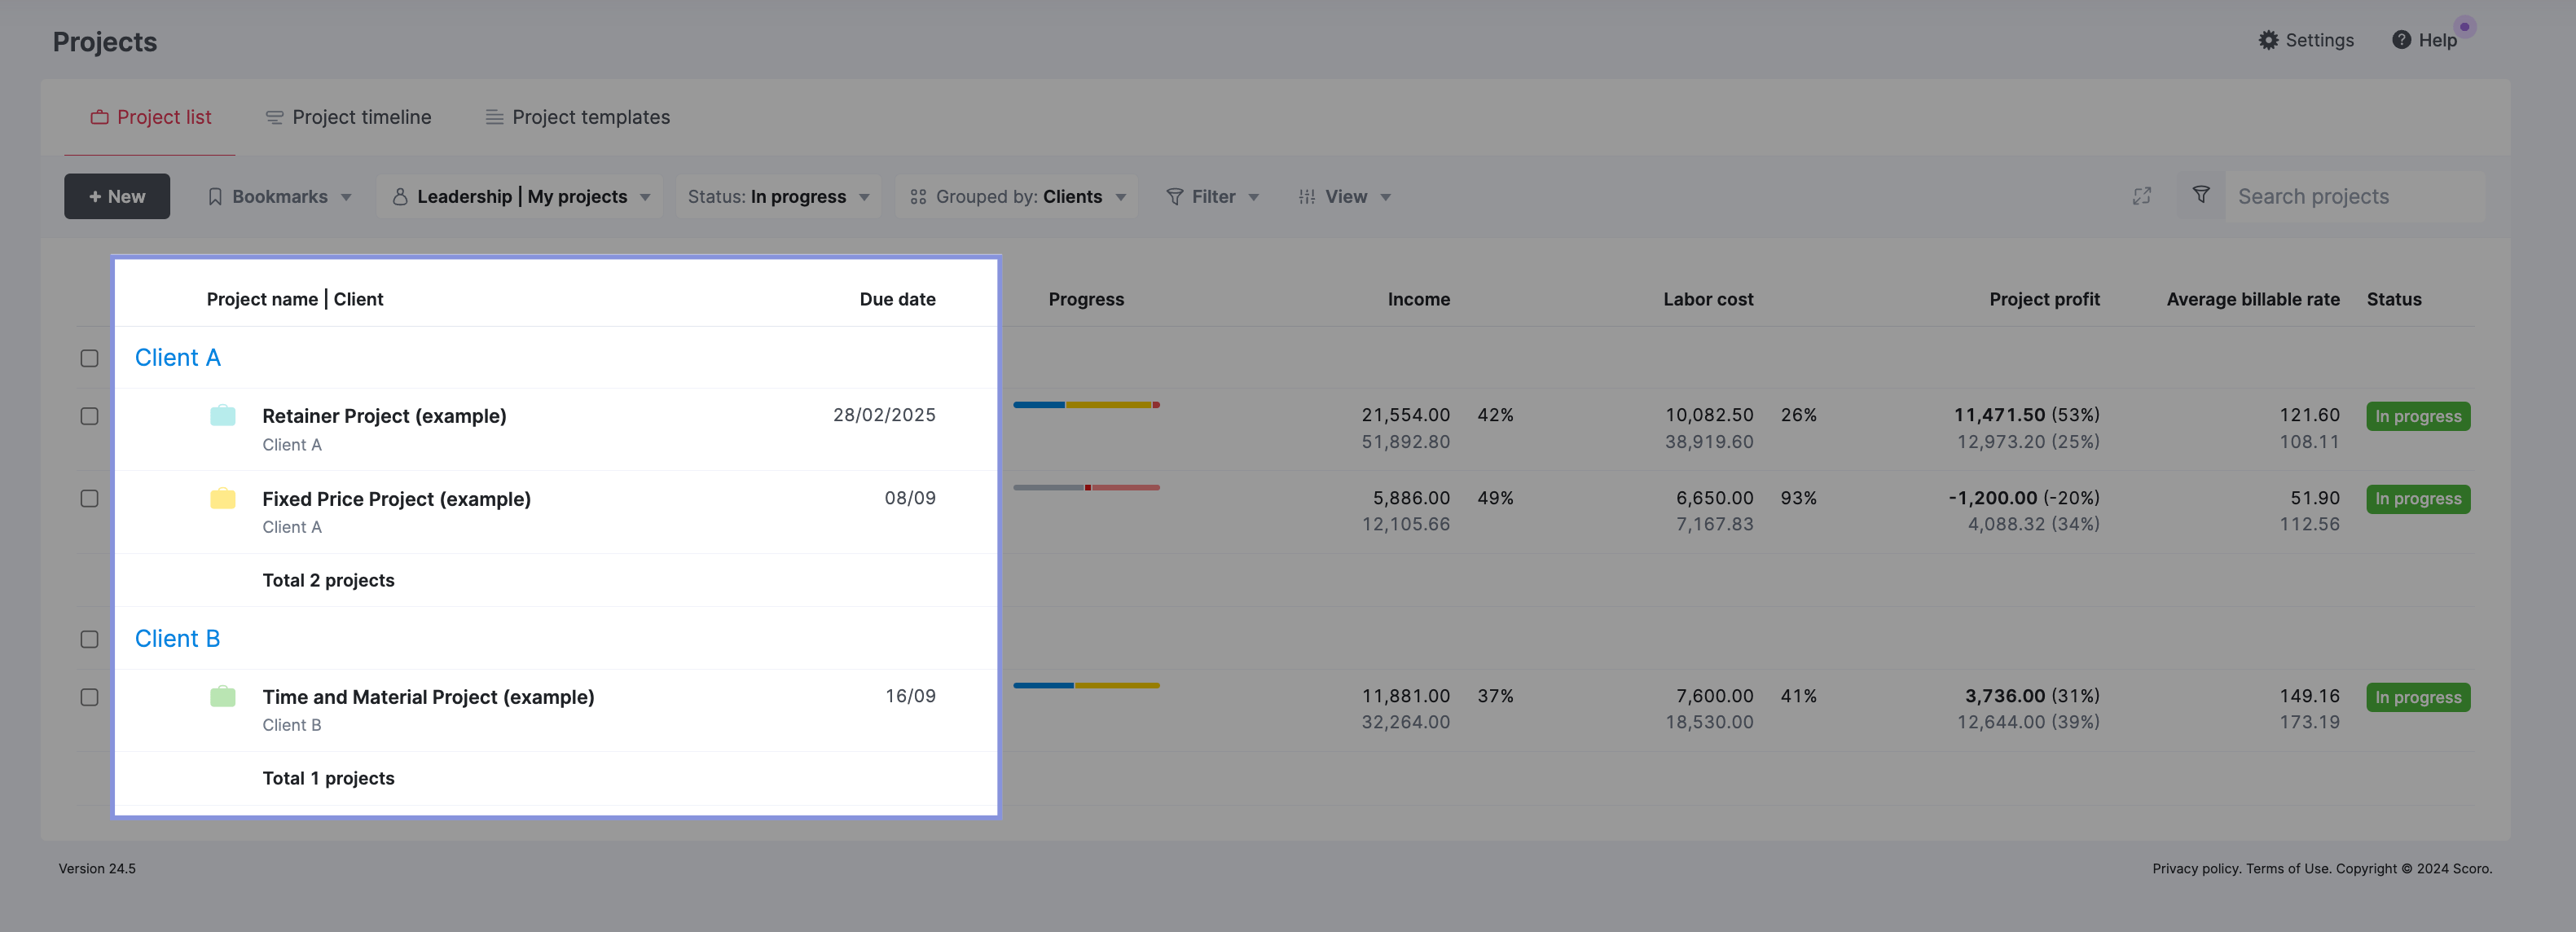
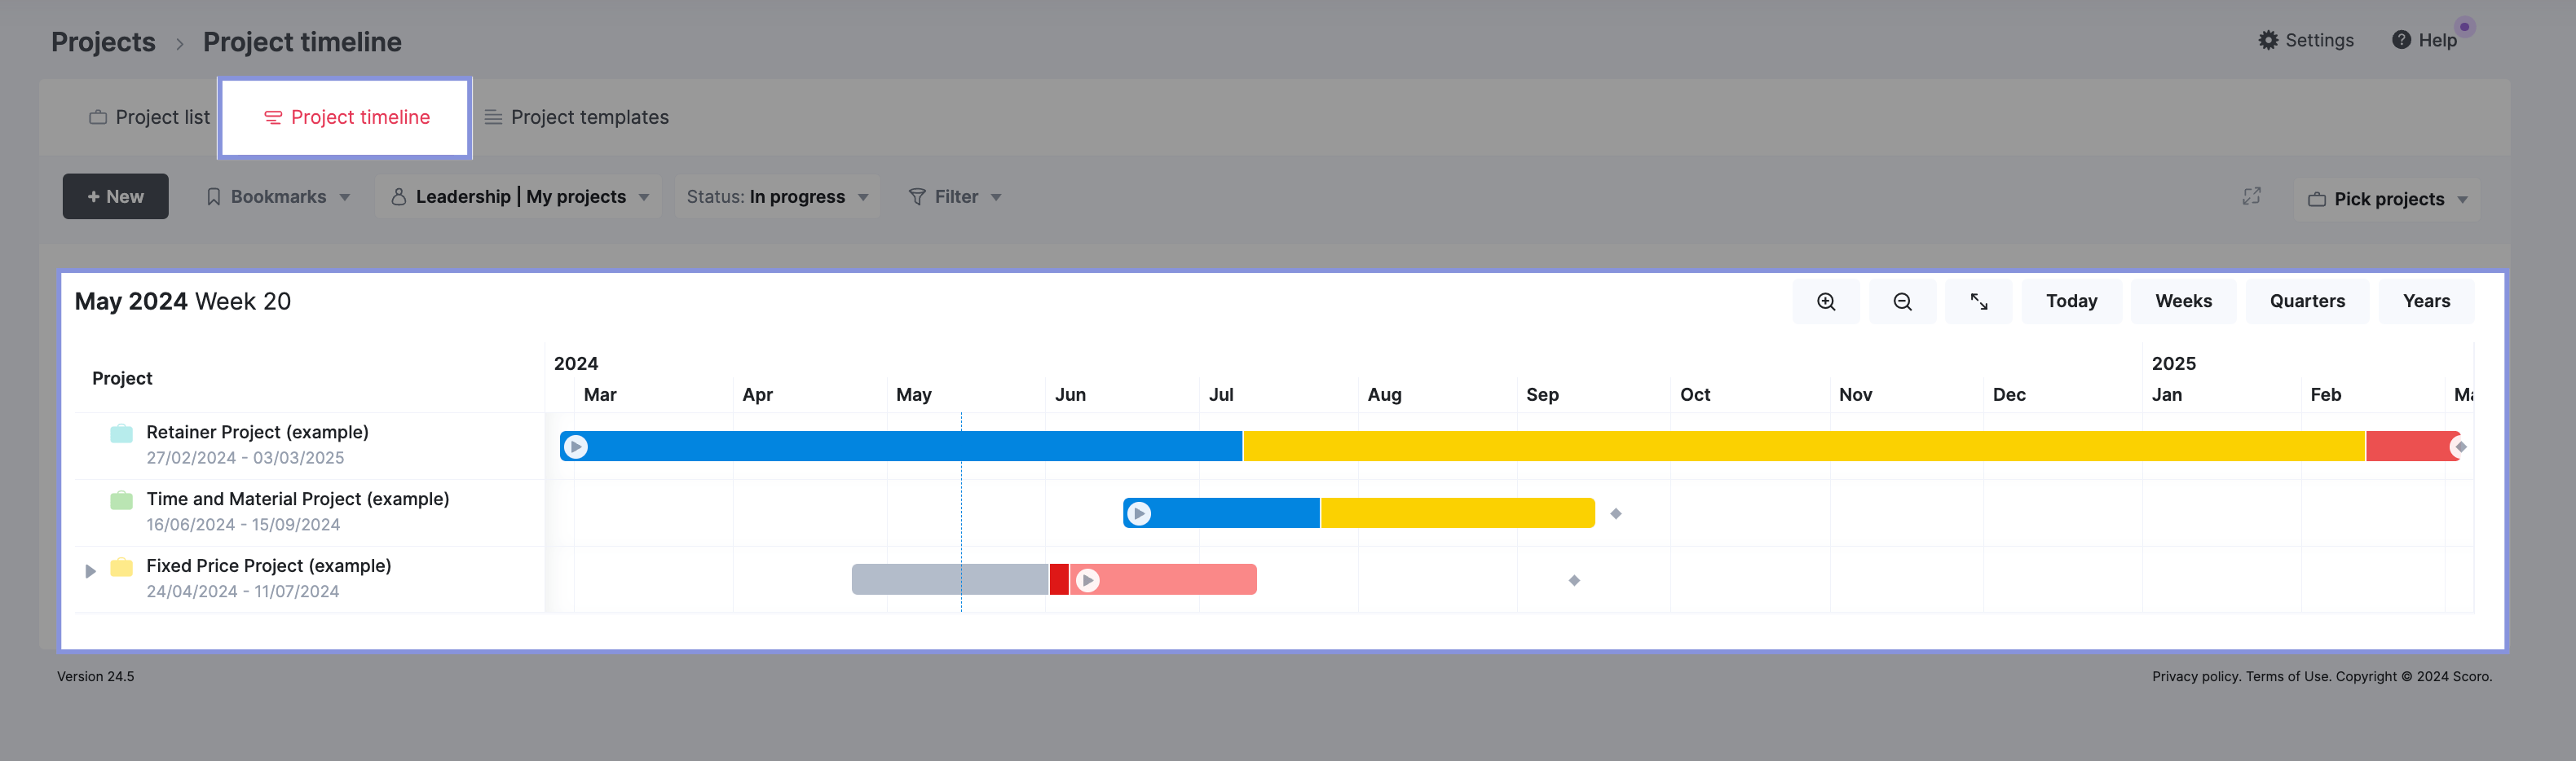
If you click “Project timeline,” you’ll see the due dates in a handy Gantt chart. So you’ll know exactly what’s due and when.
Start tracking and improving your project KPIs
Tracking project performance indicators helps keep projects within scope, within budget, and on time. The easiest way to monitor the metrics that matter is with project dashboard software.
Scoro’s Project Management KPI dashboard lets you monitor your most important data in one place. It shows you a single source of truth for your current projects and their status budget and revenue data to keep you on track as you scale.
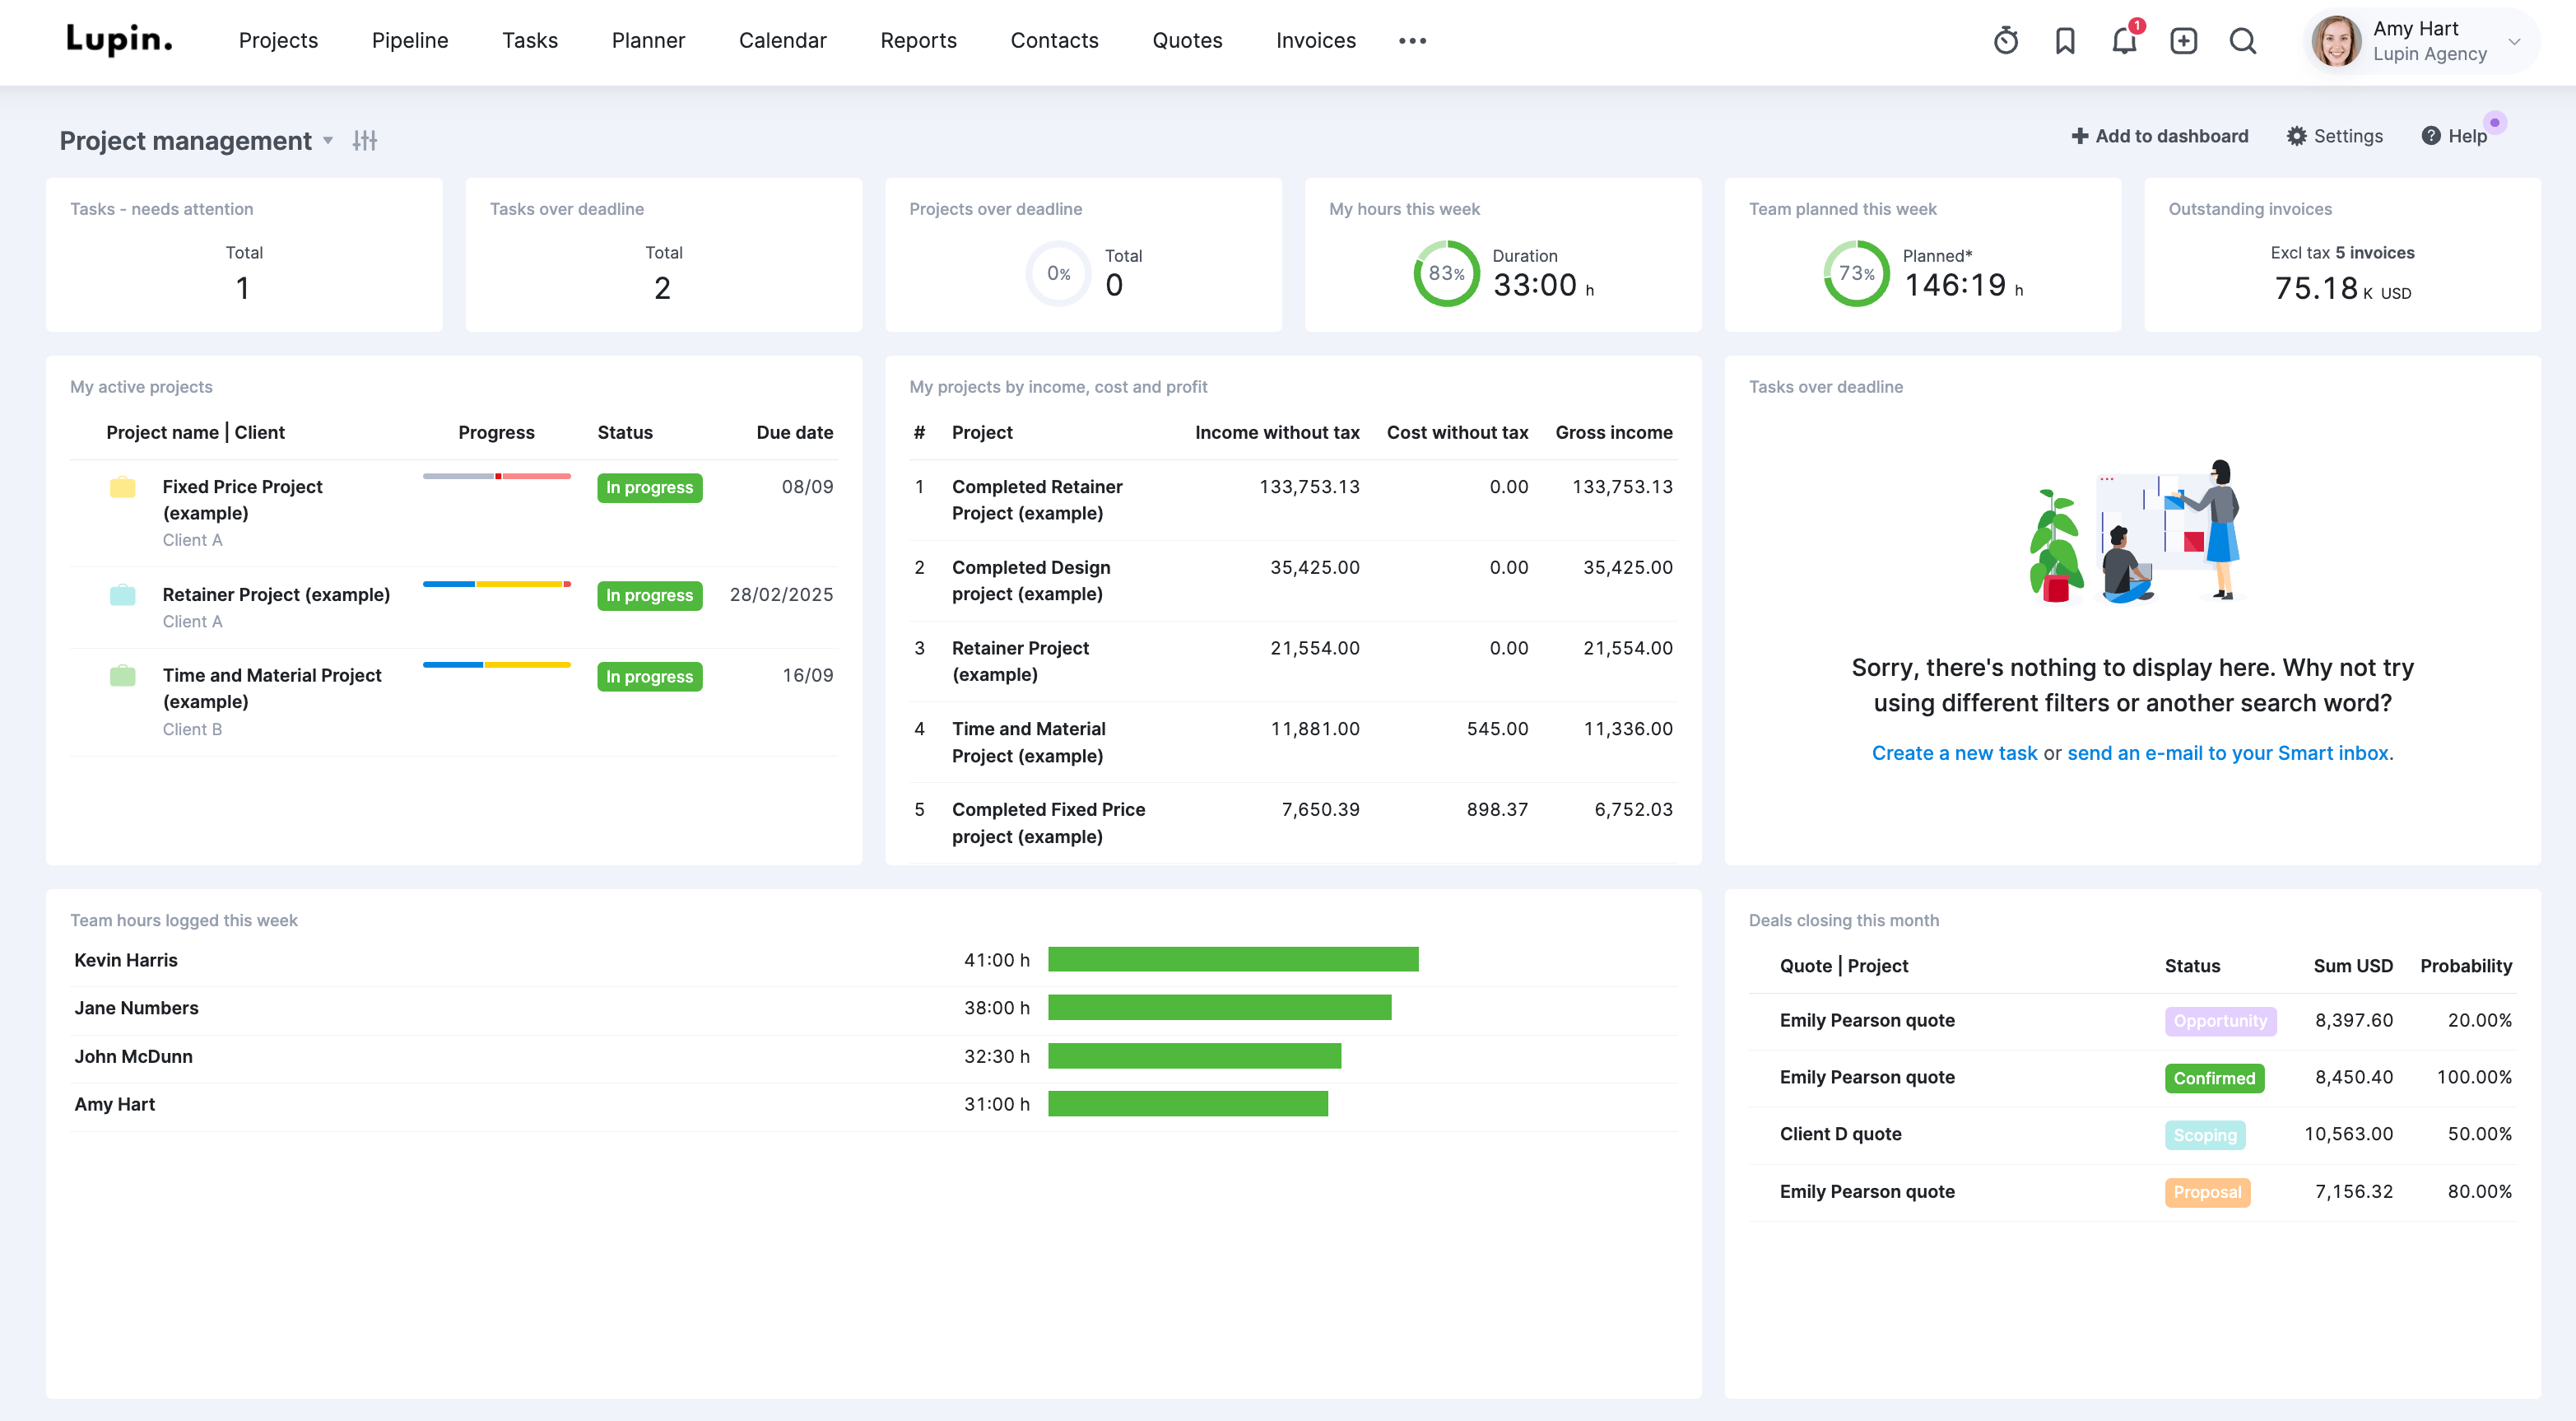
You can start simple and then build more complex dashboards as you need to. This way, you, project stakeholders, and senior leadership can operate with real-time data, inform future decisions, and support sustainable business growth.