

Effectively managing agency operations is a lot more than just standardizing processes.
It’s also about understanding the financial side of things. And use that information to make more informed decisions to help your agency progress and grow.
Enter agency margins.
When you can accurately understand, calculate, and track how much (or how little) your agency is making on different projects and accounts, you can find opportunities to increase profits and add even more value to the work you’re already doing.
This guide covers everything you need about agency margins, including key metrics, calculations, and benchmarks.
Key agency margins explained
Focus on three main agency profit margins:
1. Agency gross margin
Agency gross margin is a percentage that represents the revenue remaining after subtracting pass-through expenses from total revenue.
Pass-through costs are bills and expenses that your agency incurs from third parties (vendors, contractors, etc.) when delivering client services. These are billed to the client at cost with no markup.
To calculate gross margin, you take the total revenue billed to clients and subtract any pass-through expenses paid to external vendors/contractors.
Let’s say your agency generated $250,000 in one month but spent $50,000 on pass-through costs related to project work.
Your gross income would be $200,000 ($250,000 – $50,000), and your revenue would be $250,000.
Using those numbers, here’s how we’d calculate your gross margin: ($200,000 / 250,000) * 100 = 80%
So, after all was said and done, your agency could keep 80% of the total revenue generated that month.
Calculating your gross margin is key to understanding how lucrative certain projects and accounts truly are.
Why?
Because looking at total revenue alone can be very deceiving.
For example, let’s look at the two projects below:
| Project | Revenue | Pass-through expenses | Gross income | Gross margin |
|---|---|---|---|---|
| Project A | $500,000 | $400,000 | $100,000 | 20% |
| Project B | $200,000 | $25,000 | $175,000 | 87.5% |
At first glance, Project A seems like the winner here—until you look at the gross margins.
Project A had $400,000 in bills and expenses, while Project B only had $25,000.
Project A generated only $100,000 in revenue, with a gross margin of 20% ($100,000 / $500,000 * 100).
On the other hand, Project B generated $175,000 in revenue, with a much higher gross margin of 87.5% ($175,000 / $200,000 * 100).
2. Delivery profit margin
The delivery profit margin tells you how much your gross income is spent on delivering the work compared to generating profit.
Calculate the delivery margin using this formula:
Where:
- Gross Income = Total Revenue – Pass-Through Costs
- Delivery Costs = Internal labor costs (payroll)
Let’s say your agency had $200,000 in gross revenue for a project after subtracting $50,000 in pass-through costs from $250,000 in total billings.
To complete that project work, you incurred $120,000 in delivery costs.
Using those numbers, here’s how we calculate the delivery profit margin:
Gross Revenue = $200,000 Delivery Costs = $120,000
Delivery Profit Margin % = (($200,000 – $120,000) / $200,000) x 100
= ($80,000 / $200,000) x 100
= 0.4 x 100 = 40%
So, in this example, your agency spent 60% ($120,000) of the $200,000 gross revenue on internal delivery costs, leaving 40% ($80,000) as profit.
A 40% delivery profit margin means you retained $0.40 in profit for every $1 of gross revenue after covering project delivery expenses.
Tracking delivery margins helps you identify the most profitable projects based on how efficiently your team delivers the work. Unlike gross margin, which looks at overall profitability, delivery margin focuses on the profit generated from the money you’ve already earned after accounting for labor costs.
3. Net profit margin
Your net profit margin provides a comprehensive view of your agency’s overall profitability, considering all expenses, not just those directly related to project delivery.
While the gross and delivery margins offer insights into project-level profitability, the net profit margin shows you the bigger picture of your agency’s financial health.
Unlike your delivery margin, which only factors in delivery costs when calculating profitability, your net margin also factors in overhead (operating) costs.
Such as:
- Office space rent
- Utilities
- Admin salaries
- Software subscriptions
Use this formula to find your net margin:
Where: Net Profit = Delivery Profit – Overhead Costs
Building on the previous example with:
- Total Revenue = $250,000 Gross Revenue = $200,000 (after $50,000 pass-through costs)
- Delivery Costs = $120,000
- Delivery Profit = $80,000
Let’s also assume overhead costs = $40,000
Step 1: Calculate Net Profit
Net Profit = Delivery Profit – Overhead Costs = $80,000 – $40,000 = $40,000
Step 2: Calculate Net Profit Margin
Net Profit Margin % = (Net Profit / Total Revenue) x 100 = ($40,000 / $250,000) x 100 = 0.16 x 100 = 16%
So, with a total revenue of $250,000, after covering $120,000 in delivery costs and $40,000 in overhead, the agency had a net profit of $40,000, representing a 16% net profit margin.
After accounting for all expenses, this shows the percentage of total revenue left as a true bottom-line profit. Tracking net profit margin gives you the big picture of your agency’s overall profitability and financial health.
How to accurately calculate agency margins every time
Calculating and reviewing your agency margins regularly gives you much more flexibility to adjust and improve profitability before it’s too late.
Ideally, you should determine your agency margins at least monthly. This gives you room to adjust as work progresses and apply your insights to boost profits for future work.
Here are six steps to correctly capture your agency’s gross, delivery profit, and net profit margins:
1. Determine your total revenue
Add up all the invoices you’ve issued and been paid for within your chosen timeframe.
You can do this manually, but it’s tedious and easy to make errors, like missing invoices.
With an agency management platform like Scoro, automatic revenue calculations factor in all your logged invoices.
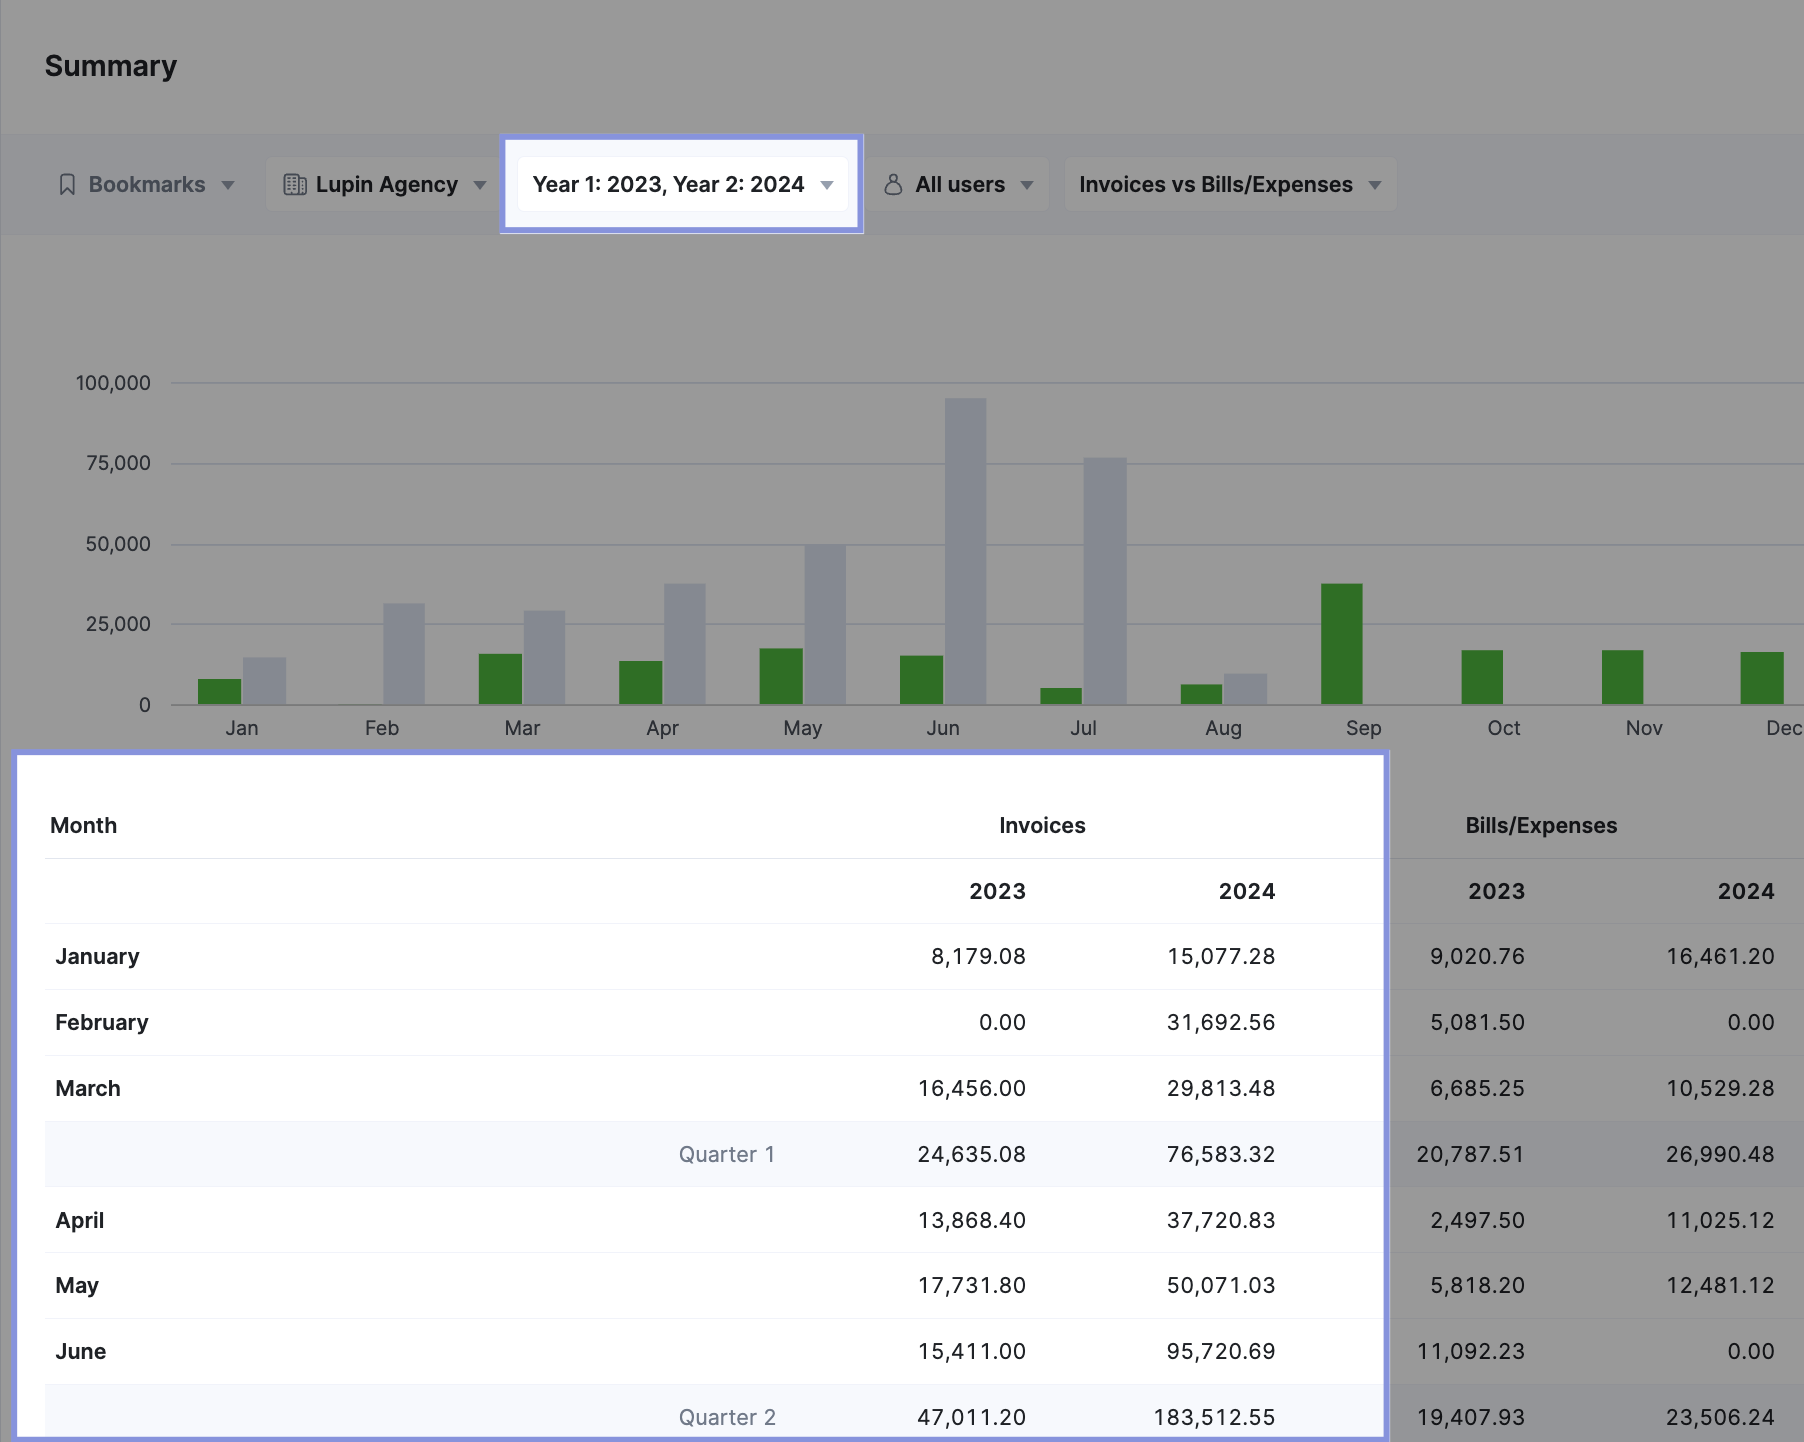
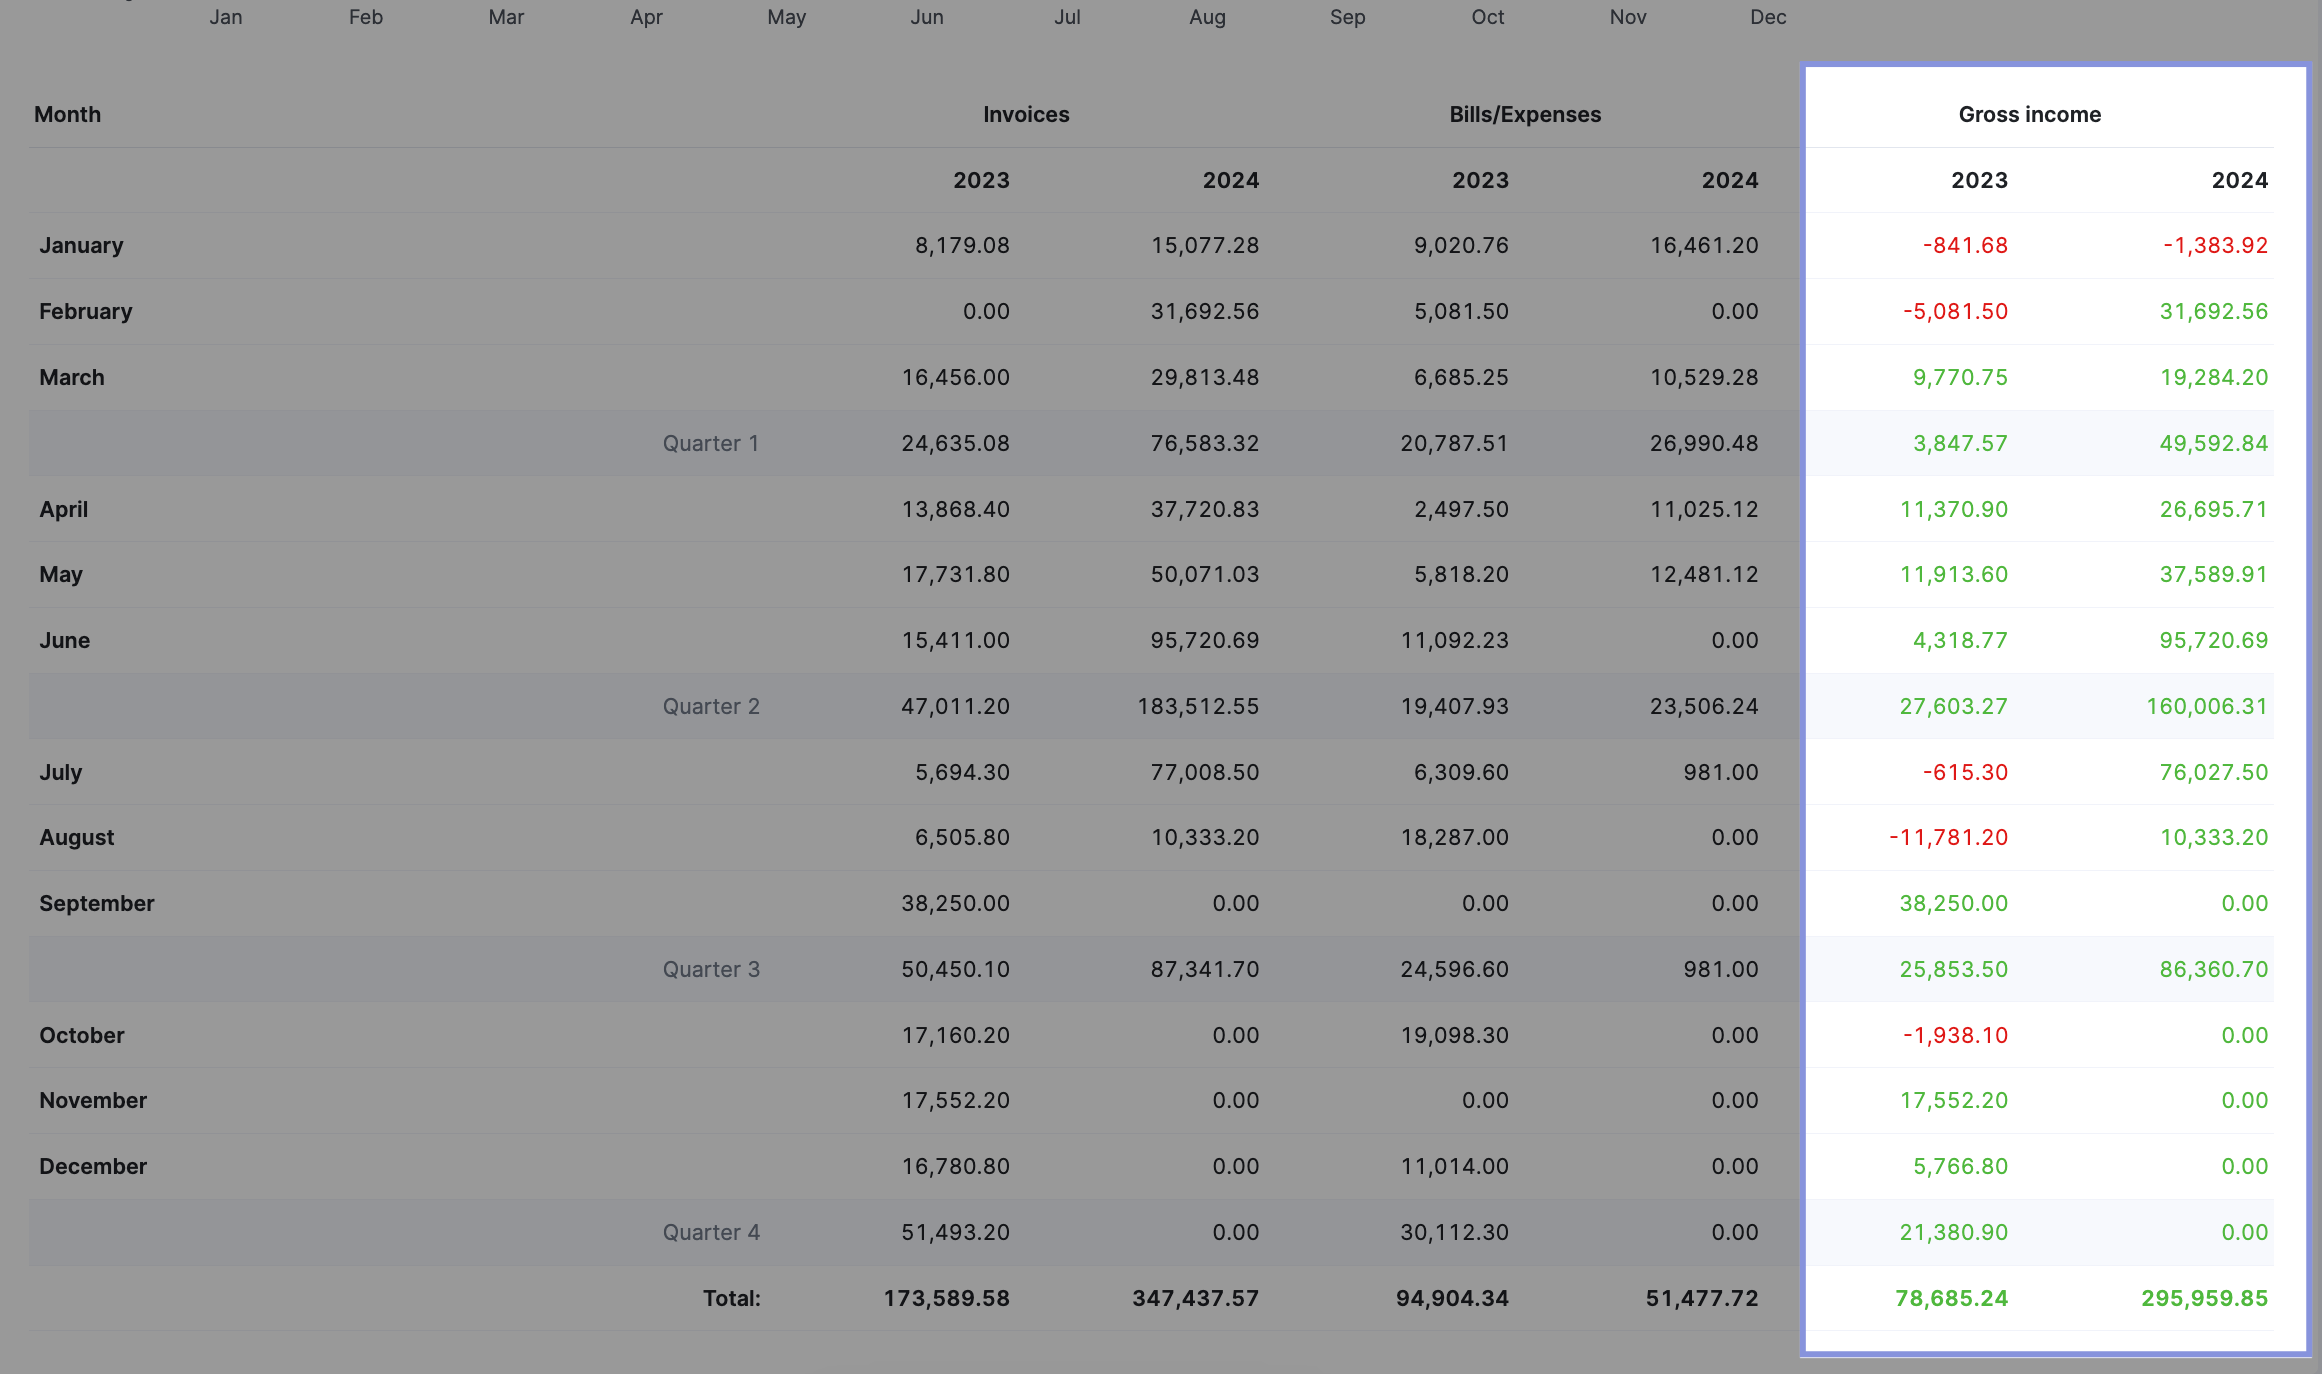
Go to the “Summary” financial report. Then, click “Invoices” in the upper right corner. Use the second drop-down button at the top of the page to select your time period.
Under the “Invoices” column, you’ll see your total revenue comparisons by year, month, and quarter.
2. Add up your total bills and expenses
Next, add up all your project-related bills and expenses (pass-through costs) for this timeframe.
Normally, you’d need to connect with Finance or Accounting to track this data. It might be stored in their accounting software, in a separate expense-tracking platform, in physical receipts—or even all three.
Save time and skip the back-and-forth hassle with Scoro.
All your bills and expenses are stored in a single, digital source of truth, syncing with real-time platforms like Expensify and Quickbooks. And everything is automatically categorized under separate “Bills” and “Expenses” tabs.
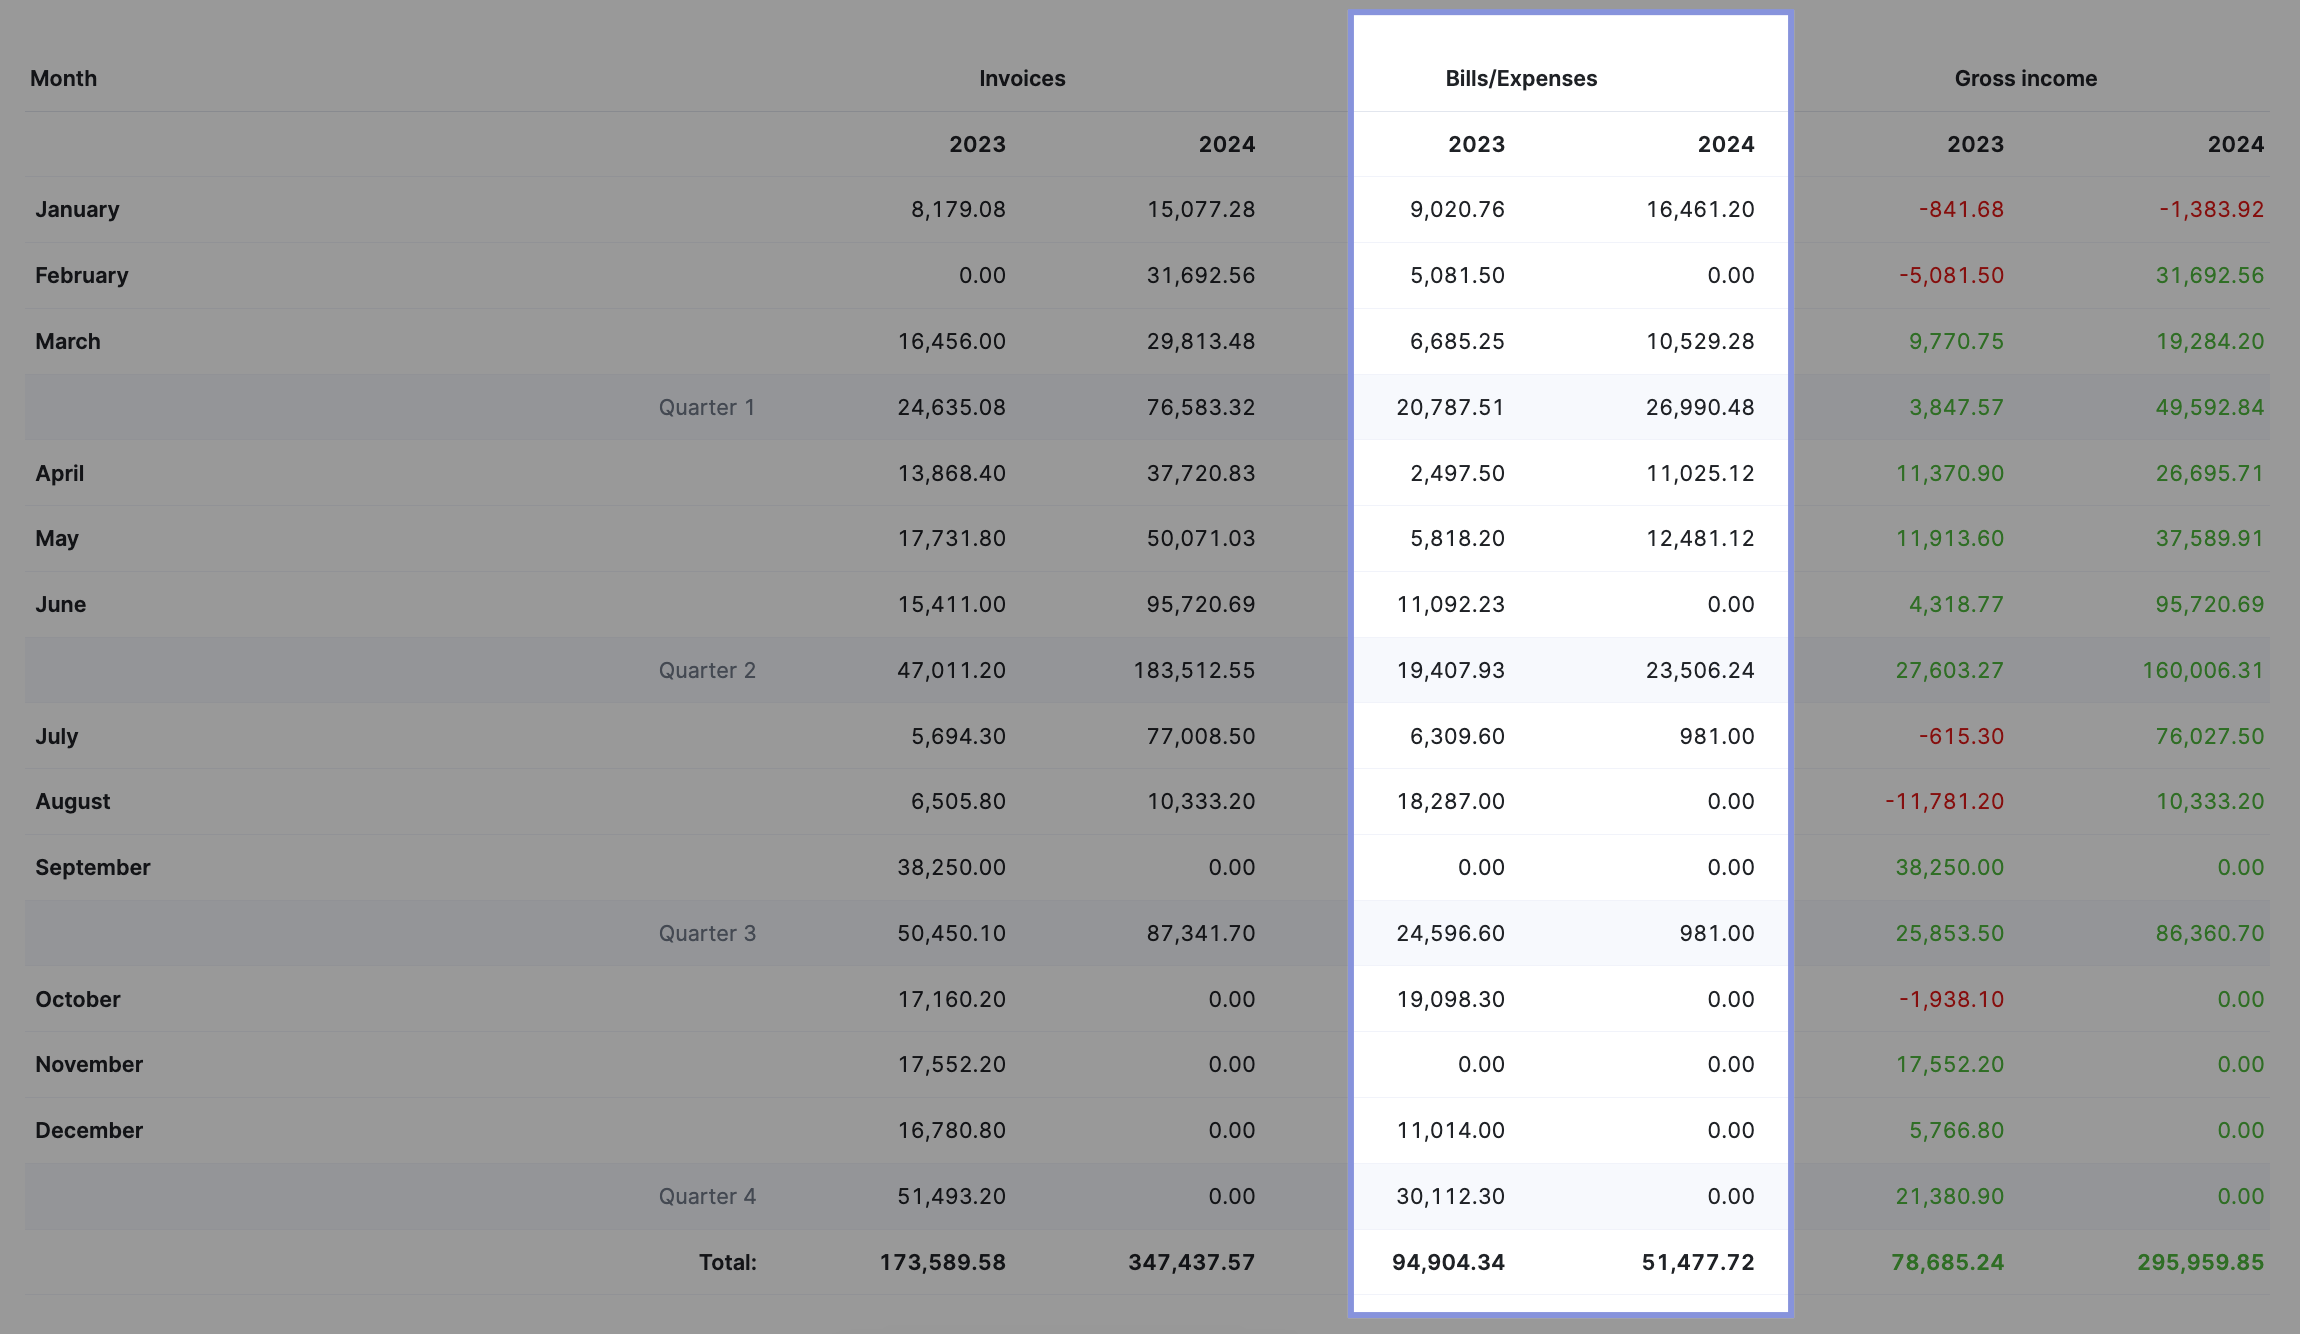
View all your bills and expenses in the “Summary” report in the “Bills/Expenses” column.
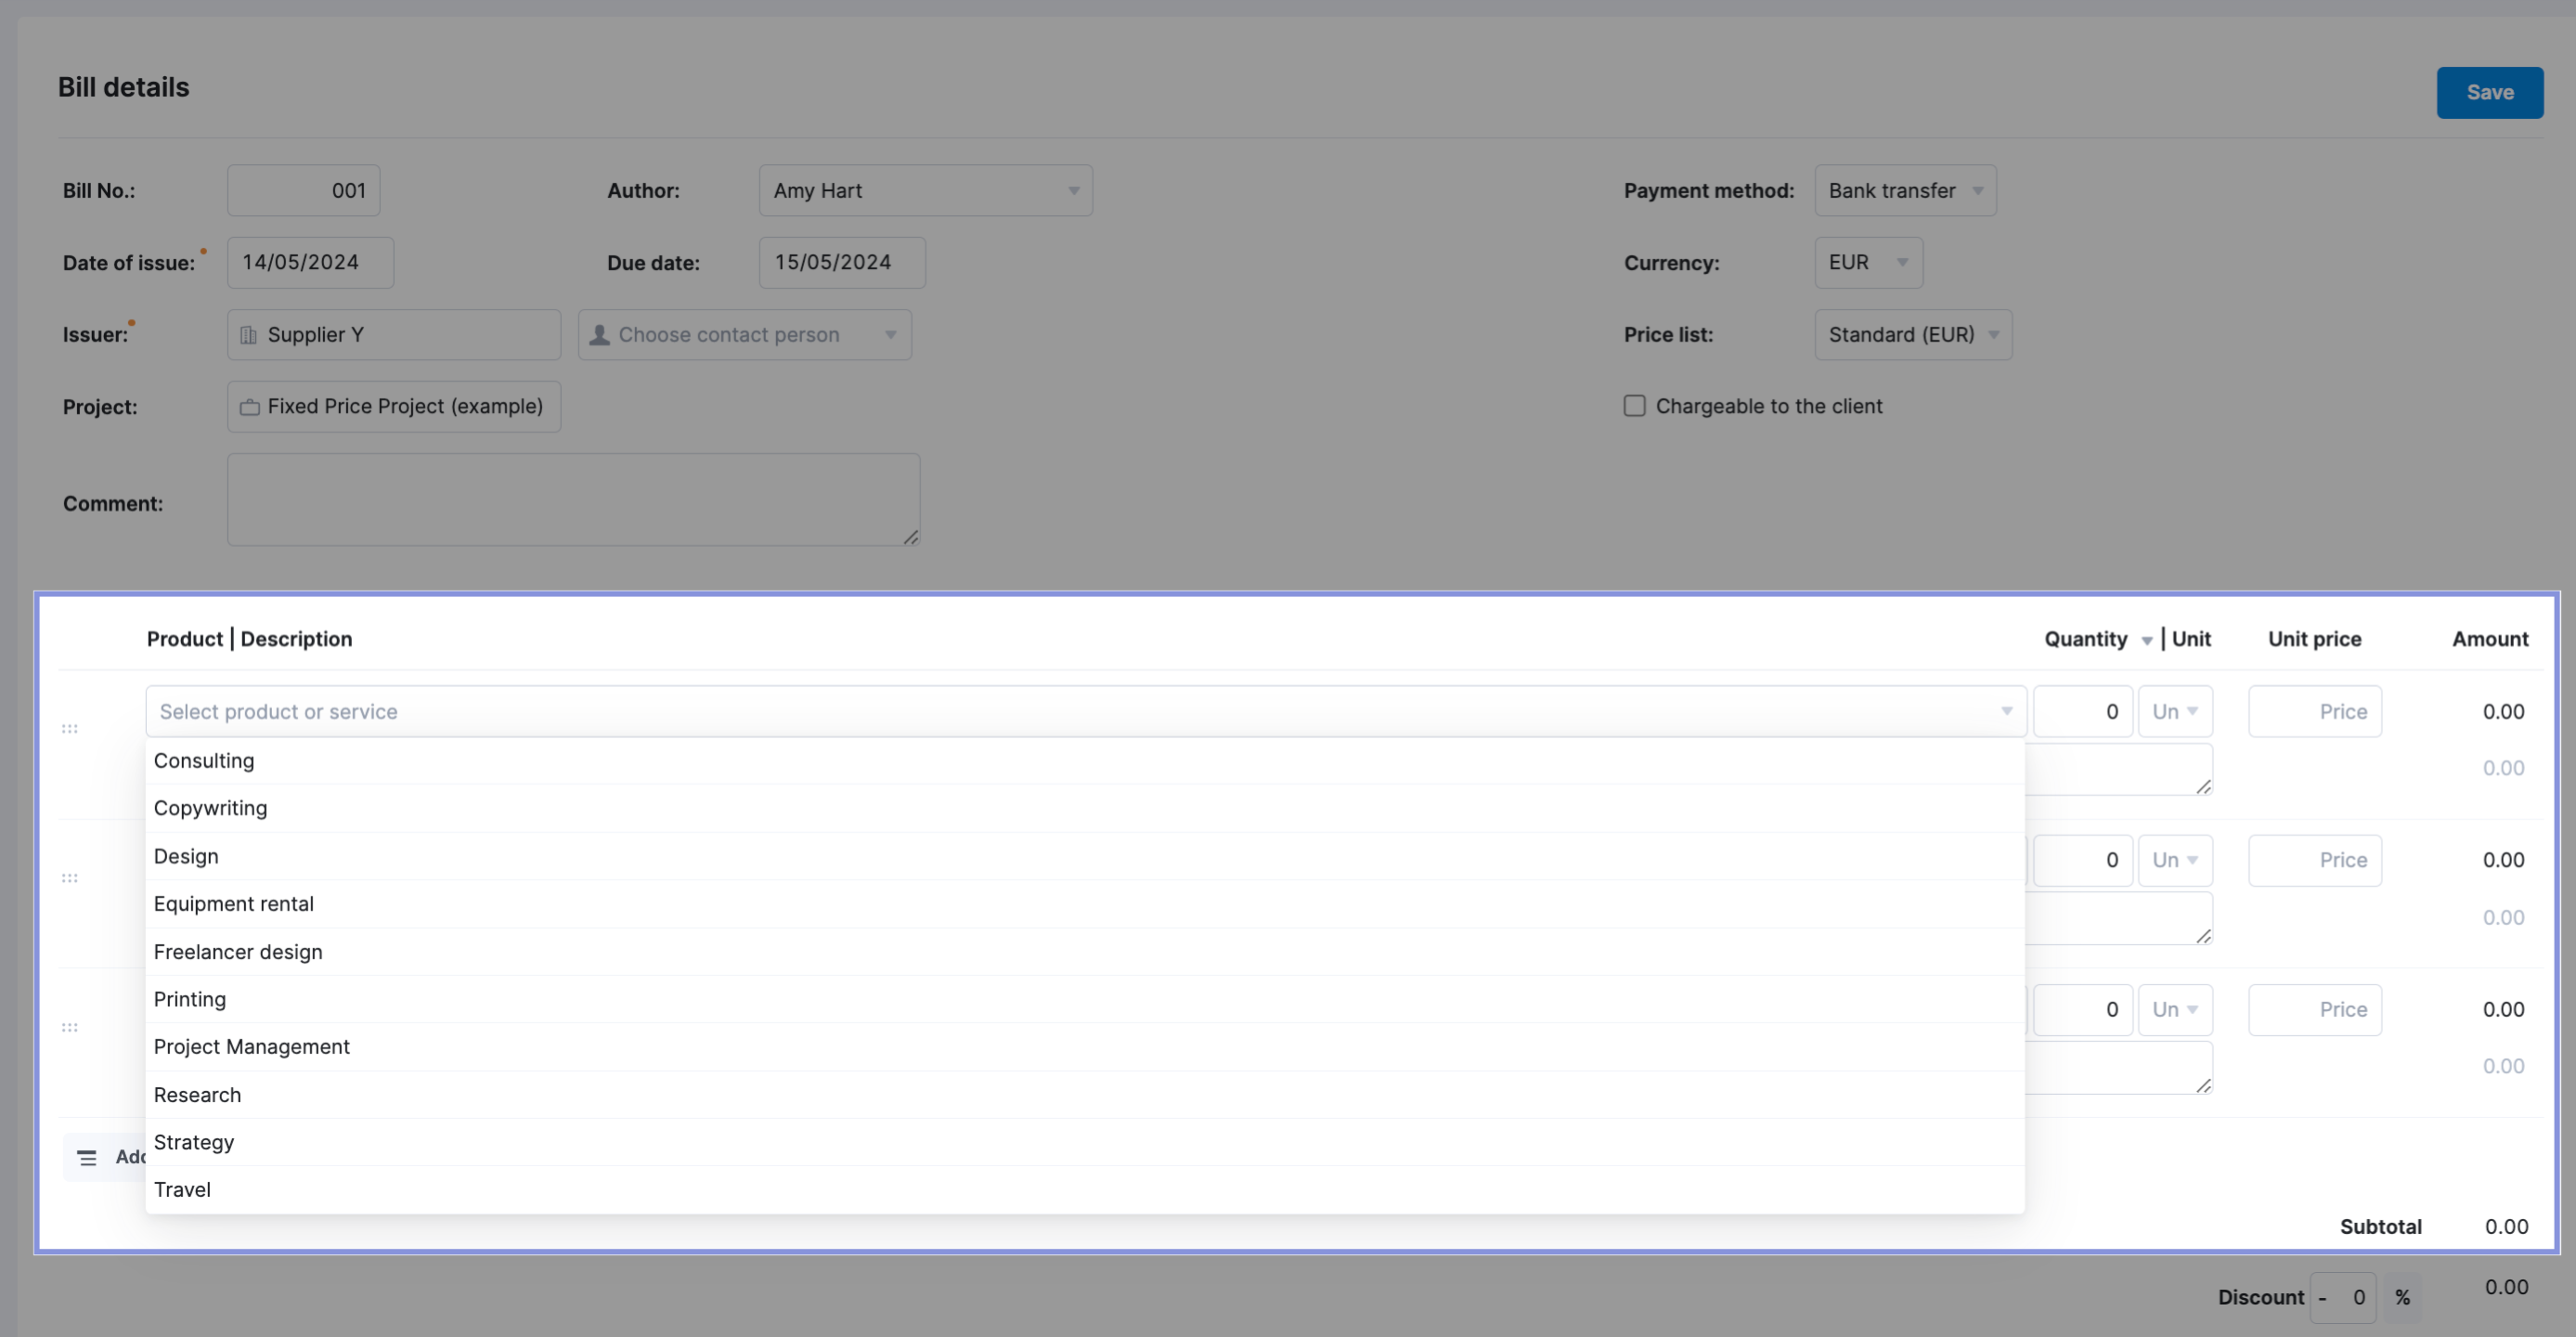
If you do want to manually upload, say, a one-off expense:
Go to “Purchases” -> “Bills.” Then, click “+New” to add a new expense.
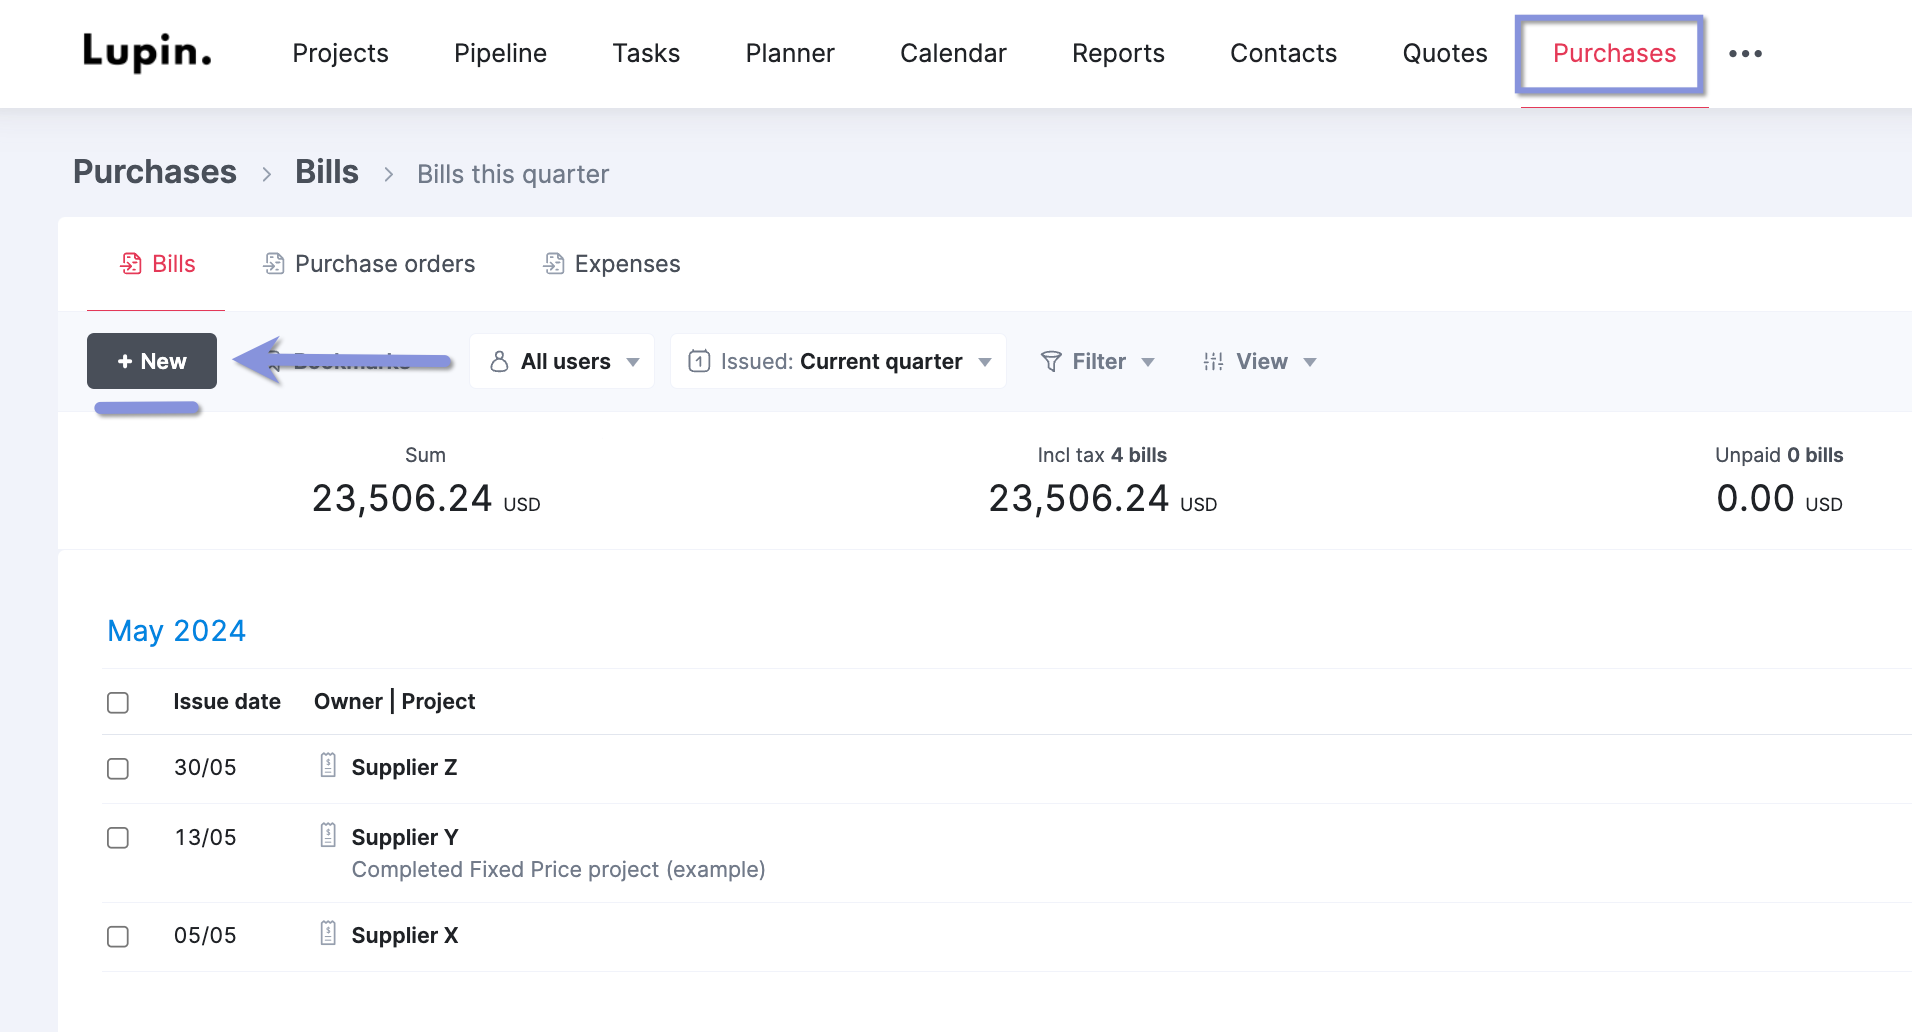
Fill out the relevant data. And link the expense to the relevant project using the “Project” dropdown. This way, you can see all project-related expenses in that specific Project view.
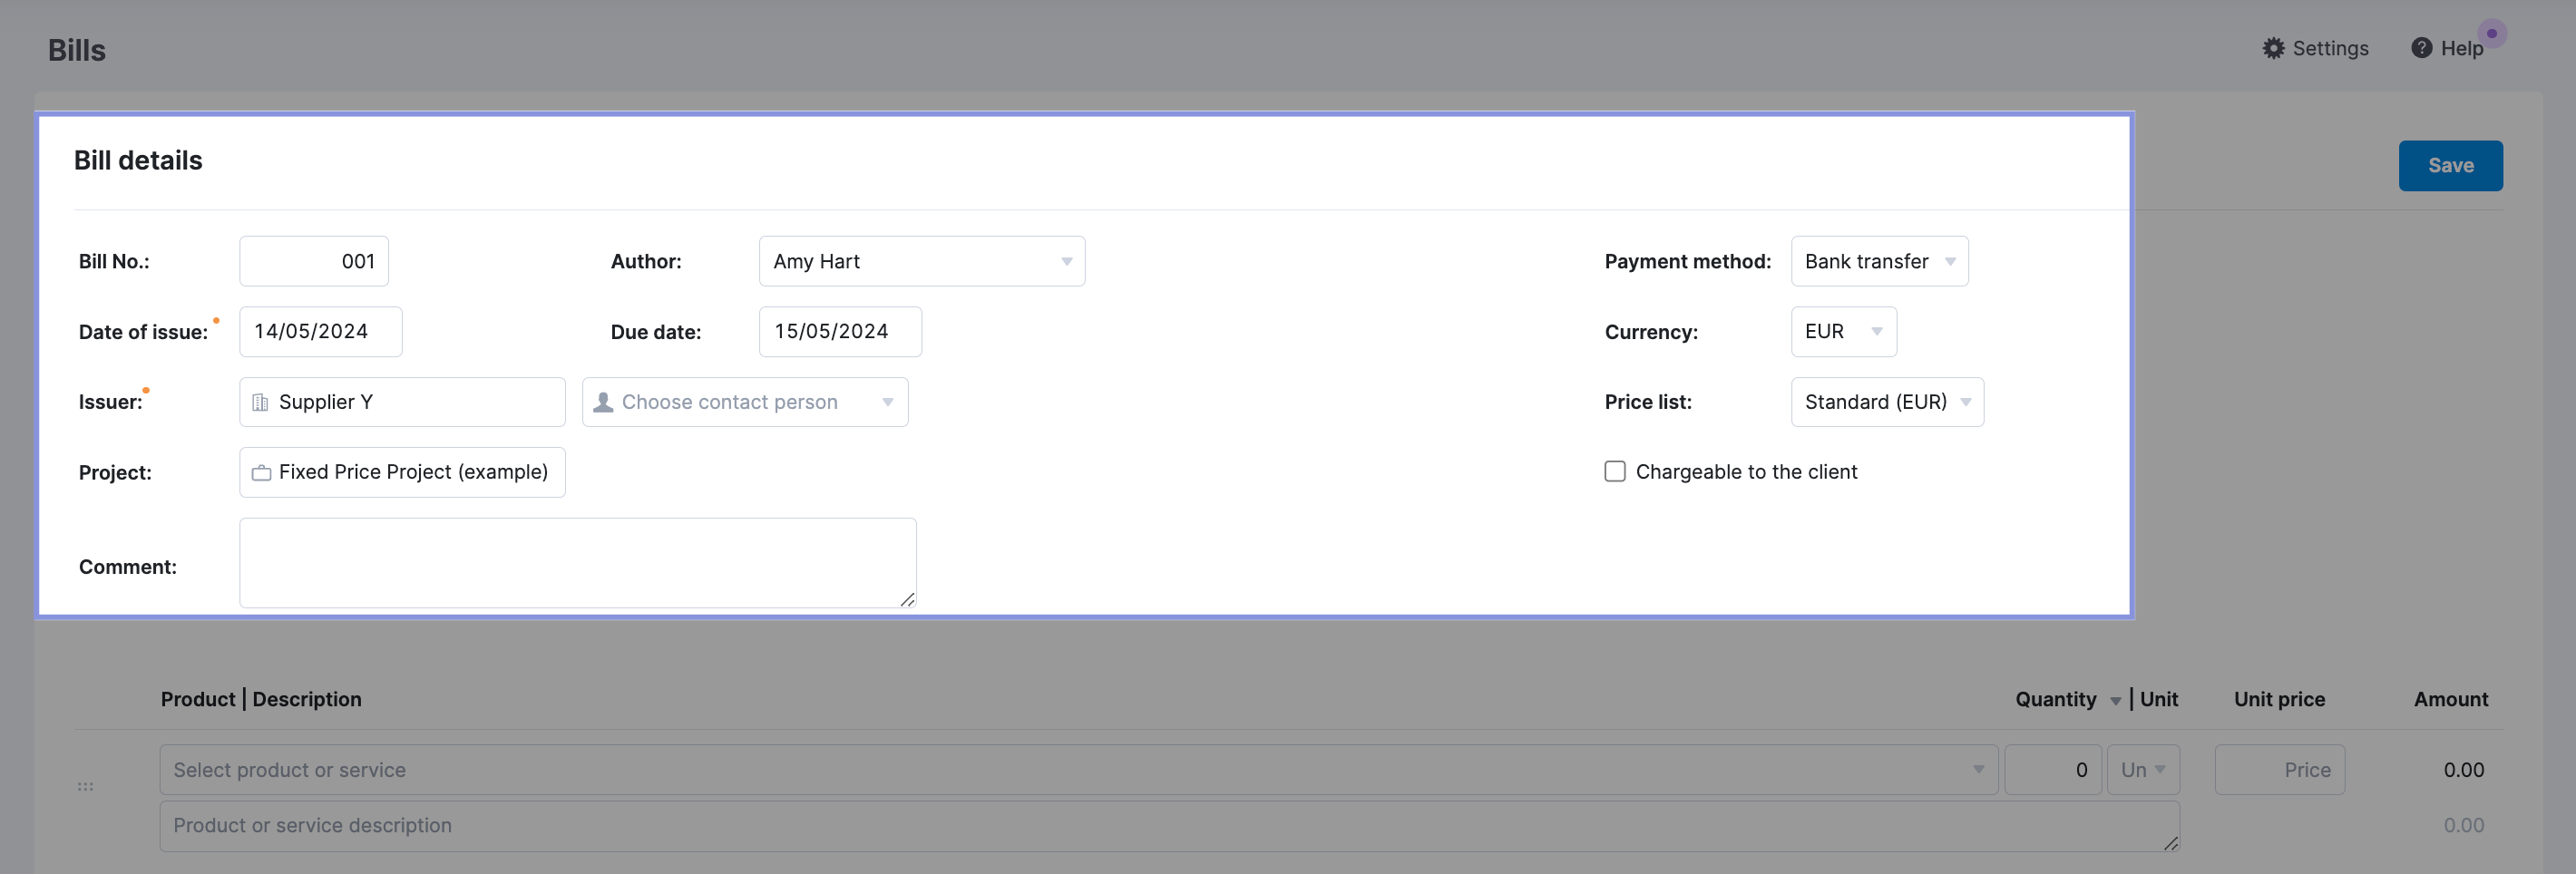
Then, click the “+” button to add new lines to the expense with the expense description and costs.
Further Reading: Managing Bills and Expenses in Scoro
3. Use your total revenue and bills and expenses to calculate your agency’s gross income and margin
Now that you’ve figured out your bills and expenses subtract them from your total revenue to get your agency’s gross income.
Say you brought in $13,000 in revenue the previous month, and your bills and expenses for that work totaled $2,500. Your agency’s gross income would be $10,500.
To find your gross margin based on your agency’s gross income, divide your gross income by your total revenue.
For instance, using the example above: ($10,500) / ($13,000) x 100 = 80% gross margin
Scoro automatically calculates your gross income under the “Gross Income” column in the “Summary” report.
This can also be seen at a project level through the “Project list” view under the “Project” module.
The “Project list” view gives an overview of all your projects and the metrics you find most useful.
To see these data points, select the following from the “Summar bar” drop-down:
- “Income (budget)”
- “Income (actual)”
- “External cost (budget)”
- “External cost (actual)”
- “Gross income (budget)”
- “Gross income (actual)”
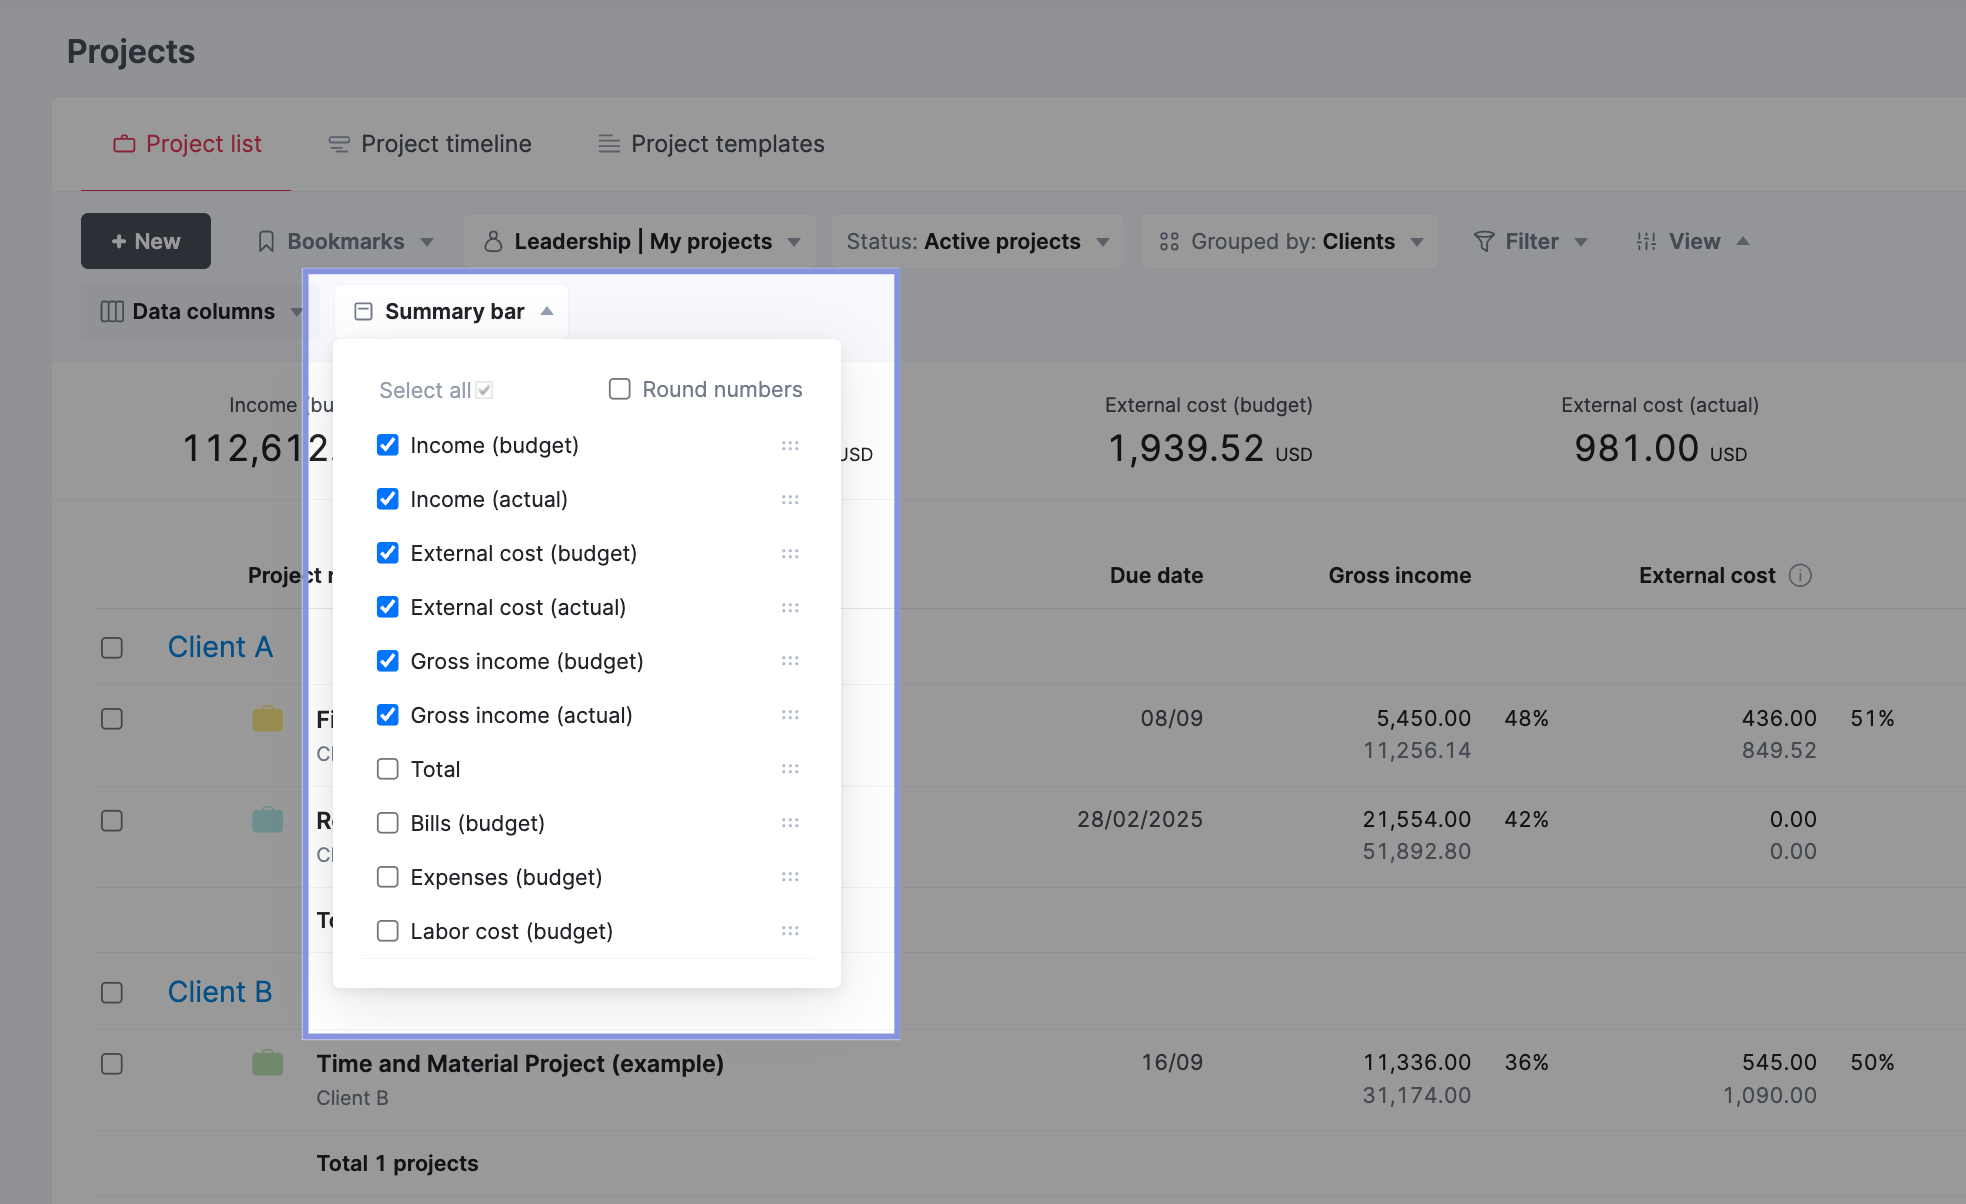
This will enable a high-level overview of those numbers for all active projects in a summary bar.
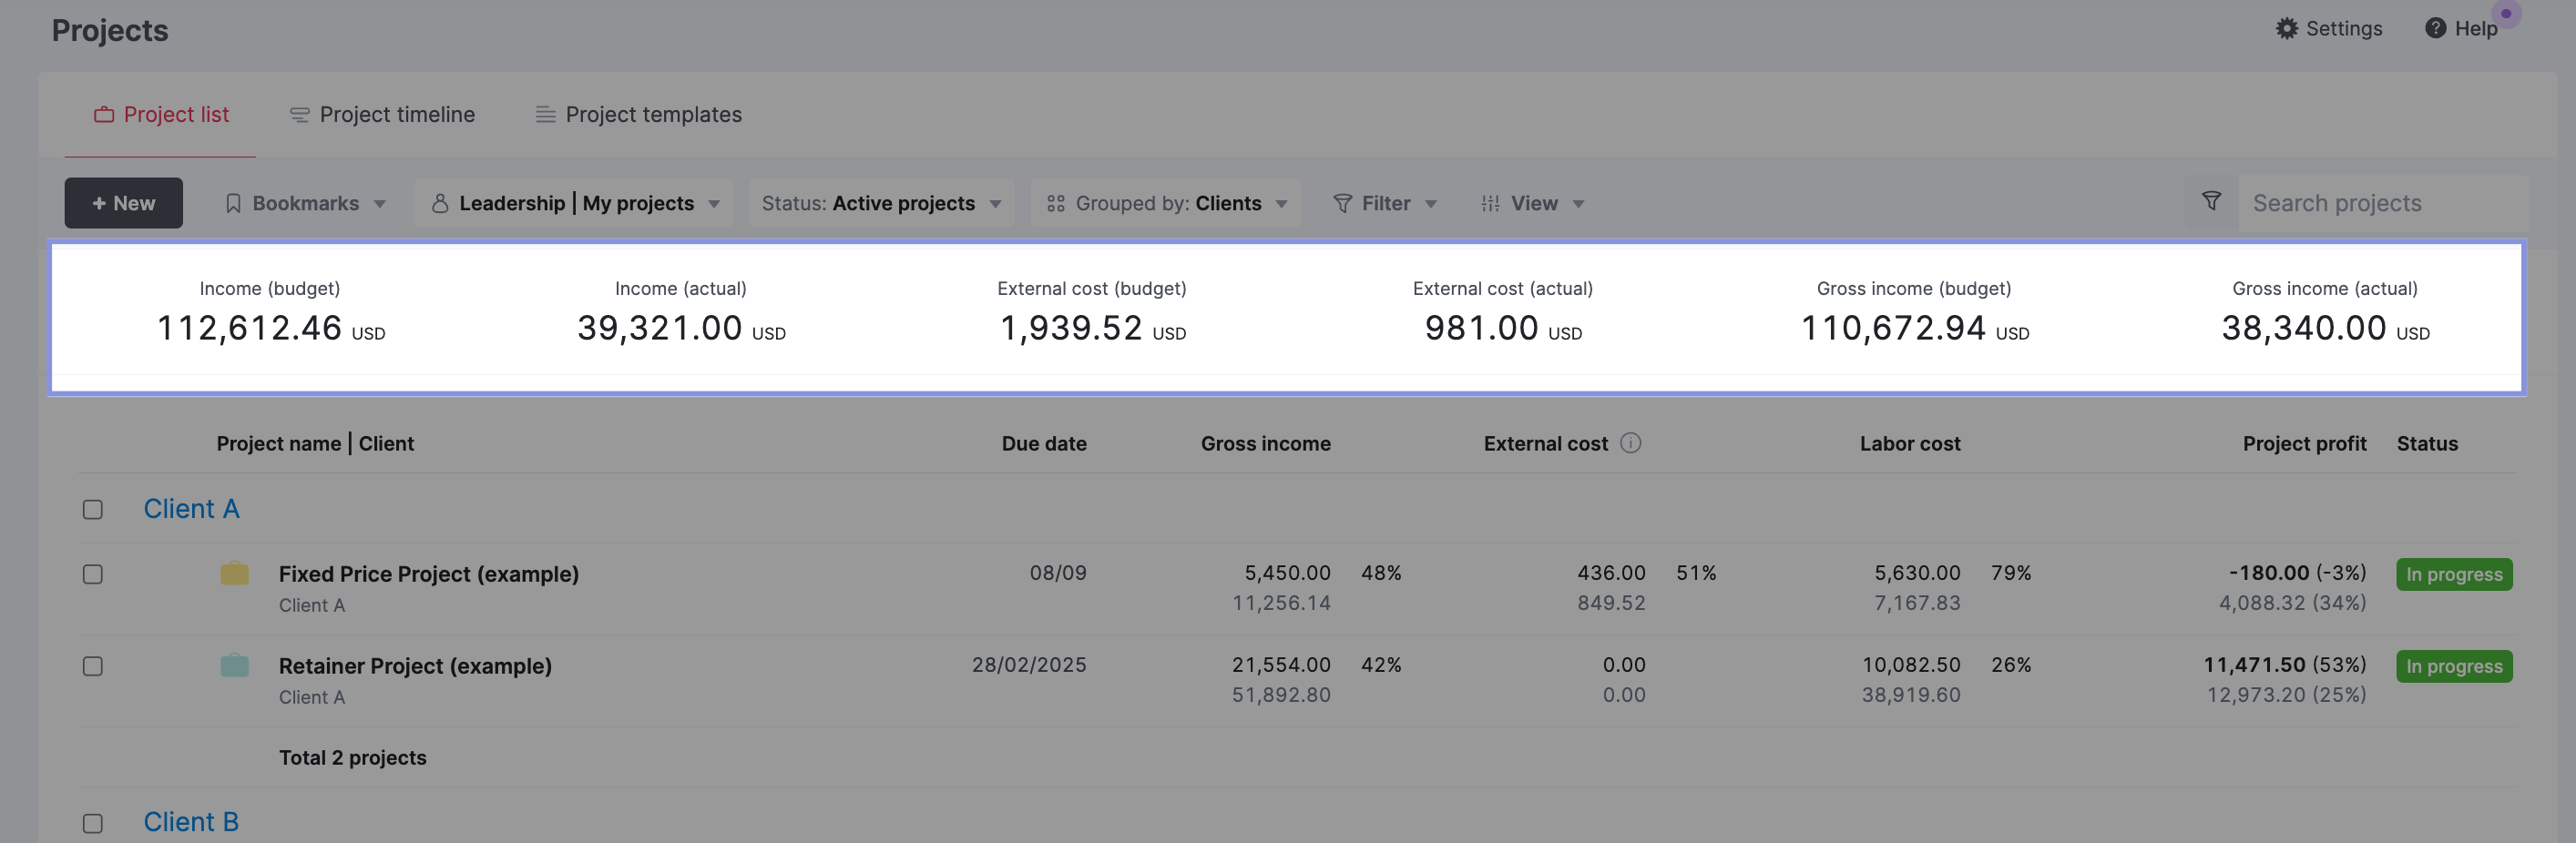
You can also see similar financial metrics on an individual project basis.
Select “Income,” “Gross income,” External cost” from the “Data columns” dropdown.

Which will then display this information for each active project.
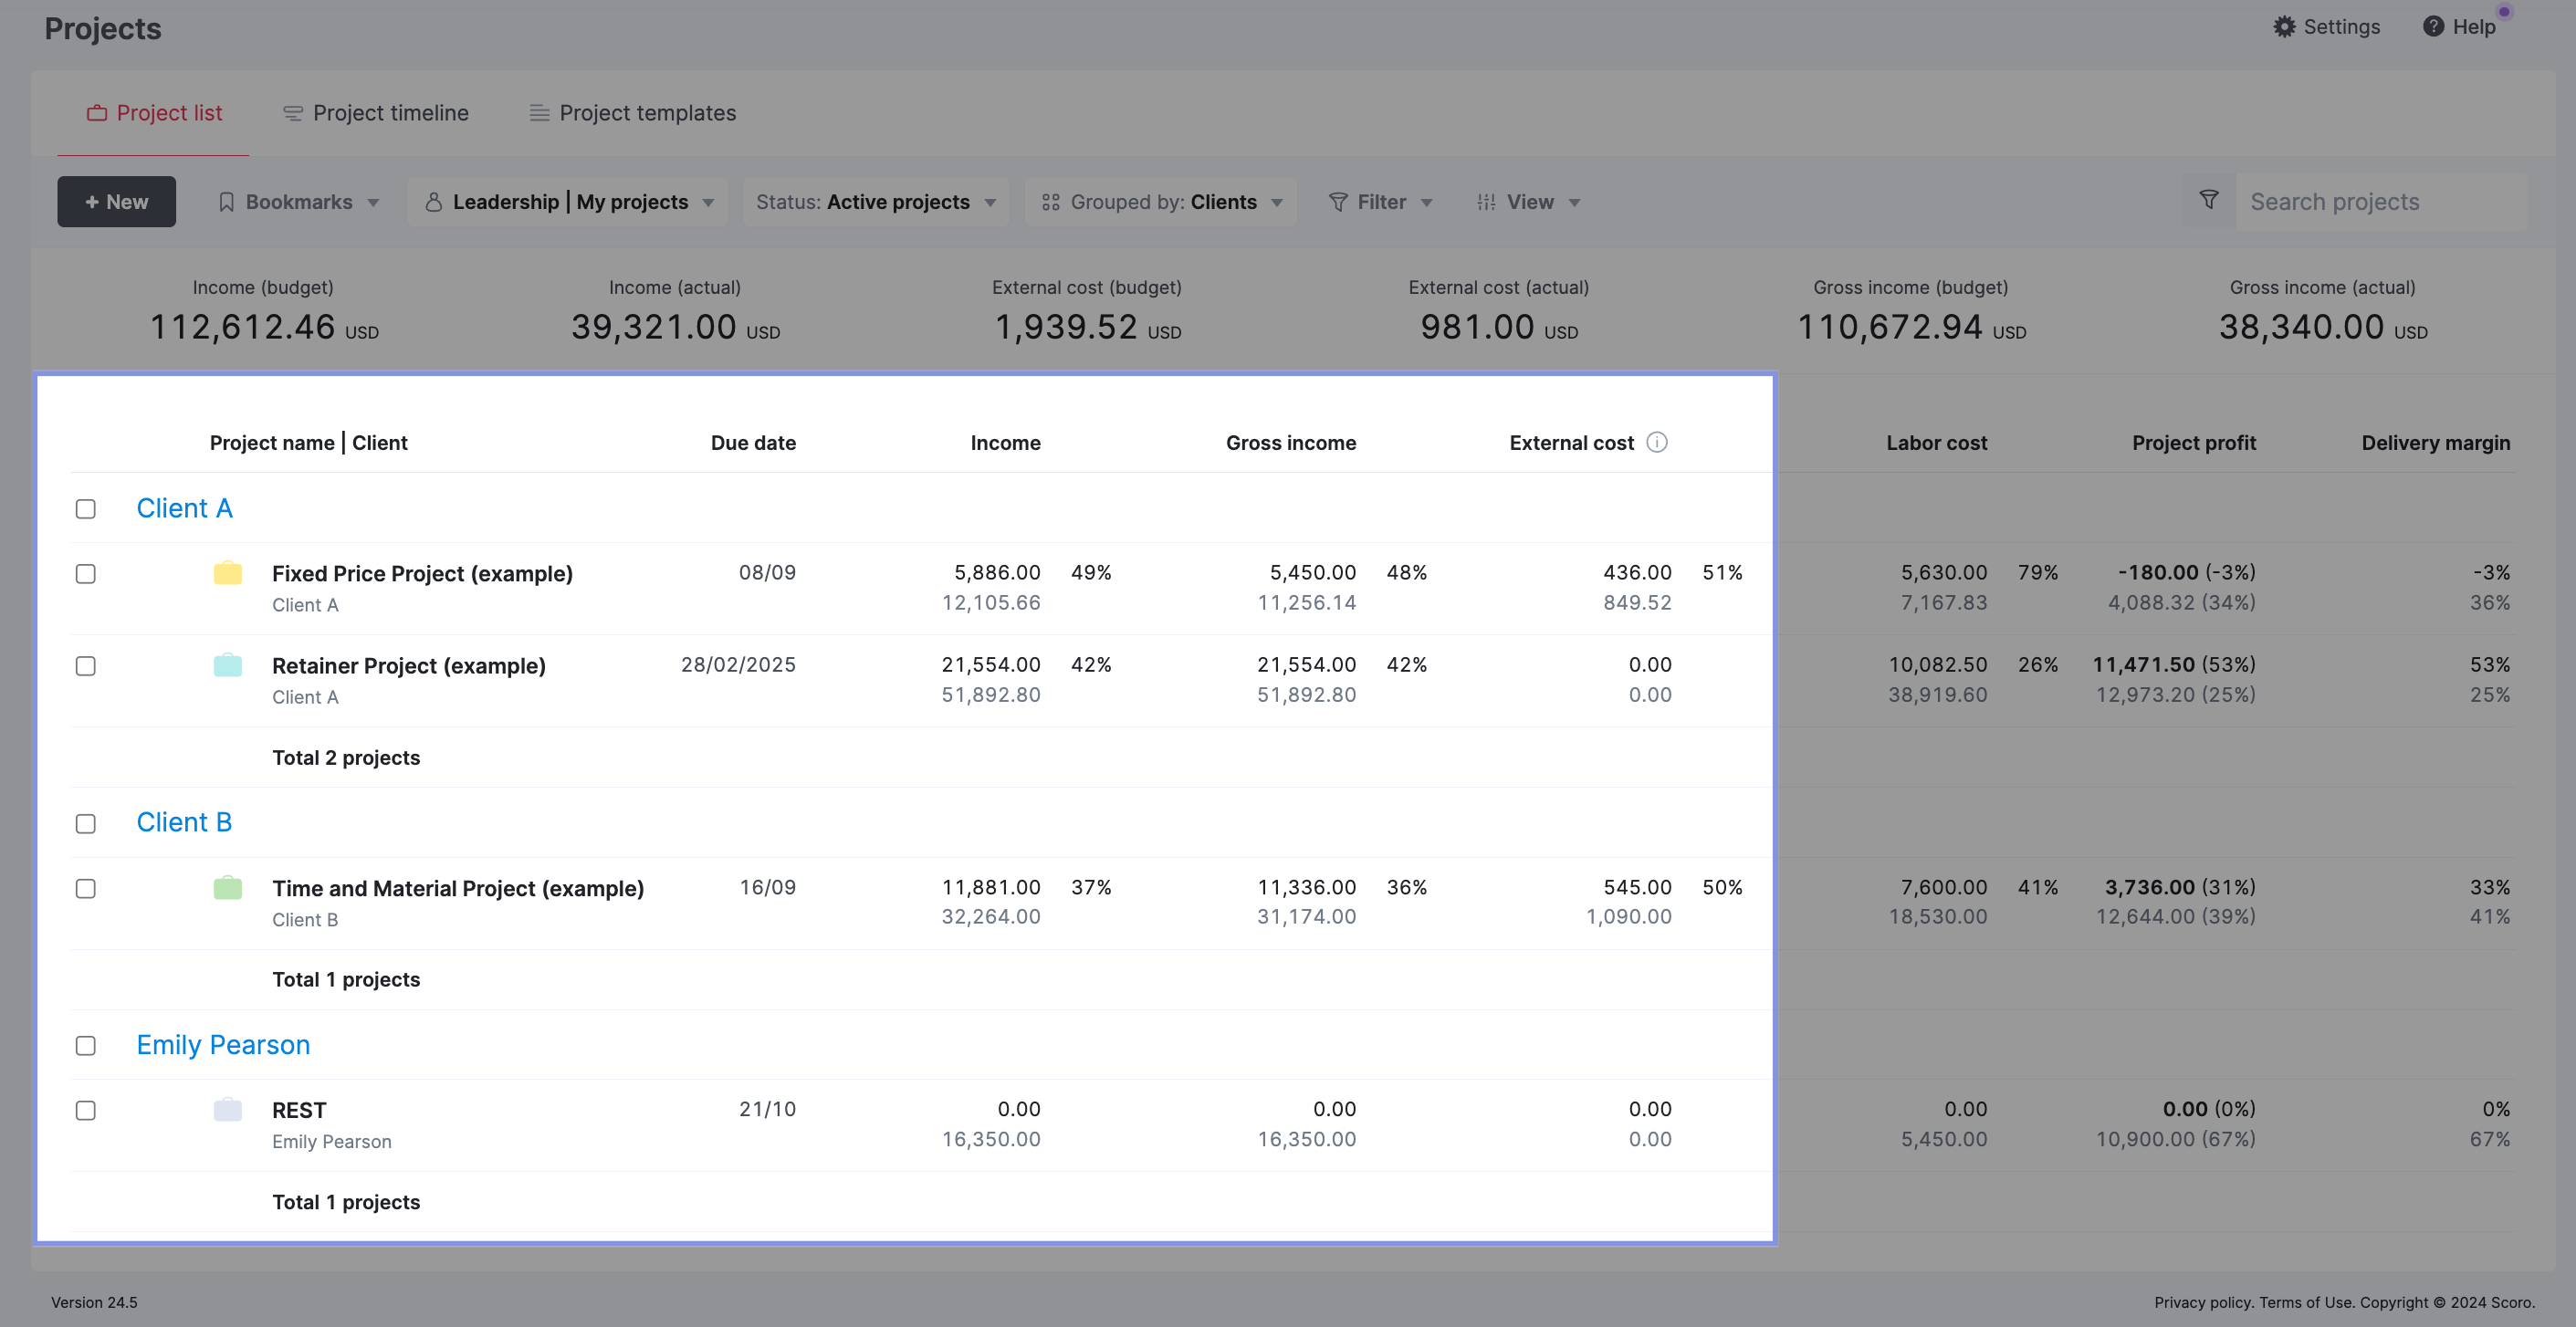
For each project, you can view the budgeted amounts displayed in black, alongside the actual realized amounts shown in grey, for all the key financial metrics.
Further Reading: Overview of Project Management in Scoro
4. Calculate your delivery costs
To calculate your agency’s delivery costs for a project, you’ll need to determine the labor costs for the team members involved. Labor costs make up the core internal expenses required to deliver client work.
Start by calculating the hourly labor rate for each employee or role. This accounts for their annual compensation and employment overhead costs to your agency.
Here’s the formula:
So, for example, let’s say you have an employee whose annual salary, benefits, and training cost your agency $105,040 annually.
Assuming a standard 2,080 working hours per year (40 hours per week × 52 weeks), the calculation would be:
$105,040 ÷ 2,080 = $50.50 per hour
You’ll need to do this for each employee working on the project.
Next, multiply an employee’s hours on the project by their hourly rate to calculate the total labor costs.
For example, let’s say you have a team of five that worked 300 hours combined at $50.5 per hour. Your labor costs for that project would be $9,000.
Finally, add those total labor costs to the bills and expenses from the previous step (in this case, $2,500) to get your final delivery cost. Here, it’d be $9,000 + $2,500 = $11,500.
All of this generally requires a lot of spreadsheets and manual math. However, in Scoro, labor and delivery costs are automatically calculated.
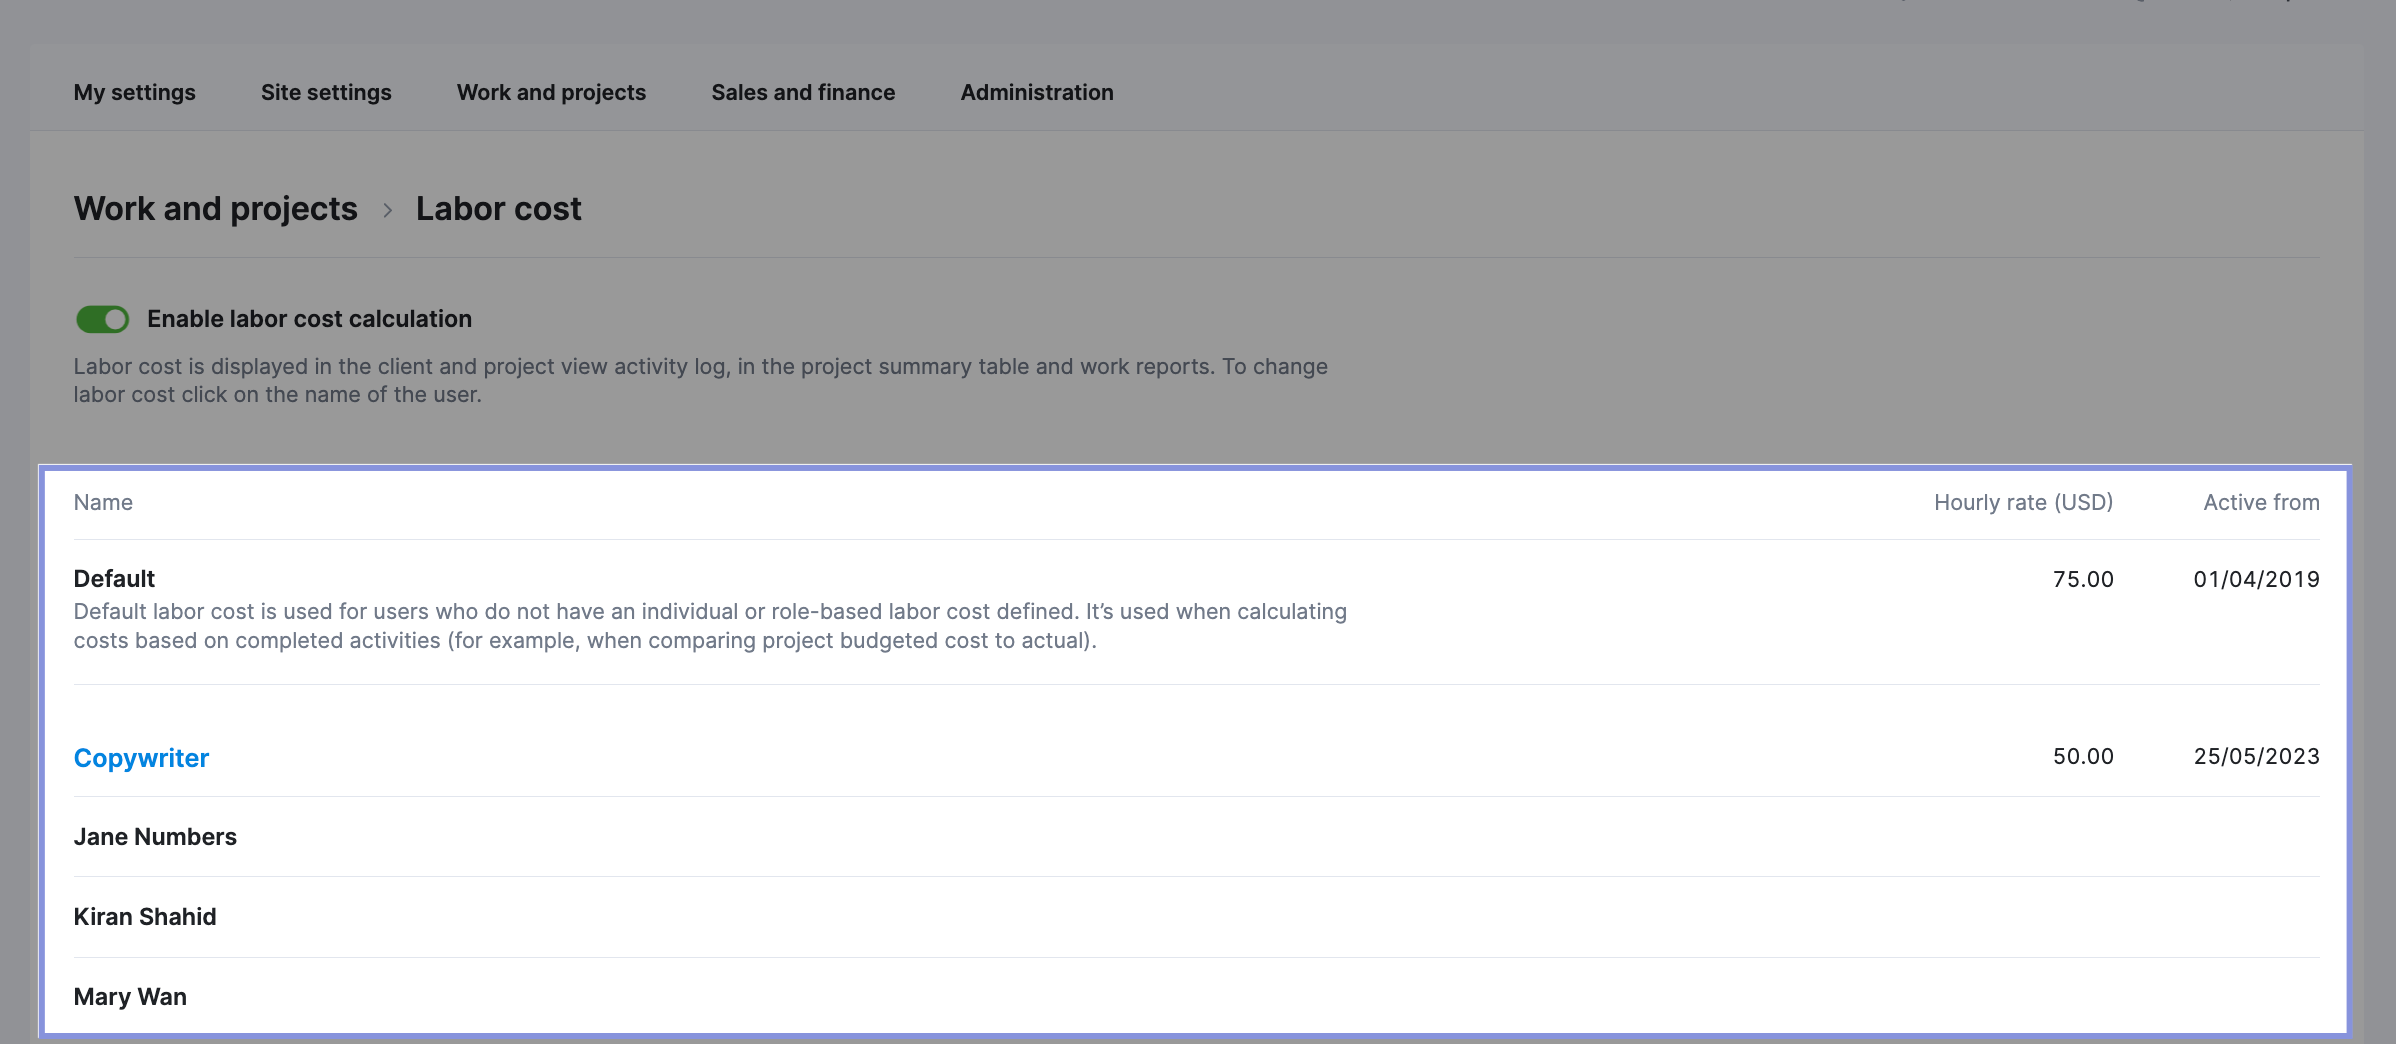
To set up labor cost tracking in Scoro, go to “Settings” > “Labor cost.”
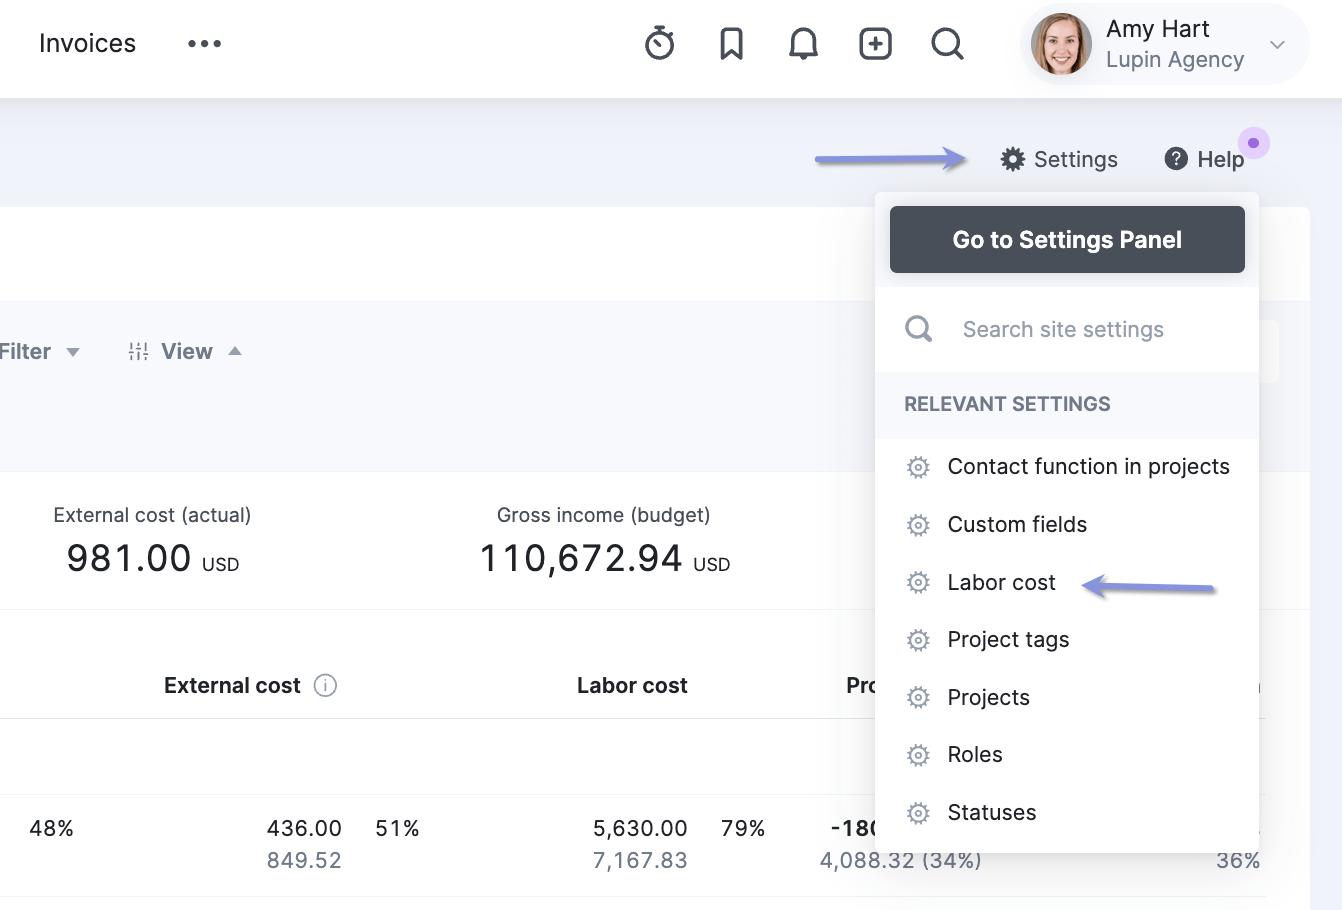
You can set a default labor cost for your entire team or per role. If a team member’s individual labor cost differs from the default, you can click on their name to adjust it.
Then, have team members track their time against their assigned project tasks.
Scoro then automatically calculates labor costs based on tracked time and sets labor rates to give you automatic, real-time data on your labor costs for each project.
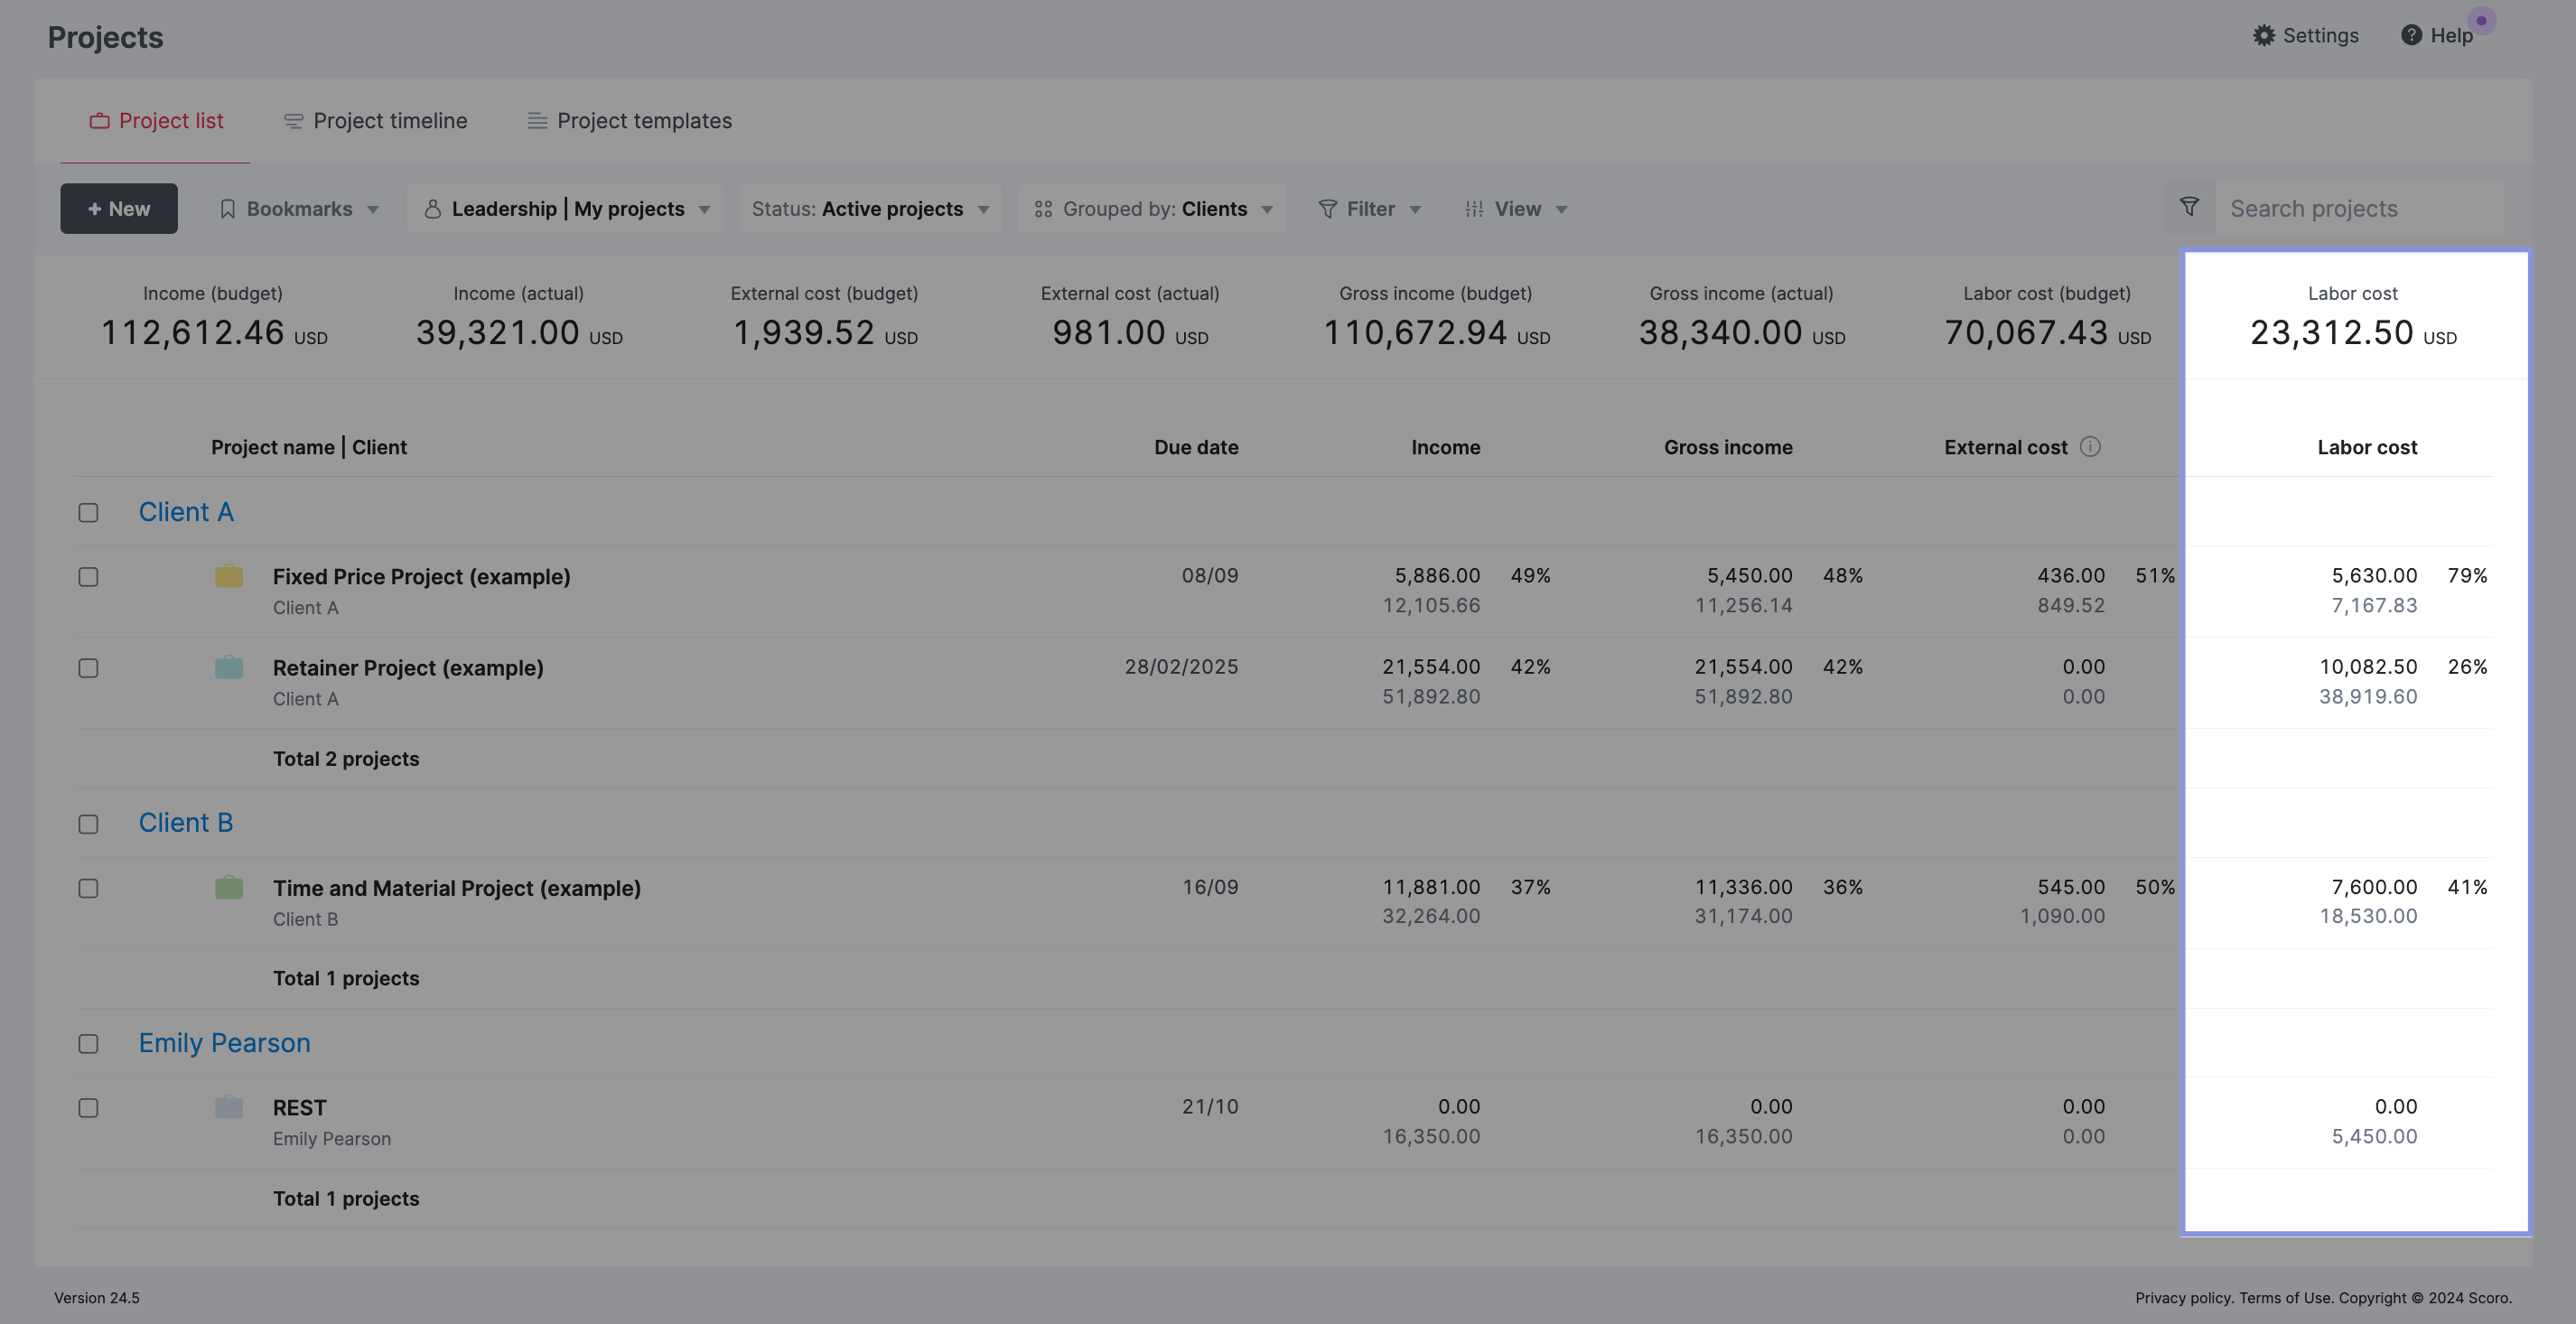
From the “Project list” view, add the “Labor cost” filter from the “Summary bar” and “Data columns” dropdown menus.
Now, you’ll see all your projects’ total labor costs, gross income budgets, and actuals. This data is calculated based on your custom labor rates for each team member and their tracked time.
Further Reading: Setting Up Labor Costs In Scoro
5. Calculate your delivery profit margin
Now, subtract the delivery costs from your gross income to get your delivery profit.
For example, if your last project had $11,500 in delivery costs out of $20,000 in gross income, your delivery profit is $8,500.
To calculate your delivery profit margin, use the following formula:
Delivery Profit Margin = (Delivery Profit / Gross Income) x 100
Using the numbers from our example:
Delivery Profit Margin = ($8,500 / $20,000) x 100 = 42.5%
This means that 42.5% of your gross income for this project was profit, while the remaining 57.5% went towards delivery costs.
Scoro automatically calculates your delivery profit and margin.
Go to the “Project list” view.
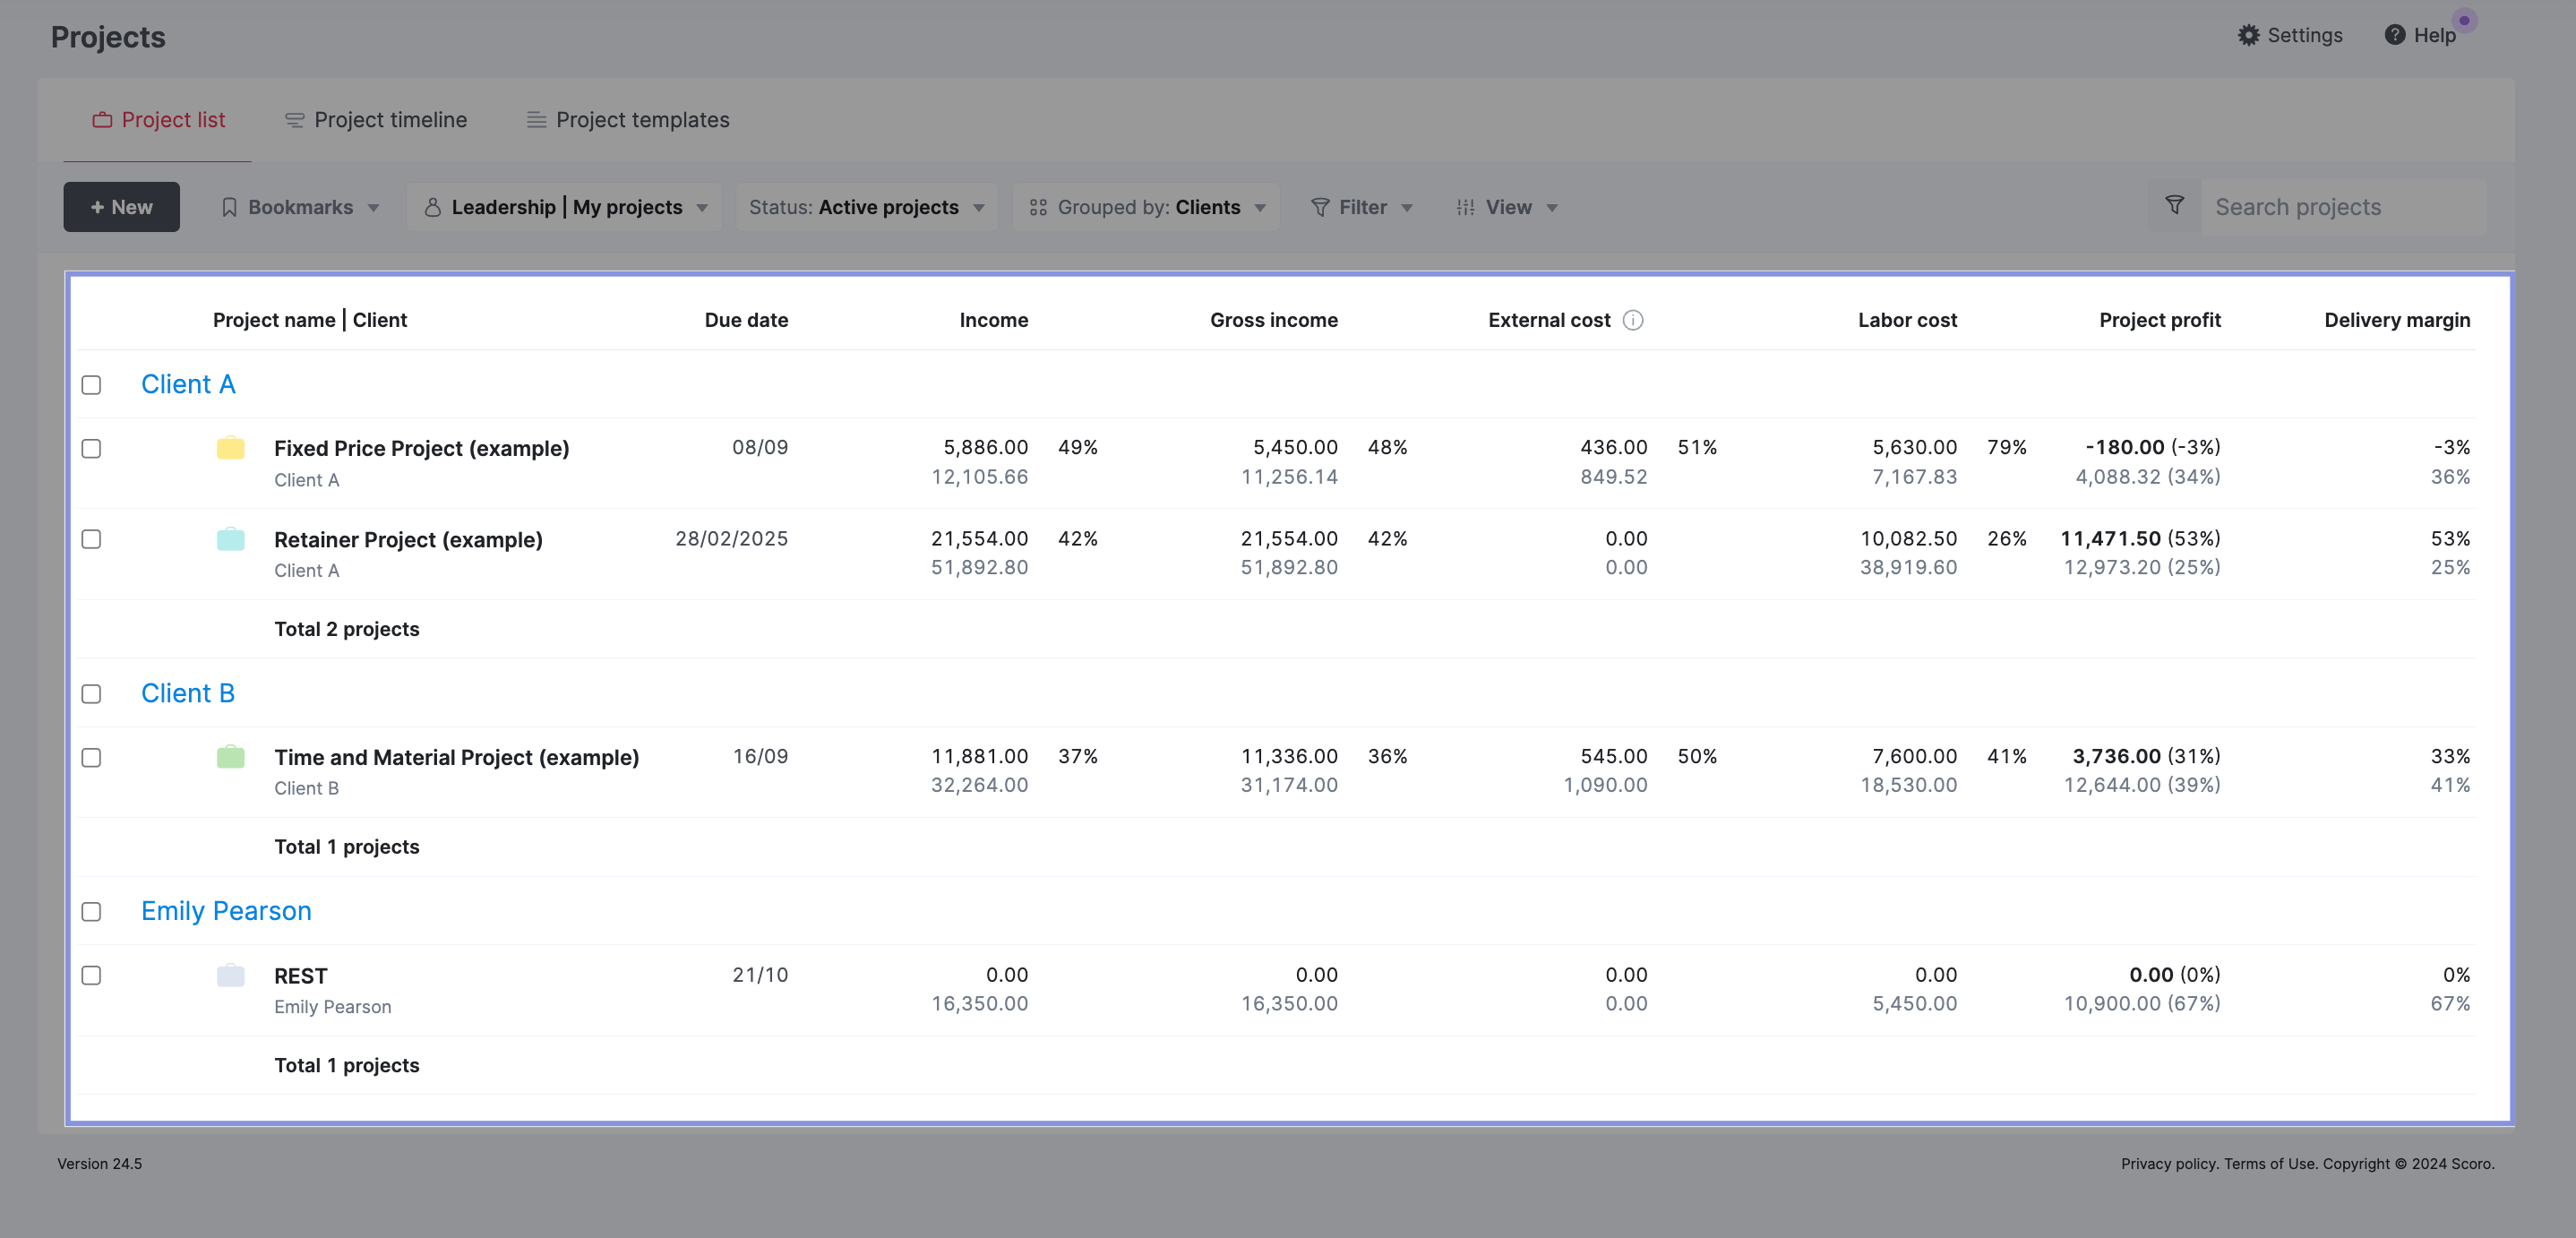
Click the “View” and “Data columns” and then check “Project profit” and “Delivery margin”.
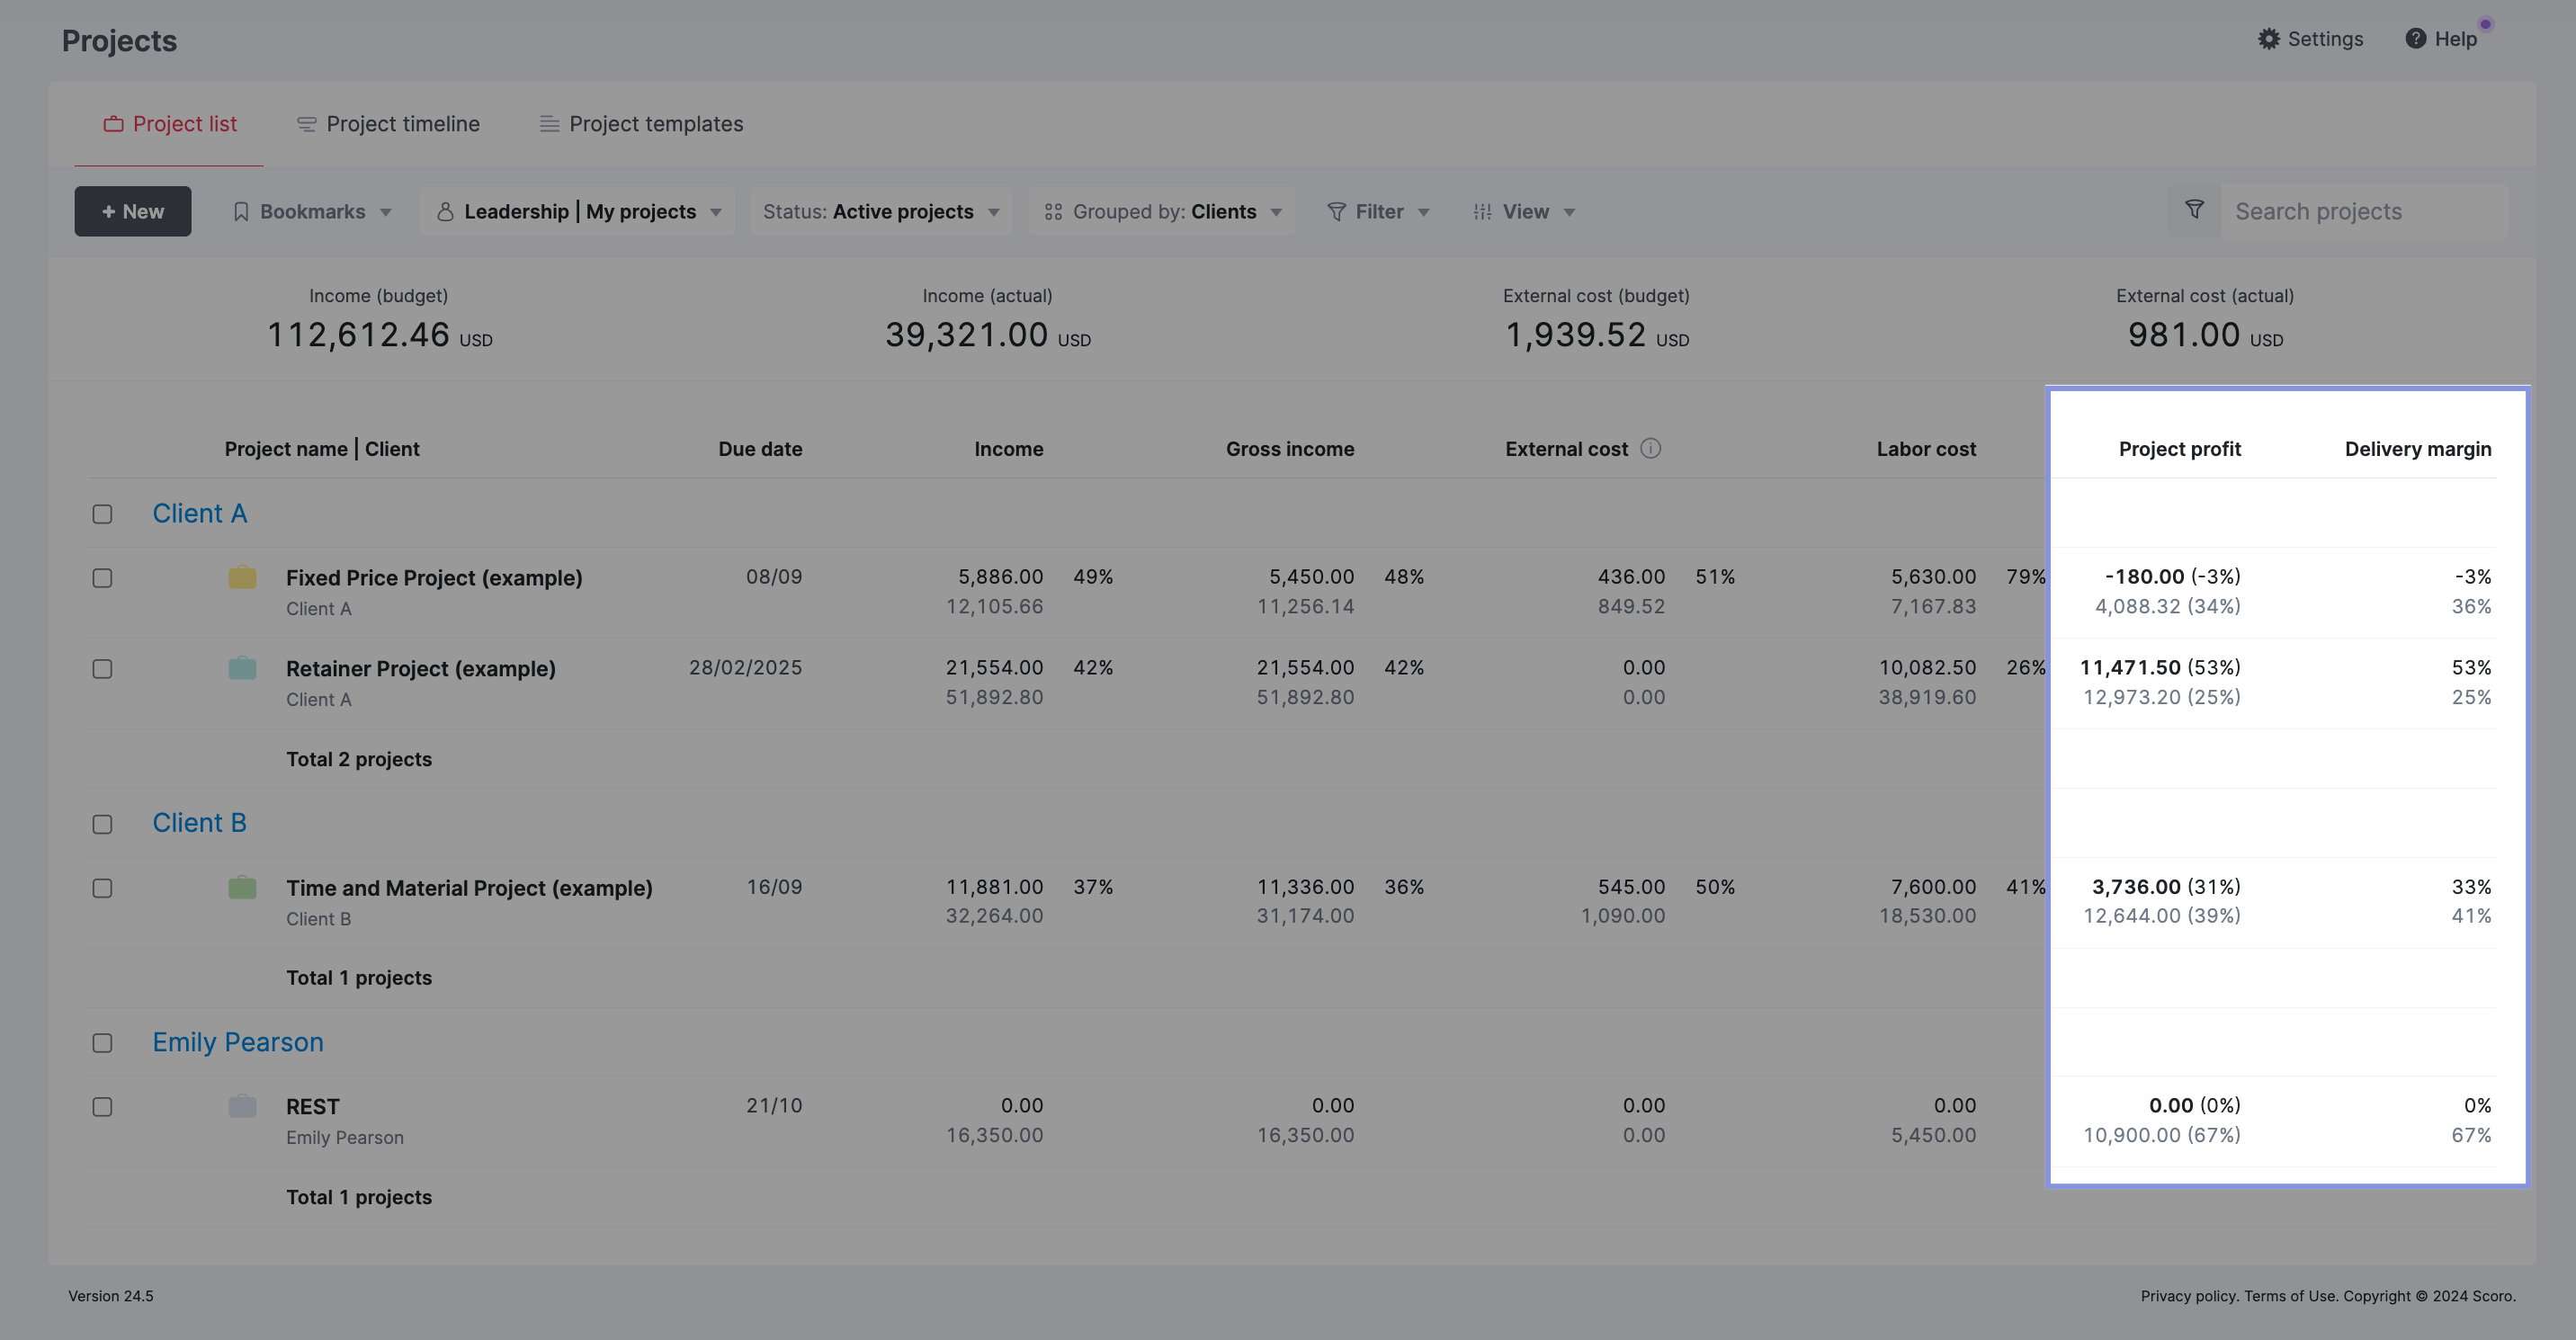
Now, you should be able to see the “Gross income,” “External cost,” “Labor cost,” “Project profit,” and “Delivery margin” for all your active projects.
However, you can also see the exact same data for your completed projects by selecting “Completed” from the “Status” drop-down menu.
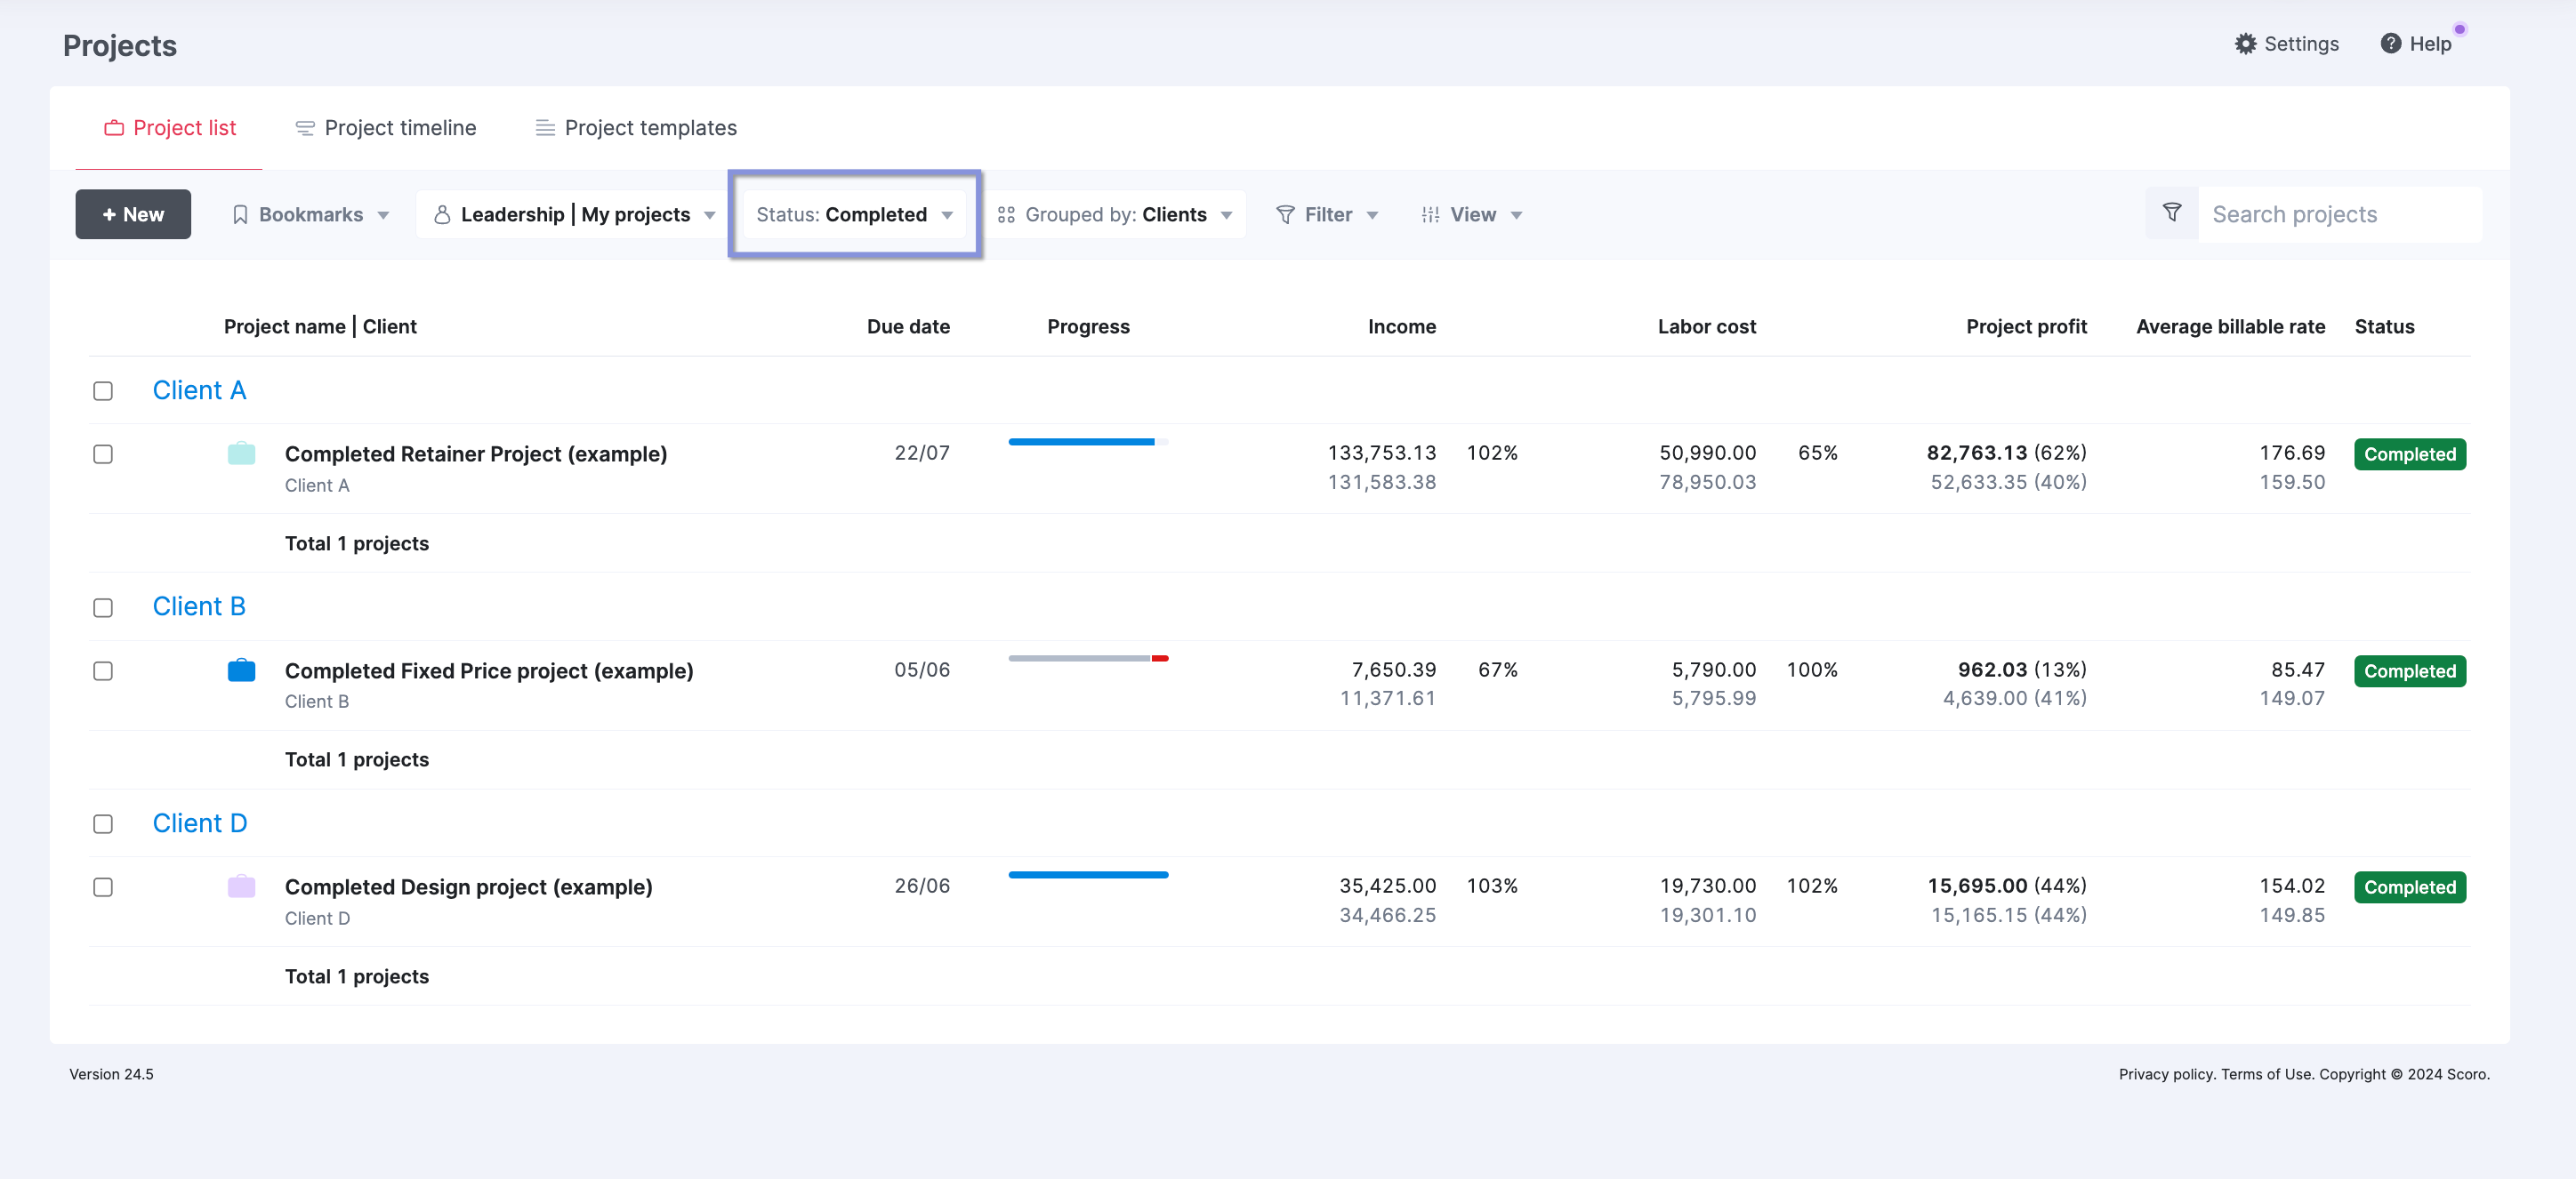
Seeing the data for completed projects allows you to analyze the profitability and efficiency of past work. This historical perspective can reveal trends, strengths, weaknesses, and learnings.
For example, certain service offerings or project types tend to have higher or lower delivery profit margins over time, which could influence which services to focus on.
6. Calculate your net profit margin
After accounting for all expenses, the final step is calculating your net profit margin, providing a comprehensive view of your agency’s true profitability.
To find your net profit margin, you must factor in overhead costs like office rent, utilities, admin salaries, software subscriptions, etc. These are the operating expenses not directly tied to delivering client work.
Scoro integrates with accounting software like Xero and Quickbooks, allowing you to easily find these numbers without contacting your Finance team.
Once you have your overhead figured out, subtract it from your delivery profit to get your net profit.
The formula to calculate your net profit is:
Let’s continue with the example from the previous steps, where the gross income was $20,000, and your delivery profit was $8,500.
The overhead costs were $2,000.
The net profit would be:
Net Profit = $8,500 – $2,000 = $6,500
Then, use the following formula to calculate your net profit margin:
Net Profit Margin = (Net Profit / Total Revenue) x 100
In this example:
Net Profit Margin = ($6,500 / $20,000) x 100 = 32.5%
The net profit margin is 32.5%.
With a net profit margin of 32.5% for this project, the next crucial question is – is this a good level of profitability, or could it be improved?
Calculating your margins is insightful, but the real value comes from comparing them against industry benchmarks to gauge whether they are strong or subpar.
Compare your numbers against agency benchmarks
We talked with Marcel Petitpas, an agency profitability expert, and here are the targets he recommends from his years of agency consulting.
| Metric | Benchmark range |
|---|---|
| Gross margin | 50% or higher |
| Delivery margin | 55% – 75% |
| Net profit margin | 15% – 35% |
| Pass-through expenses | 50% |
| Overhead costs | 20% – 30% |
Note: These benchmarks can vary depending on the specific industry, but they serve as general guidelines for agencies to assess their financial performance.
Now, let’s run through each one in a little more detail.
Agency gross margin: 50% or higher
Overall, a 50% or higher gross margin gives you room to invest in your business and grow while remaining profitable.
For example, after factoring in direct project costs, a 50% gross margin means that half of your revenue is available to cover your agency’s operating expenses, such as rent, utilities, salaries, marketing, and other overhead costs. This ensures your agency can sustain itself without relying solely on project revenue.
Anything lower than a 50% gross margin will likely create financial problems for your company.
A low gross margin indicates spending too much time delivering each project. You may need to reduce reliance on contractors, increase selling prices, or re-scope projects to improve profitability.
Delivery margin: 55-75%
Overall, a 55% delivery margin shows efficient pricing and cost management. And helps ensure your agency stays profitable.
When calculating delivery margins on an individual project or per-client level, you want to aim for the higher end of that range, closer to 70 – 75%.
When setting targets for individual projects or clients, aiming for a higher delivery margin of 70-75% helps account for potential issues that could erode profitability, such as:
- Overservicing: Sometimes, agencies spend more time and resources on a project than initially anticipated to meet client expectations or address unforeseen challenges.
- Gaps in utilization: Not all employees will be fully utilized at all times, impacting overall profitability.
- Scope creep: When project scope expands without corresponding increases in budget or timeline, it can eat into profit margins.
By targeting a 70-75% delivery margin at the project level, you create a buffer to absorb these potential issues while maintaining a healthy overall agency delivery margin of 55-60%.
If your delivery margins fall significantly below 55%, it often signals operational inefficiencies like:
- Poor resource utilization and staffing optimization
- An inability to accurately scope and price projects
- Difficulties controlling labor costs and billable hours
- Challenges preventing scope creep and client overservicing.
Net profit margin: 15 – 35%
A 25% net profit margin gives you a solid profitability margin, keeping your business solidly in the black while also allowing for reasonable expenses, overhead, and delivery costs.
15 – 35% is the standard industry range, so if your numbers fall within that range, you can feel confident that you’re managing profitability and costs well.
If your net profit margin falls below 15%, it may indicate that your agency is struggling to manage its overall costs effectively.
This could be due to several factors, such as:
- High overhead expenses: If your overhead costs, such as rent, utilities, or administrative salaries, are disproportionately high compared to your revenue, they can reduce your net profit margin.
- Inadequate pricing: If your pricing strategy does not account for all of your costs, including overhead expenses, you may be undercharging for your services, which can lead to a lower net profit margin.
- Inefficient resource allocation: If your agency does not efficiently allocate its resources (e.g., staff, equipment, or technology) across all business areas, it can lead to increased costs and reduced profitability.
Pass-through costs: Under 50%
Keeping your pass-through costs below 50% allows you to maintain 50% of your project margin for operating costs and profit.
If your pass-through costs start creeping beyond 50%, it will be much harder to keep your delivery and net profit margins at healthy levels.
High pass-through costs often suggest that your project wasn’t scoped accurately. When estimating your project costs, factor all pass-through costs into the budget. This ensures your profits won’t take an unexpected hit when the project is complete.
Overhead costs: Around 20-30% of your gross income
Overhead costs are often neglected when considering profitability and benchmarks to aim for, but they’re a crucial metric, too. Overhead can be divided into three subcategories: administration, sales and marketing, and facilities.
The key is to keep total overhead within 20% to 30% of your agency’s gross income.
Maintaining overhead costs within this range ensures your agency has sufficient funds to cover operating expenses while leaving a healthy profit margin of 20% to 30%.
If your overhead costs start affecting your profit margins, you’ll need to reduce your operating costs.
This can involve:
- Downsizing or reducing your office space: Consider relocating to a smaller, more cost-effective office or negotiating better lease terms.
- Managing or utilizing your team more efficiently: Optimize your team’s workload and productivity to avoid unnecessary hiring, and consider outsourcing non-core functions to specialized providers.
- Managing advertising and marketing more effectively: Evaluate the ROI of your marketing efforts and focus on the most cost-effective channels to reduce marketing expenses.
If your overhead costs start eating into your profit margins and you are unable to reduce your operating costs, you may face the following challenges:
- Decreased profitability: As overhead costs consume more revenue, your agency’s profitability will decline. This means that even if you maintain the same level of revenue, your take-home profit will be smaller, limiting your ability to invest in growth.
- Reduced competitiveness: If your agency operates with lower profit margins, it may be difficult to compete with other agencies with better control over their overhead costs. This can lead to lost business opportunities or pressure to lower your prices, further impacting your profitability.
- Limited growth potential: High overhead costs can hinder your agency’s ability to scale and grow. If a significant portion of your revenue is consumed by operating expenses, you may lack the financial resources to hire additional staff, expand your service offerings, or pursue new market opportunities.
- Increased financial risk: If your agency consistently operates with low-profit margins due to high overhead costs, it may be more vulnerable to financial instability. Any unexpected downturns in business, such as the loss of a major client or an economic recession, can quickly put your agency at risk of financial distress or even failure.
To mitigate these risks, it’s essential to continuously monitor your overhead costs and take proactive steps to keep them under control.
Regularly review and renegotiate vendor contracts, optimize your office space and lease terms, implement technology solutions to streamline operations, and consider outsourcing non-core functions to specialized providers.
Remember, actively managing your overhead costs is crucial for maintaining a healthy profit margin, staying competitive, and ensuring your agency’s long-term financial stability.
Keeping overhead expenses within the recommended 20% to 30% range of your gross income can set your agency up for success and growth.
Keep track of agency margins with Scoro
Tracking your agency margins is a good first step to strengthening project profitability. But it’s just one piece of a much larger puzzle.
You need to be able to monitor and track KPIs beyond the margins.
For example, monitoring average project timelines, resource utilization rates, team productivity, billable utilization, and more can give you deeper insight into why and how to address low margins.
With Scoro, you can track all the data you need to support smarter business decisions. Our customizable dashboards help you scale from a beginner to a data master. Understand what’s happening behind the margins and quickly find ways to keep projects profitable.