The Gantt chart has become one of the most widely used project management tools today. Incredibly versatile and easy-to-use, it can be used throughout the whole project for planning, time management, task management, scope management and much more besides. In this guide, we explain why the Gantt chart is so useful, as well as exploring its origins, features and benefits.
What is a Gantt chart?
Simply put, a modern Gantt chart is a type of horizontal bar chart which illustrates a project schedule. First invented for manufacturing businesses in the 1890s, modern Gantt charts are more often used by project managers to visualize complex schedules.
The project is divided into tasks on the vertical axis, while time is shown in intervals on the horizontal axis. Each task is represented by a horizontal bar, often color-coded, while the length of each bar shows the task’s expected duration. In this way, the chart shows the start and finish times of the whole project, as well as those of its component tasks.
History of the Gantt Chart
Henry Gantt’s bar chart has been a mainstay of project management for many decades. However, what we now know as the Gantt chart was actually devised in 1896 by Polish engineer, Karol Adamiecki, who called it a “harmonogram”. And although it led to 100-400% increases in factory output at the time, Adamiecki only published his work in Polish and Russian, which meant the Western world remained largely unaware of his invention for many years.
Henry Gantt, meanwhile, was a prominent American mechanical engineer who made major advancements in the field of production engineering during the 1910s. His ideas included ways to organize the layout of the workspace, and the ‘task and bonus’ system for employees. These developments were used to great effect in the US war effort during WWI.
Gantt devised sophisticated charts for recording data and performing diagnostics to improve efficiency, but he always named them after their purpose. What we now call the “Gantt chart” was actually dubbed as such by Wallace Clark in his 1923 book, The Gantt Chart, a Working Tool of Management. Henry Gantt originally called it the “Load Chart”: for each type of item to be manufactured, it showed the planned quantity of the batch and its allocated time slot, plus the actual, cumulative, and daily totals – all in one line.
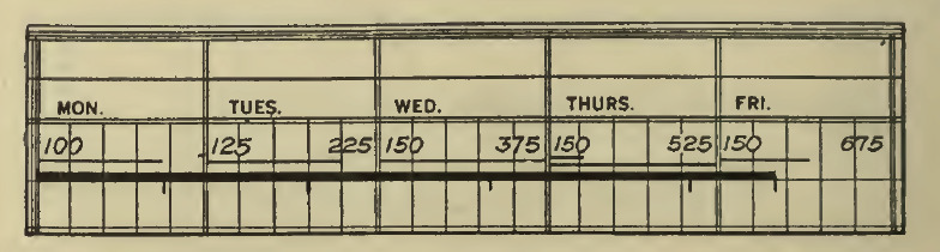
Henry Gantt’s original “Load Chart”
Most of Gantt’s factory techniques declined in the 1950s and 1960s when the complexities of large-scale manufacturing made them difficult to implement. However, one aspect of his systematic thinking definitely lives on – an adapted form of the Gantt chart, now a vital tool used in modern project planning.
The evolution of the Gantt chart
Before the advent of computers, Gantt charts were drawn by hand, meaning that every time a change was needed, the whole chart had to be laboriously redrawn. Since the 1980s, however, project management software has eliminated this delay and enabled the creation of more elaborate Gantt Charts.
In the 1990s, the advent of computer networking and the internet moved Gantt charts from desktop applications to web-based project management software, which brought about a new level of project collaboration.
In modern Gantt chart software, data can be automatically updated. For example, a vertical line can be used to indicate the current day. The ‘Today’ line can be visually compared with features such as progress bars, showing at a glance whether tasks are behind or ahead of schedule. Project managers can add more detailed information to elements and other components, which users can reveal as needed. This can even include discussion threads so that team members can keep all their project information in a single dashboard.
What is a Gantt chart used for?
Gantt charts have become much more generalized since their origin on the factory floor, and modern versions are now used for managing every phase of the project.
In the planning phase, the Gantt chart helps project managers assess many important aspects of a project:
- how long it should take
- the order of tasks
- the personnel who need to be involved
- the resources required
During the execution phase of a project, the Gantt chart helps to monitor progress. You can see which tasks are due to be achieved by a certain date and which tasks have not been. So if the project is falling behind schedule, you can immediately see what’s specifically required to bring it back on track.
In the analysis and reflection phase, by comparing the original plan and the final chart side-by-side, you can see which activities of a project were completed on time, or quicker or slower than others, and why. This, in turn, will inform quicker and more accurate planning for future projects.
Business Management Software (BMS) can connect Gantt charts to other software components, supercharging them for even more sophisticated uses. This may include triggering email notifications when a task is assigned, or a milestone is reached, or integration with the team’s calendar software so they can schedule their time appropriately.
What should be included in a Gantt chart?
Tasks within the Gantt chart are classified as either ‘summary elements’ or ‘terminal elements’.
- A summary element is a larger task within the project. If we take ‘manufacturing a car’ as a project, a summary element could be painting the car.
- Terminal elements are the smaller tasks involved in painting a car, such as applying the primer, the first coat of paint, the second coat, the wax, and the buff.
The Gantt chart shows the start and end times of both the summary and terminal elements. Elements are usually color-coded, so all terminal elements within a summary element share the same color.
The structuring of a project into its summary and terminal elements constitutes what’s generally known in project management terms as a work breakdown structure (WBS); a deliverable-oriented division of a project into its smaller components.
Besides the main elements of the Gantt chart, there are various optional features that can benefit teams. Below, we’ve listed features that we think are critical and universally beneficial for all businesses:
Progress indicator. Element bars can be shaded or filled according to their degree of completion.
Dependencies (or links). These are the relationships between elements and typically shown as ‘elbow arrows’ connecting the corresponding ends of two tasks. There are four types of dependencies:
- Finish-to-Start – The most common dependency in project management and means that the predecessor task must be completed before another task can begin.
- Start-to-Start – One task cannot start before the predecessor task starts. But once the predecessor task starts, the two tasks can still run independently.
- Finish-to-Finish – One task cannot end before the predecessor task ends. That said, those two tasks don’t have to end simultaneously.
- Start-to-Finish – Although rarely used, in some instances the predecessor task must start before the other one can finish.
Milestones (usually represented by a diamond ◇, which is filled when the milestone is achieved ◈). These are instantaneous elements which mark important points in a project, such as the completion of a design, or the finalization of a set of documents. Milestones provide an easy way to see important dates at a glance.
Assignments. An element can be assigned to a specific person, team, or department. This is usually shown as a label to the right of the element’s bar.
The benefits of a Gantt chart
Using a Gantt chart comes with many benefits and will help you:
- Finish your projects on time. A Gantt chart allows you to map out your project and find the critical path (the longest “distance” between the beginning and end of a project). Planning the component tasks and splitting these into smaller chunks makes it easier to meet deadlines.
- Easily visualize your entire project. The chart shows the whole timeline from start to finish. There’s something to be said for being simple and easy to interpret. For example, a critical path network diagram shows more detail than a Gantt chart, but it requires training to interpret. The clarity of the Gantt chart makes it more accessible to stakeholders, and also less likely that you’ll miss something important.
- Adjust course when needed. The ability to track progress means you can see how tasks are progressing in real time. Dependencies make it easy to see the interrelationships between tasks, even when they are moved around. The Gantt chart can also be amended as the project evolves, and this flexibility facilitates a quick reaction to unexpected changes in scope or timeline.
- Optimize for efficiency. You can look ahead to anticipate which resources will be needed and where to allocate them. This helps keep the project within budget. This way, managers can make the best use of team members, resources, and time. Additionally, the Gantt chart enables team members to work together to leverage each other’s deadlines and maximize efficiency.
- Keep your team connected. A shared web-based Gantt chart ensures team members are clear about their responsibilities, and everyone is kept up to date with the project, while managers can keep track of their progress.
- Maintain motivation. Hitting milestones and intermediate deadlines causes the brain to release dopamine, which makes you and your team feel good about your achievements. Having a record of progress upfront and visible to everyone means these little wins will maintain motivation throughout your project.
- Stay focused. Warren Buffet and Bill Gates both agreed that the single most important factor for their success was focus. Meanwhile, Thomas Carlyle, Scottish historian and philosopher, said, “The weakest living creature, by concentrating his powers on a single object, can accomplish something. The strongest, by dispensing his over many, may fail to accomplish anything.” Therefore, once your Gantt chart has been planned out, you can start working on tasks without the consternation of remembering every element and who’s assigned to it.
Limitations of a Gantt chart
Gantt charts can be very beneficial when used correctly, however, there are also some limitations the majority of modern Gantt charts face.
- Created in isolation. Gantt charts are often stand-alone tools separate from other important data (e.g., resource utilization). This means that for an accurate overview of project progress, you still need to use different tools.
- Not enough granularity. While Gantt charts are useful for high-level planning of projects, they don’t offer enough granular detail for proactive project execution.
- Difficult to track progress real-time. As Gantt charts won’t capture every detail of the project and leave data scattered between different places, it’s not ideal for tracking projects in real-time.
- Updating is very time-consuming. No project is static, and most projects deviate from the initial plan. Unfortunately, Gantt charts today aren’t flexible enough to accommodate such changes. This can quickly result in double-bookings and unmet deadlines.
The idea of a horizontal bar chart showing a timeline may seem simple, but the Gantt chart’s simplicity is what makes it so powerful. It’s because it can be so easily interpreted by the human brain – and because we can pack a great deal of sophistication into it – that the Gantt chart is so useful today. Used correctly, it can be a pivotal instrument to ensure your project’s success.