To improve productivity and project profitability without burning out your team, you need to master billable utilization.
Make the most of your team’s time and talent with our billable utilization guide, which covers how to calculate billable utilization, its biggest benefits, and how to improve it.
What is billable utilization?
Billable utilization is the percentage of time your team or individual employees spend on work that directly generates revenue and can be billed to clients.
For example, direct project tasks like writing, coding, and designing are considered billable hours. However, activities like company meetings, training, and business development fall under non-billable hours.
You calculate billable utilization using this formula:
Billable utilization = (Billable hours / Total Availability) × 100
For example, if your team member Molly has a 40-hour work week and spends 30 hours on billable tasks, the formula would be: (30 billable hours / 40 hours) x 100 = 75%
This shows that Molly spent most of her available time on revenue-generating tasks. And had 25% of time remaining for non-project work and breaks.
Billable utilization vs. resource utilization
Billable and resource utilization are essential metrics for understanding your team’s productivity, but they measure different things.
Billable utilization focuses on the percentage of time employees spend on client-facing tasks that directly generate revenue.
On the other hand, resource utilization encompasses all the work your employees do, both billable and non-billable.
This can include internal meetings, training, administrative tasks, and other activities that contribute to the company’s overall functioning, even if they don’t directly bring in revenue
| Billable utilization | Resource utilization | |
|---|---|---|
| Focus | Revenue generation and profitability | Productivity and workload management |
| Includes | Only billable work | Both billable and non-billable work |
| Importance | Crucial for financial health and client billing | Essential for resource planning and scheduling |
| Impact on profit | Direct impact: Higher billable utilization = more revenue | Indirect impact: Better resource utilization supports profitability |
Let’s say a software developer spends 30 hours a week coding for a client (billable) and 10 hours on internal tasks (non-billable).
- Billable Utilization: 75% (30 billable hours / 40 total hours)
- Resource Utilization: 100% (40 total hours / 40 total hours)
This shows that while the developer is fully utilized, only a portion of their time directly contributes to revenue.
But which utilization metric should you prioritize?
It depends on your goals:
- Profit-driven: Focus on billable utilization to identify revenue growth opportunities.
- Productivity-focused: Start with resource utilization to optimize workflows and prevent burnout.
Ideally, you should track both metrics for a complete picture of your team’s performance and financial success.
Why you need to track billable utilization rates
Even small adjustments to utilization rates can significantly improve your company’s profitability and revenue.
Here are a few reasons why:
To improve your resource allocation
Tracking billable utilization optimizes resource allocation by revealing who’s overloaded and who has capacity.
For example, if designer Sarah consistently bills 90% of her time while Mark bills only 60%, it’s a red flag.
Reassigning some of Sarah’s tasks to Mark helps prevent her burnout and ensures projects are staffed efficiently. If Sarah’s workload is sustainable despite high utilization, consider hiring to avoid future bottlenecks.
However, in Mark’s case, the root cause of his low billable utilization should be investigated. It could be inefficient processes, unclear priorities, a skills mismatch, or personal issues impacting his engagement and productivity.
To support your company’s sales pipeline
Use historical billable utilization rates to predict how much work team members can take on in the future.
If forecasts show low billable utilization, that’s a sign that you need more projects in the queue. If not, you’ll miss opportunities to bring in more revenue.
By proactively planning your capacity, you can help Sales target clients whose needs best match your team member’s unique skills and experience.
For example, after looking at the past three months of billable utilization rates for your developers, you determine that 70% is a realistic rate to target for the next quarter.
With this data, you can work with your sales team to target clients who require development services, ensuring that your team’s skills are fully leveraged.
On the other hand, if your designers are already forecasted at 75%—80% utilization rates for the next quarter, you can also show Sales this data to prevent onboarding more web design clients.
To improve your capacity planning
Billable utilization data can also help you set realistic timelines and scope new projects in alignment with your team’s actual capacity.
For example, if a client requests a tight deadline, review your team’s billable utilization data before committing. If key members are already heavily booked, you can propose a more realistic timeline upfront, avoiding the need for later renegotiations and potential client dissatisfaction.
This proactive approach avoids overpromising, resulting in stressed-out employees, rushed tasks, and client friction.
Instead of overloading your team, balance workloads to maintain a buffer for unforeseen events like sick days or complex tasks.
Billable utilization benchmarks
You need to know which billable utilization rates to target to determine whether you’re over or underbooking team members.
In general, professional services billable utilization benchmarks vary based on roles:
| Role | Focus | Target |
|---|---|---|
| Producers and freelancers | Focused on client work and delivery | 75%–80% |
| Managers | Focused on managing delivery and clients | 35%–50% |
| Sales team and admin | Focus on pipeline and business management | >10% |
Understanding and improving your billable utilization benchmarks for different roles can significantly impact profitability.
Let’s illustrate the impact of different billable utilization rates on profitability with two agencies:
- Agency A: 50% billable utilization
- Agency B: 60% billable utilization
Both agencies have the same capacity (10,000 available hours per year), delivery costs ($300,000), and average billable rate ($100/hour).
Here’s how that difference in billable utilization plays out:
| Agency | Billable hours | Hourly rate | Revenue | Gross profit | Profit Margin |
|---|---|---|---|---|---|
| A | 5,000 | $100 | $500,000 | $200,000 | 40% |
| B | 6,000 | $100 | $600,000 | $300,000 | 50% |
A seemingly small 10% difference in billable utilization leads to a substantial difference in profitability. Agency B’s gross profit is $100,000 higher than Agency A’s because its employees spend more time on billable work.
5 best practices to accurately track billable utilization
Discover five essential best practices to ensure your utilization tracking is precise and actionable:
1. Define billable and non-billable activities
Clearly define billable and non-billable activities for your team so they can accurately capture their billable hours. And make sure everyone knows which tasks fall under which category.
In Scoro, you can do this by setting up “Activity types.” Your team members can link tasks, events, and time entries with the predefined activity types to easily label billable vs. non-billable work.
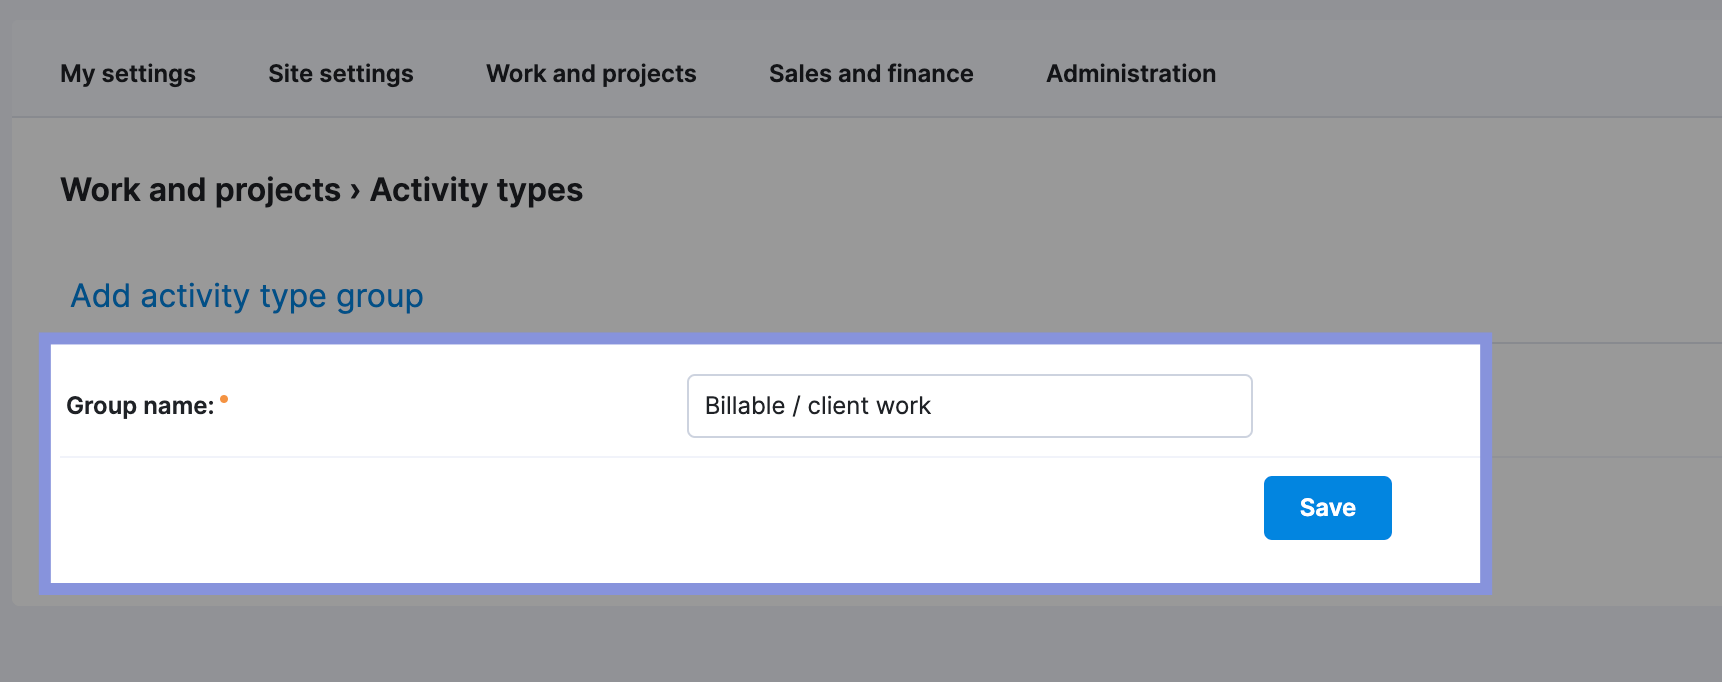
Go to “Settings.” Then, under the “Work and projects” column, click “Activity Types.” Click “Create group” to add your new category.

Add the group name (e.g., “Billable/client work” or “Non-billable/internal work) and click “Save.”
Next, click “+ New.”
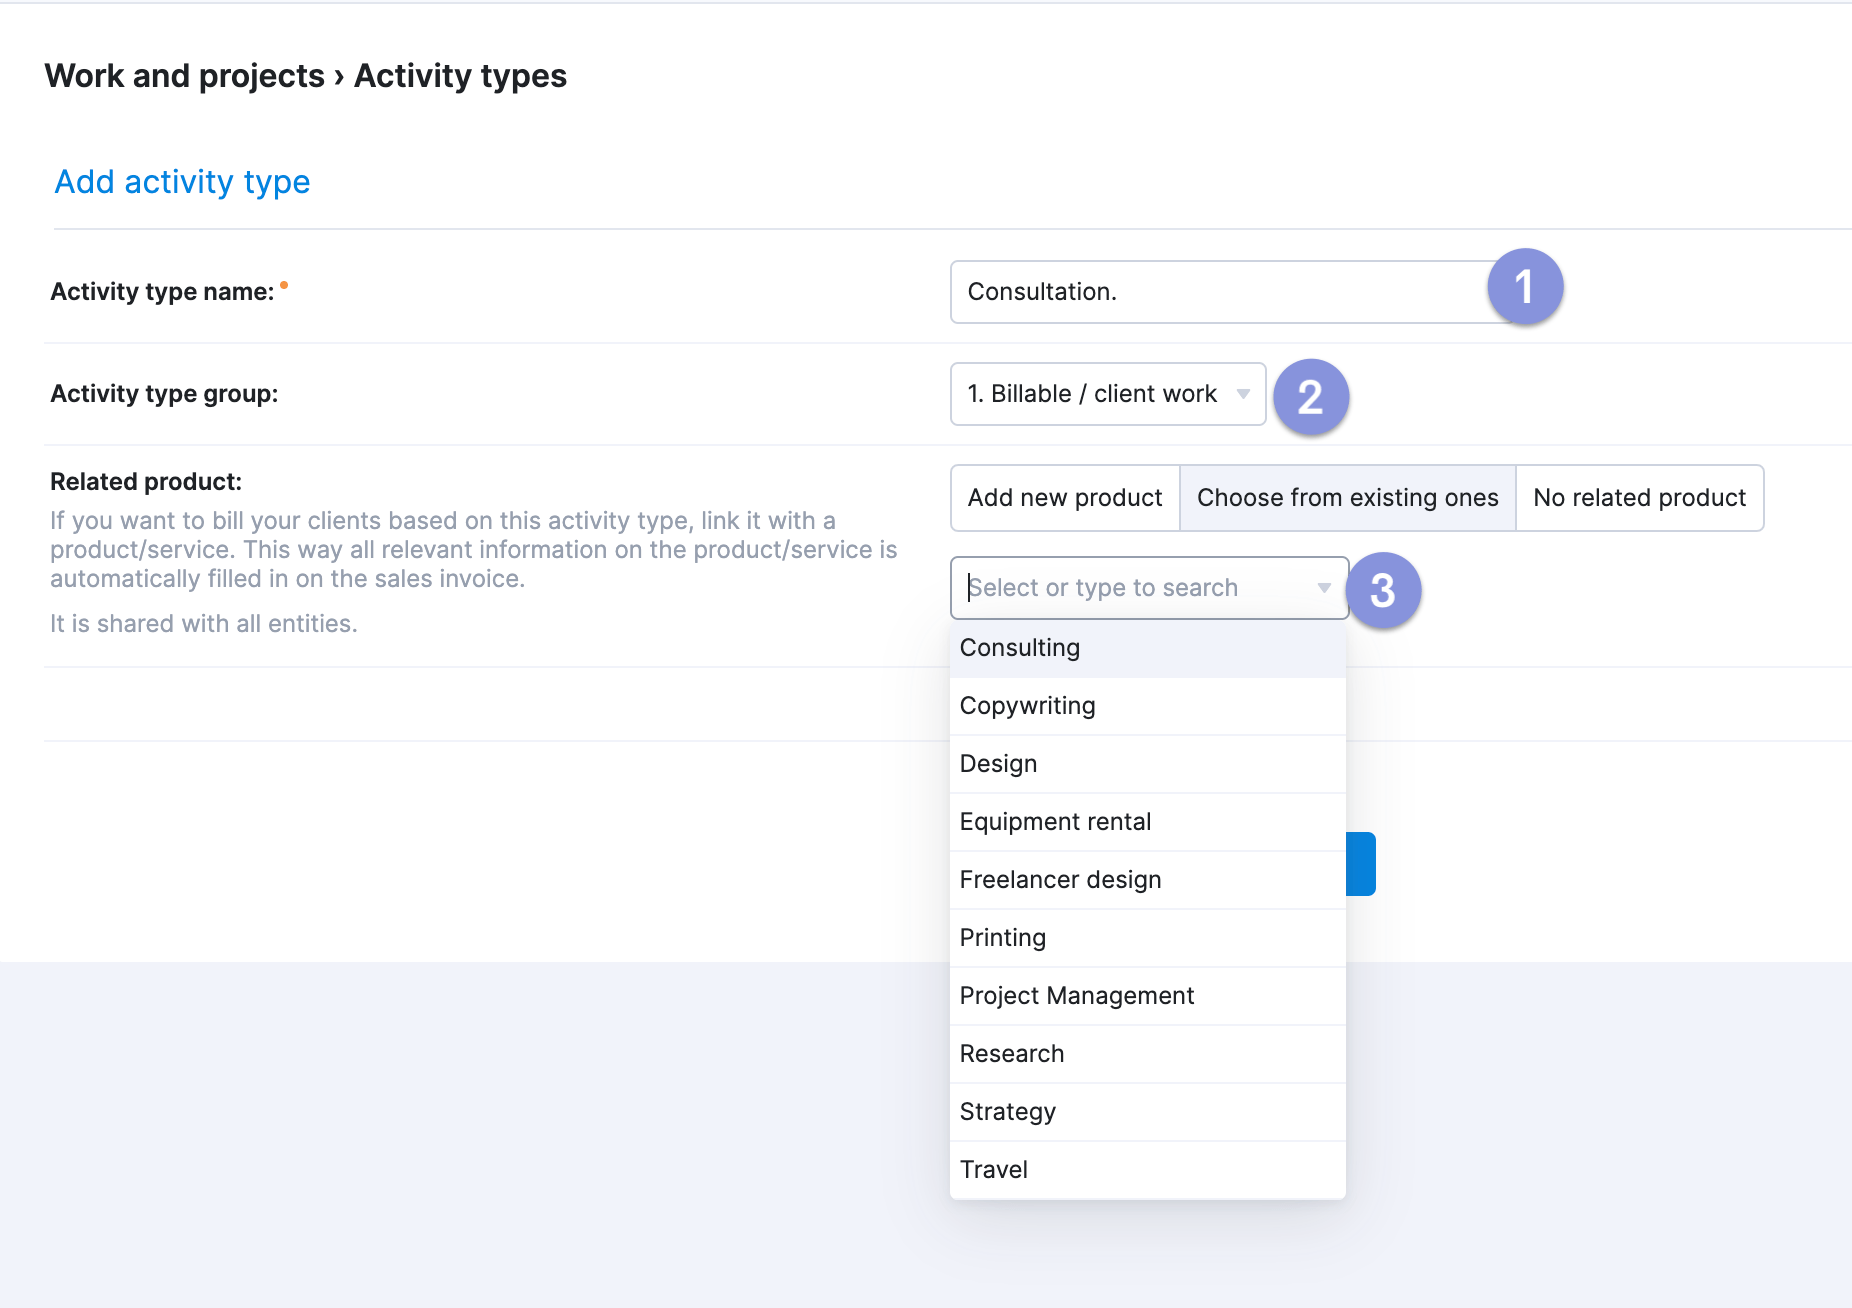
Now, you can enter individual activities within your billable and non-billable categories. Type in the task in the “Activity Type name” box. Choose your category from the “Activity type group” drop-down menu. And select the related product (service). Then, click “Save.”
Note: If you want to bill your clients based on activity type, link it with a product/service. This way, all relevant information on the product/service is automatically filled in on the sales invoice.
Repeat for all the activity types you want to include.
As you add activity types, you’ll be able to view them in one list:
2. Use a project management tool with integrated time tracking
A time tracking system allows your team to easily track and categorize their time so you can accurately monitor and analyze billable utilization.
For example, Toggl, Harvest, and Timely are popular employee time tracking tools. But using stand-alone software means adding yet another tool to your tech stack.
Scoro offers four different methods of time tracking, giving each team member flexibility to pick a method that fits with their working style:
- Real-time tracking with a timer
- Real-time tracking with documented tasks
- Retrospective logging from timesheets
- Automatic tracking through calendar entries
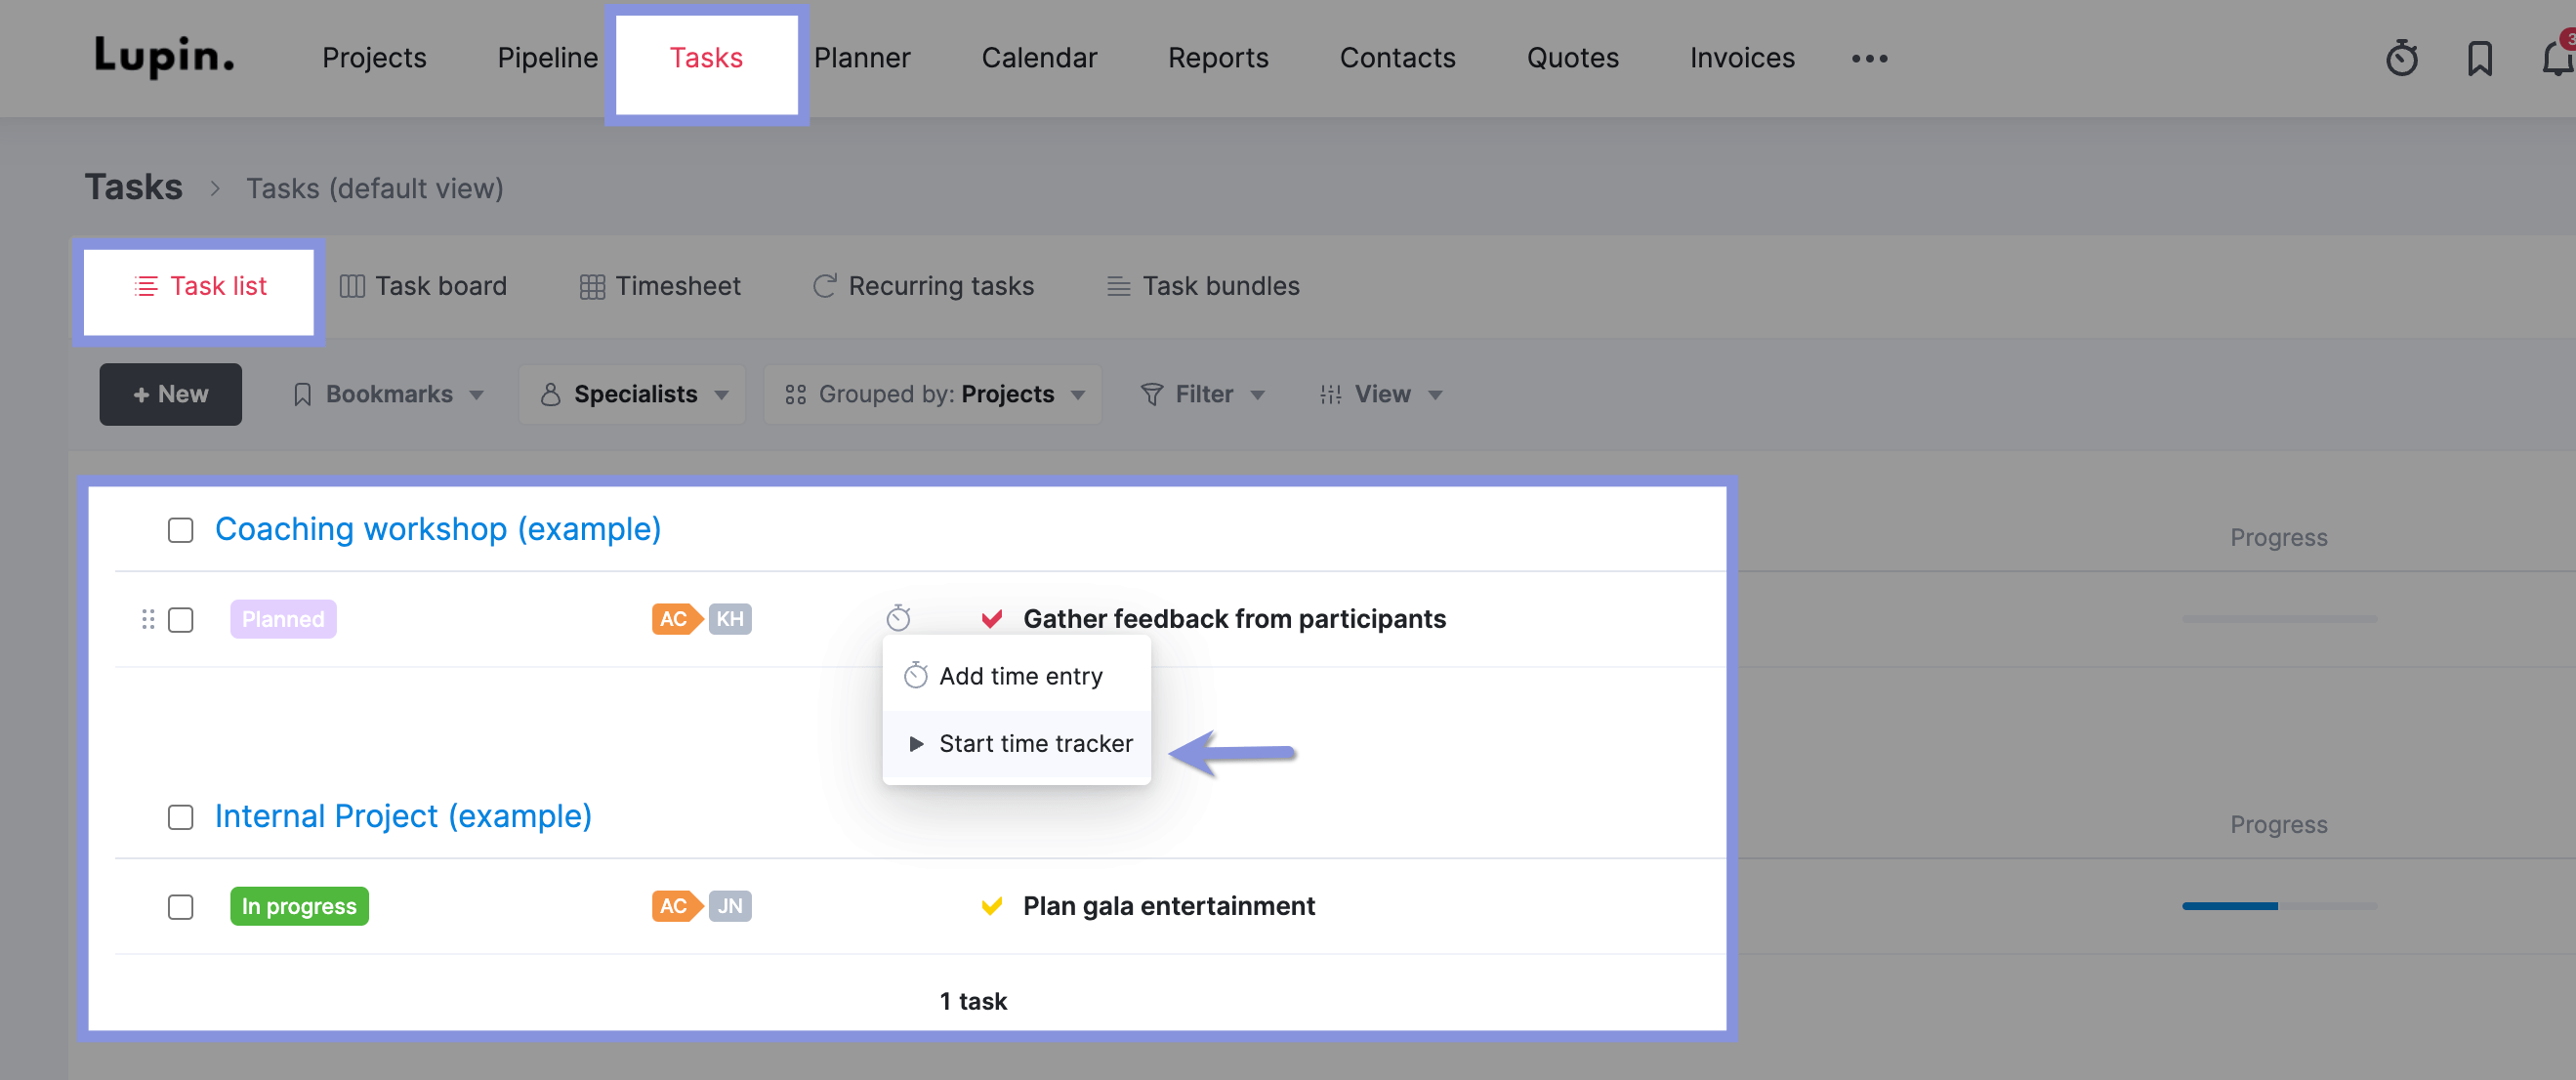
The stopwatch timer icon lets team members start time tracking from any page. They click the play button to start tracking time on a logged task. Or they can add a new one.
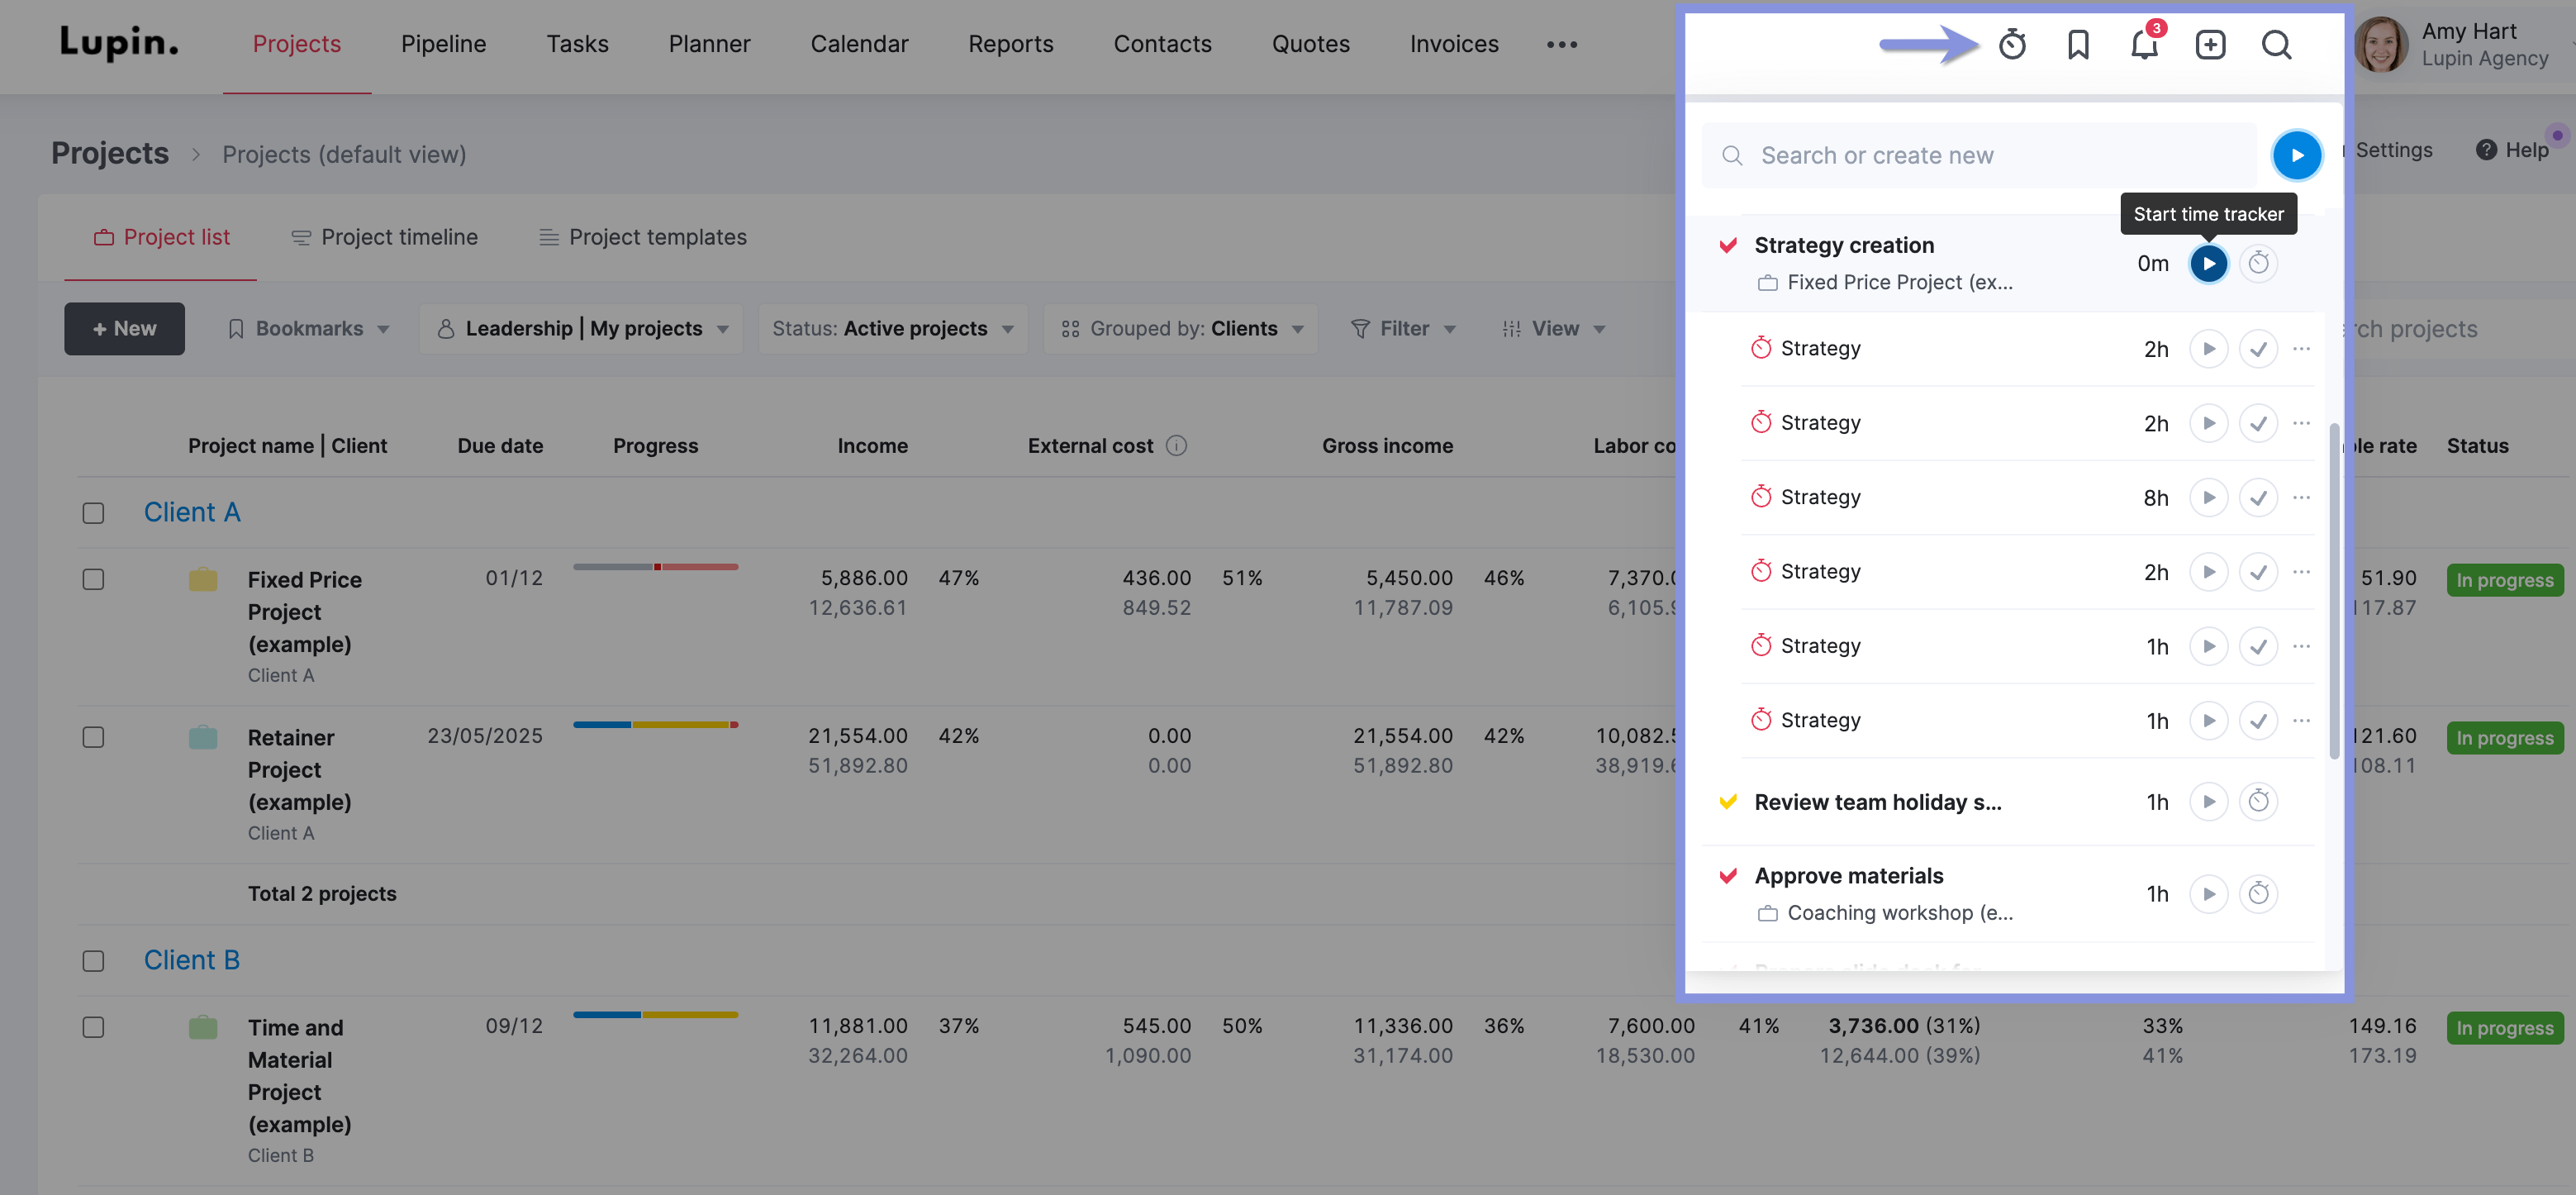
They can also start tracking in real time from their “Task list” within the “Tasks” module. Hover over the stopwatch information and click “Start time tracker.”
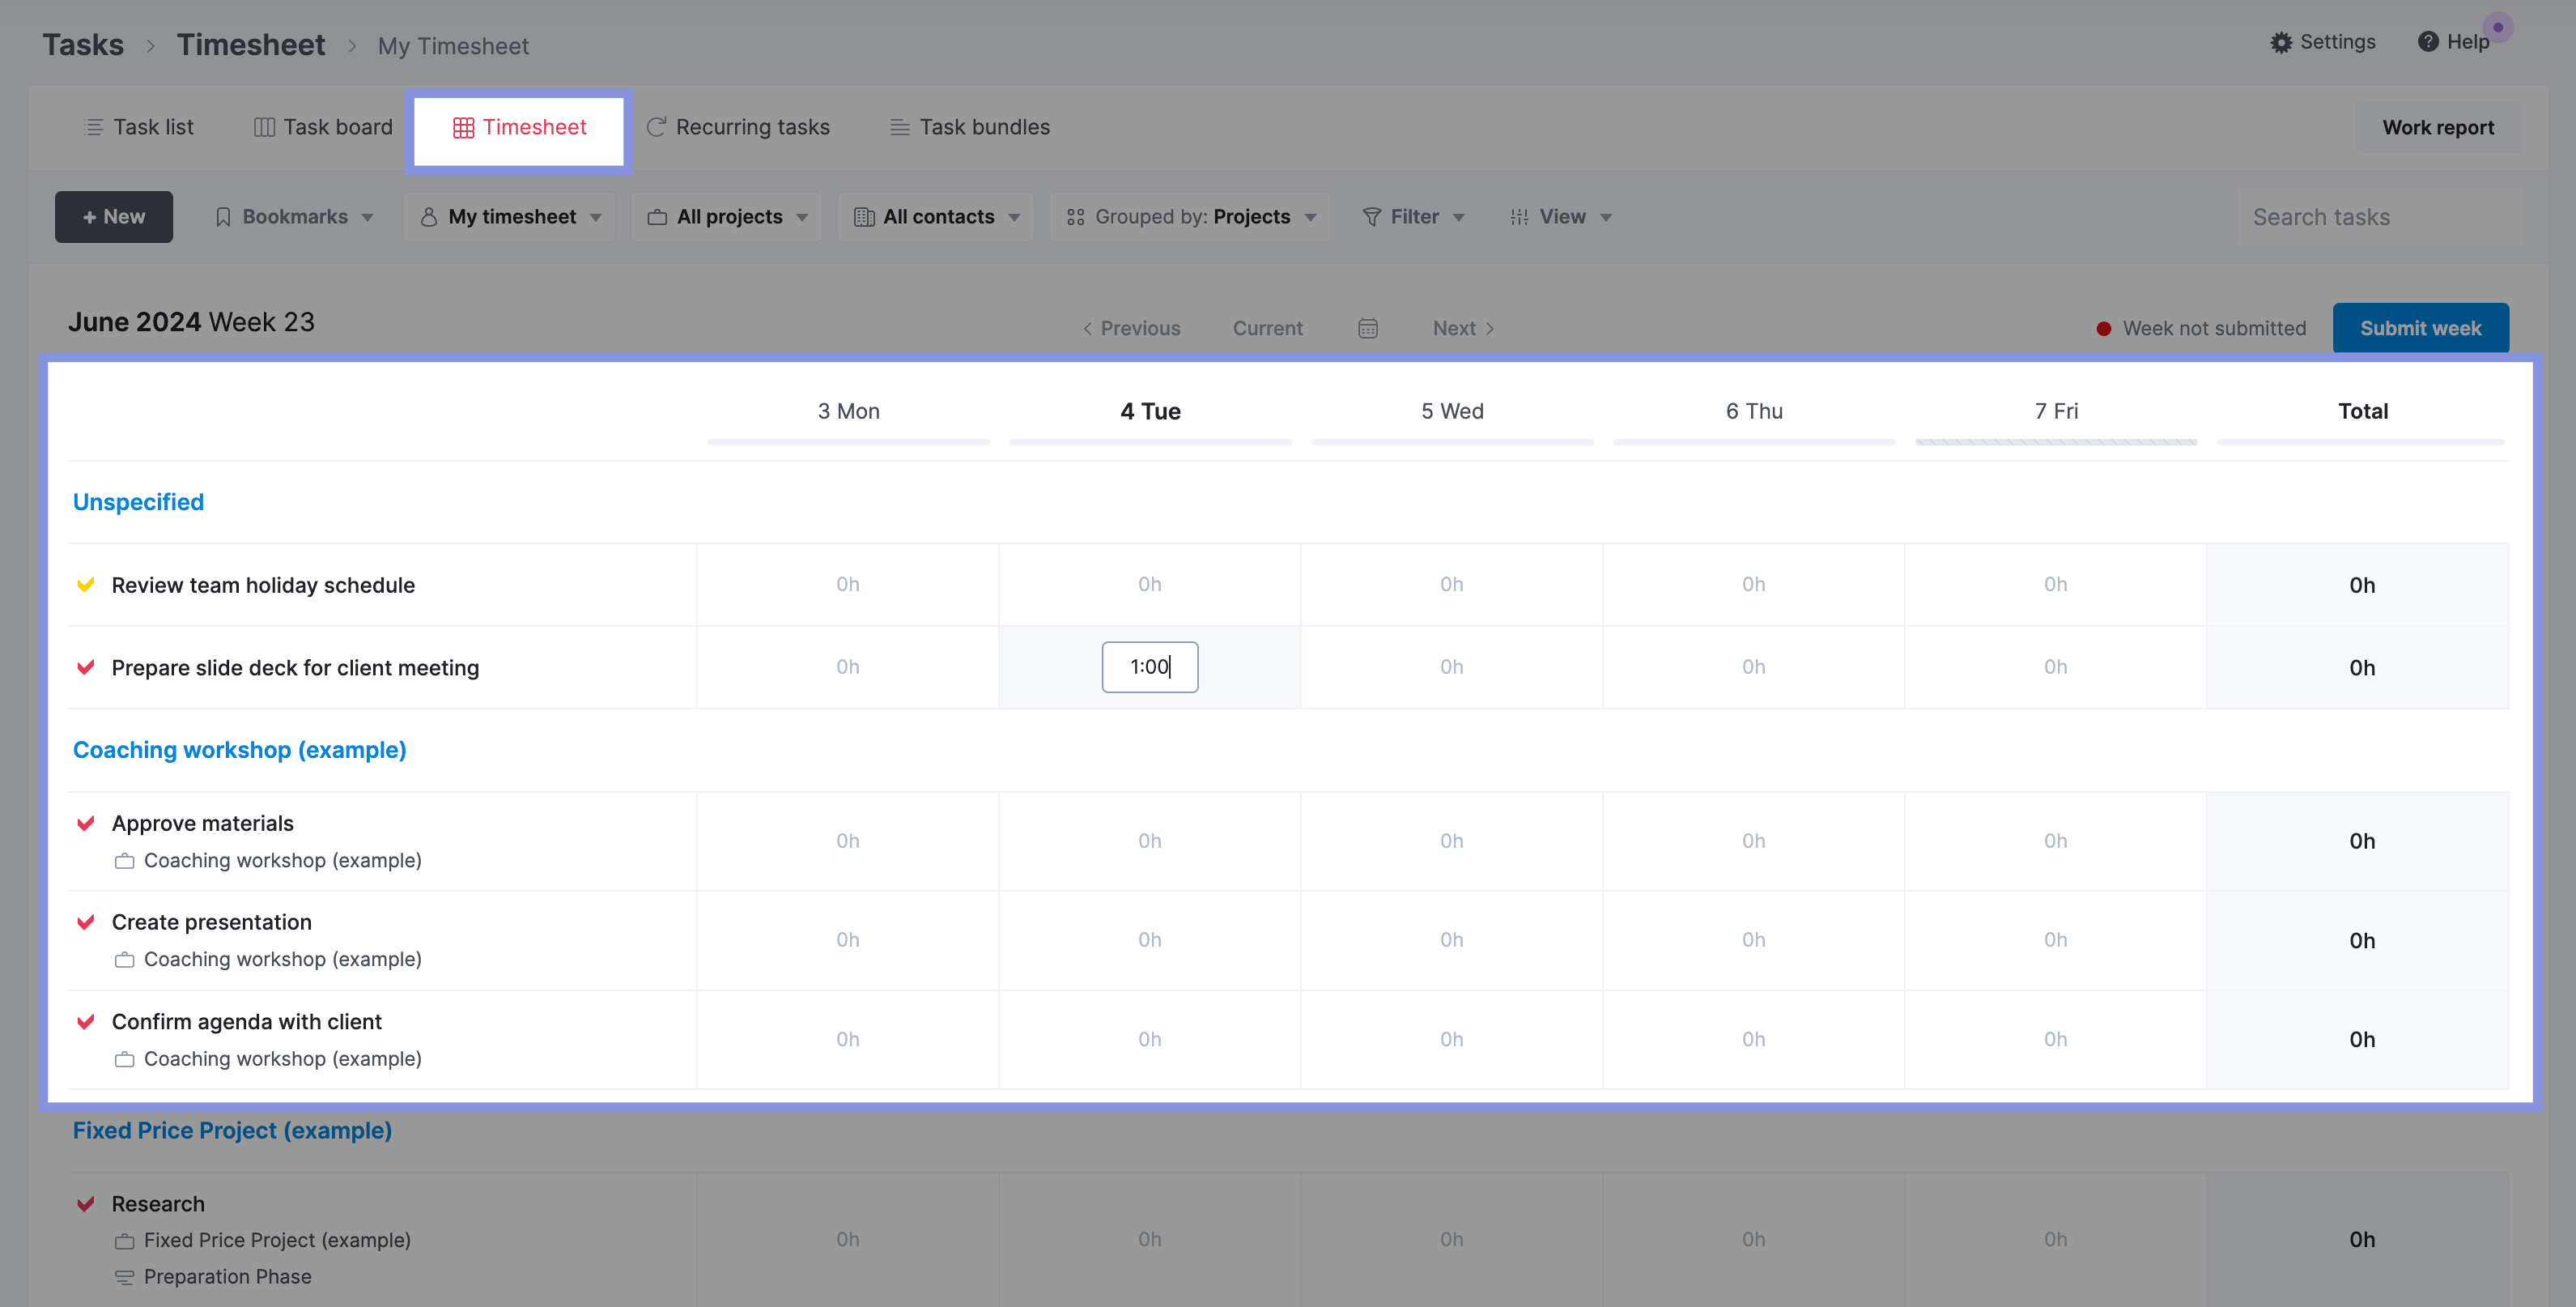
Employees can also log time retrospectively using the “Timesheet” view.
From there, they can see scheduled tasks and events. And the amount of time spent per day on each task.
To add time, they must click on the box for a specific task or event on any day.
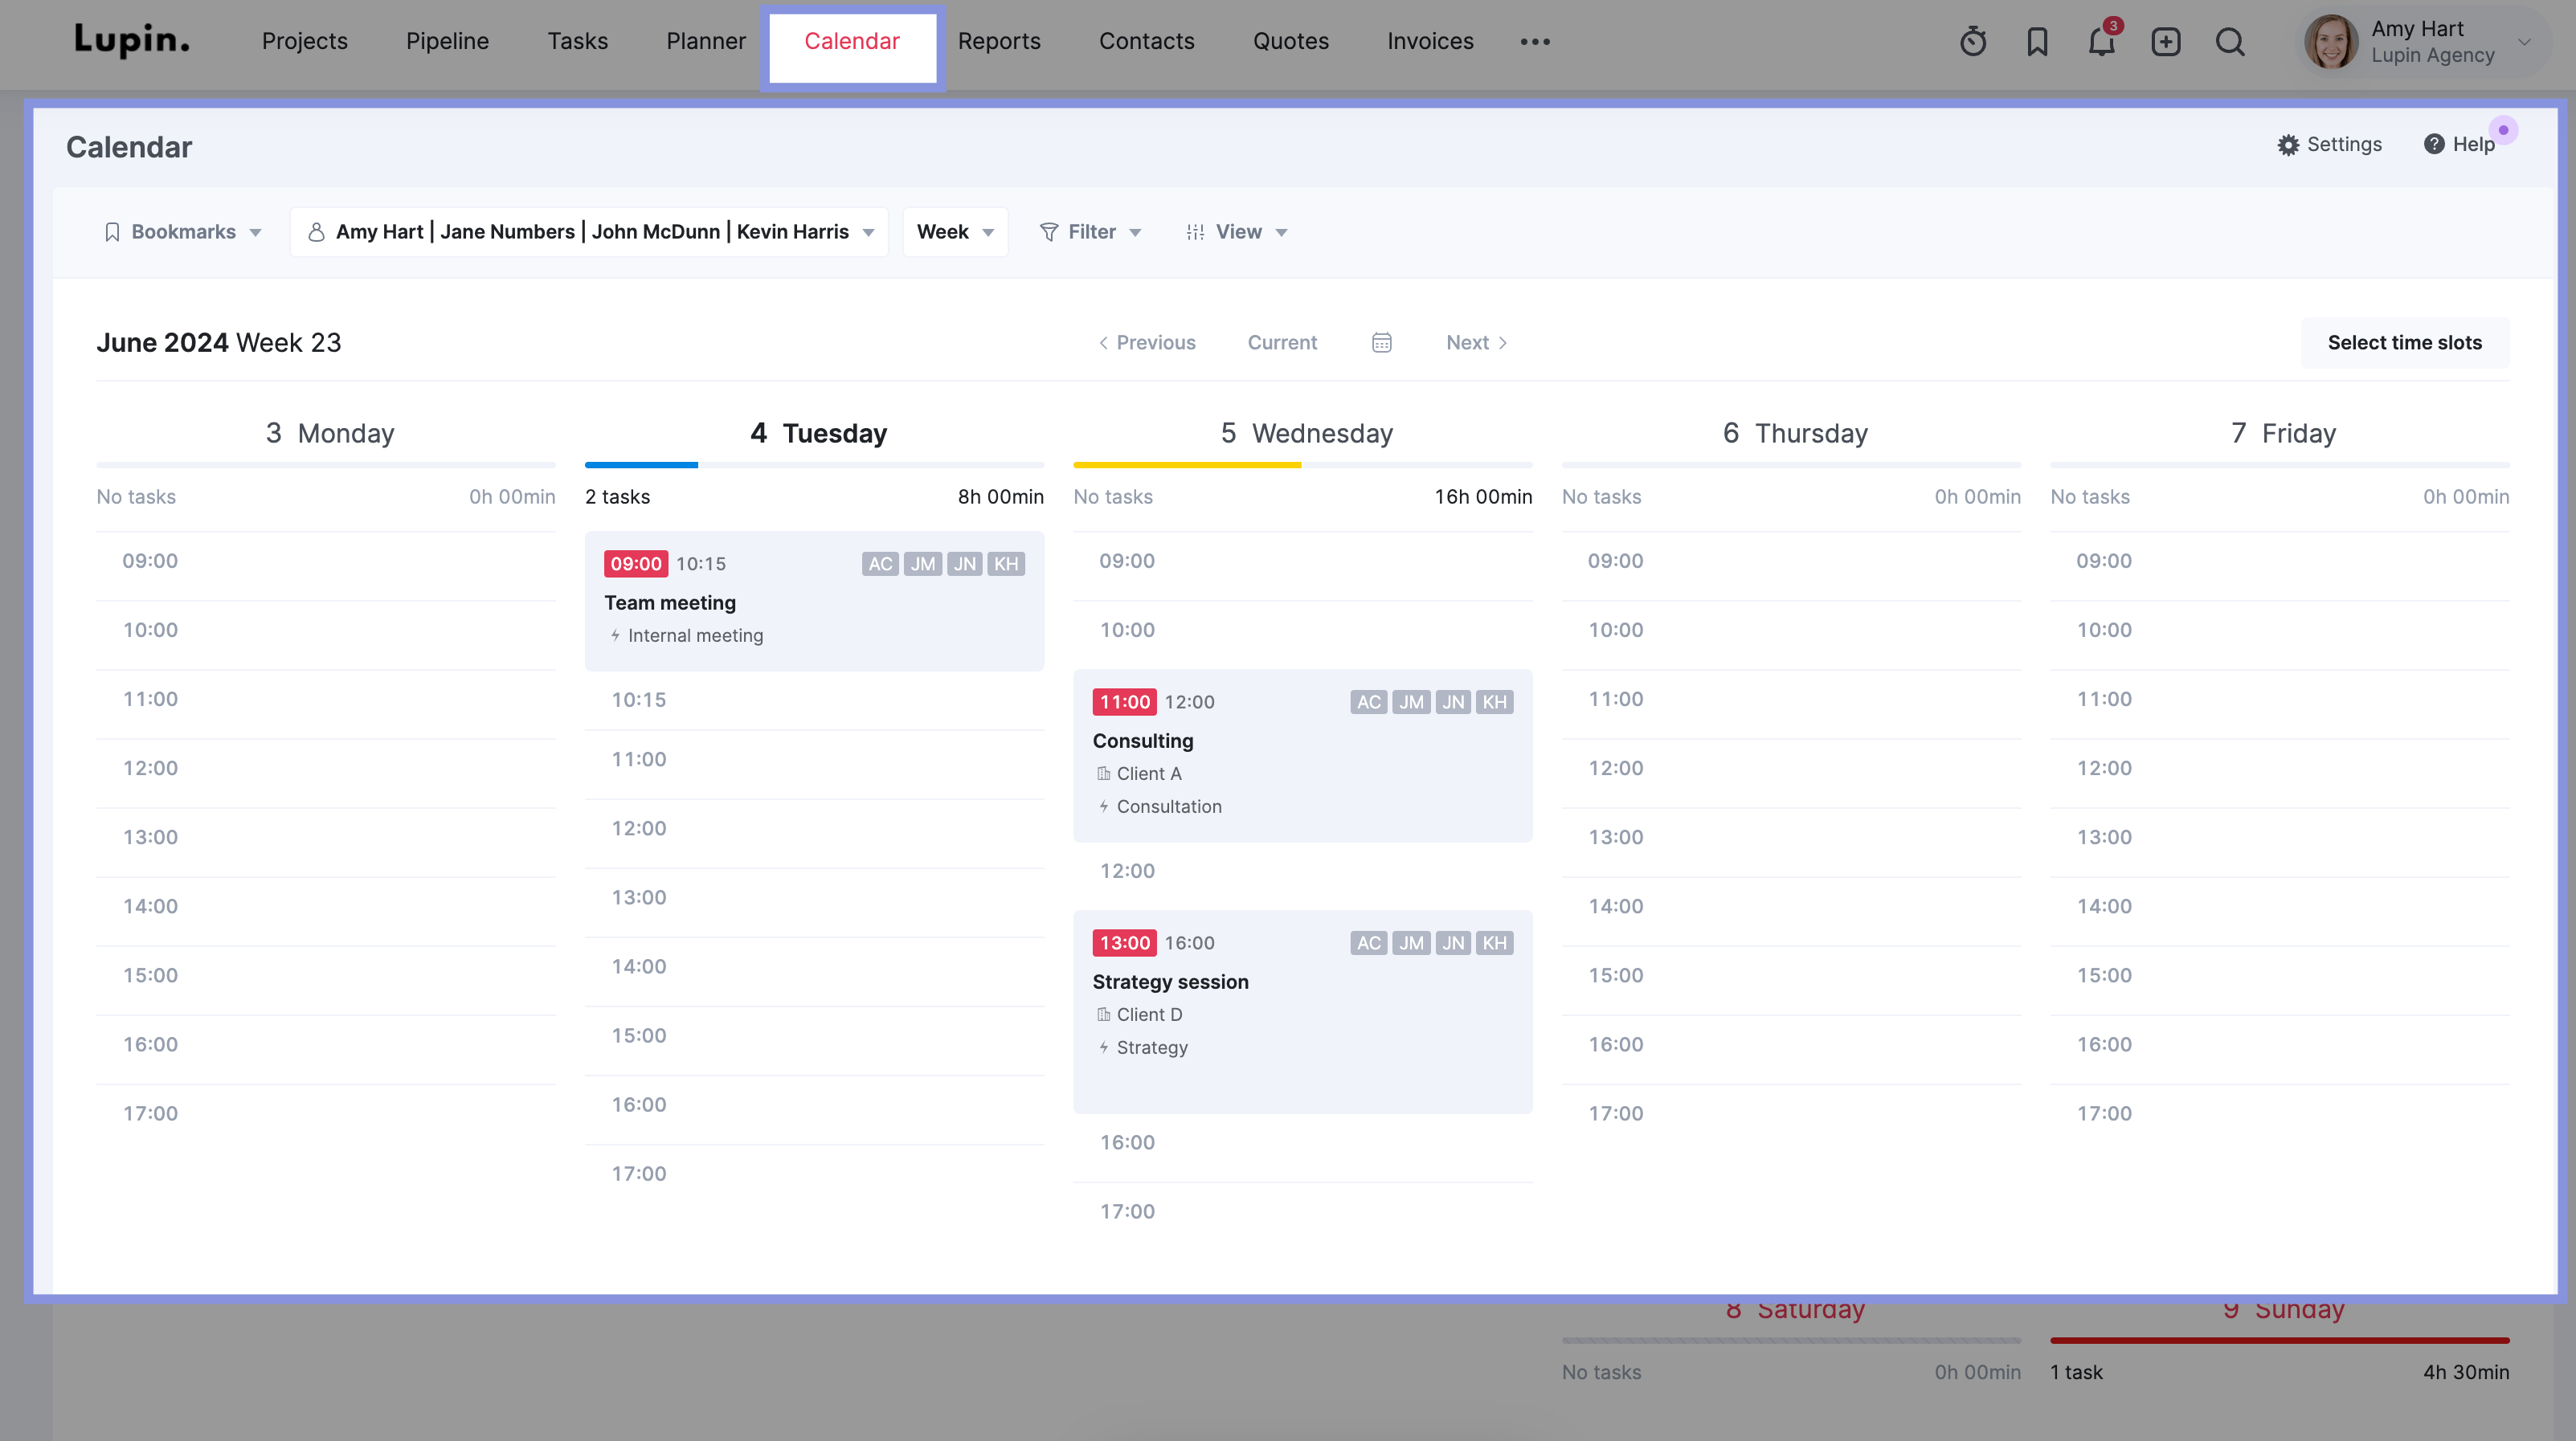
The last option is for team members to track time automatically using events in the “Calendar” view. When they book a meeting slot or focus time in their Scoro Calendar, the time is automatically added to their timesheet report.
Bonus tip: To ensure everyone categorizes their work accurately, no matter how they track time, add “Activity type” to your “Mandatory and unique fields” settings.
3. Monitor billable utilization regularly
Ideally, you’ll review billable utilization before, during, and after projects to continuously identify trends, underperforming areas, and opportunities for improvement.
With Scoro, you can easily track billable utilization and get the real-time visibility your team needs to ensure profitability.
Scoro’s “Utilization report” creates utilization rates based on your team’s time logs and a default eight-hour workday setting.
To change anyone’s default availability, go to “Settings.” Click “Availability.” under the “Work and Projects” column. Then click “+ New.”

To change a team member’s working hours, click in any date box and uncheck any days as needed.
Then, use the “From” and “Until” date boxes at the top to set this capacity for a certain period. You can also check the “Indefinite” box to make it the default schedule.

Now that everyone’s capacity has been updated, go to the “Reports” module and click “Utilization report.”
By default, Scoro’s “Utilization report” displays the resource utilization rate, including billable and non-billable hours.
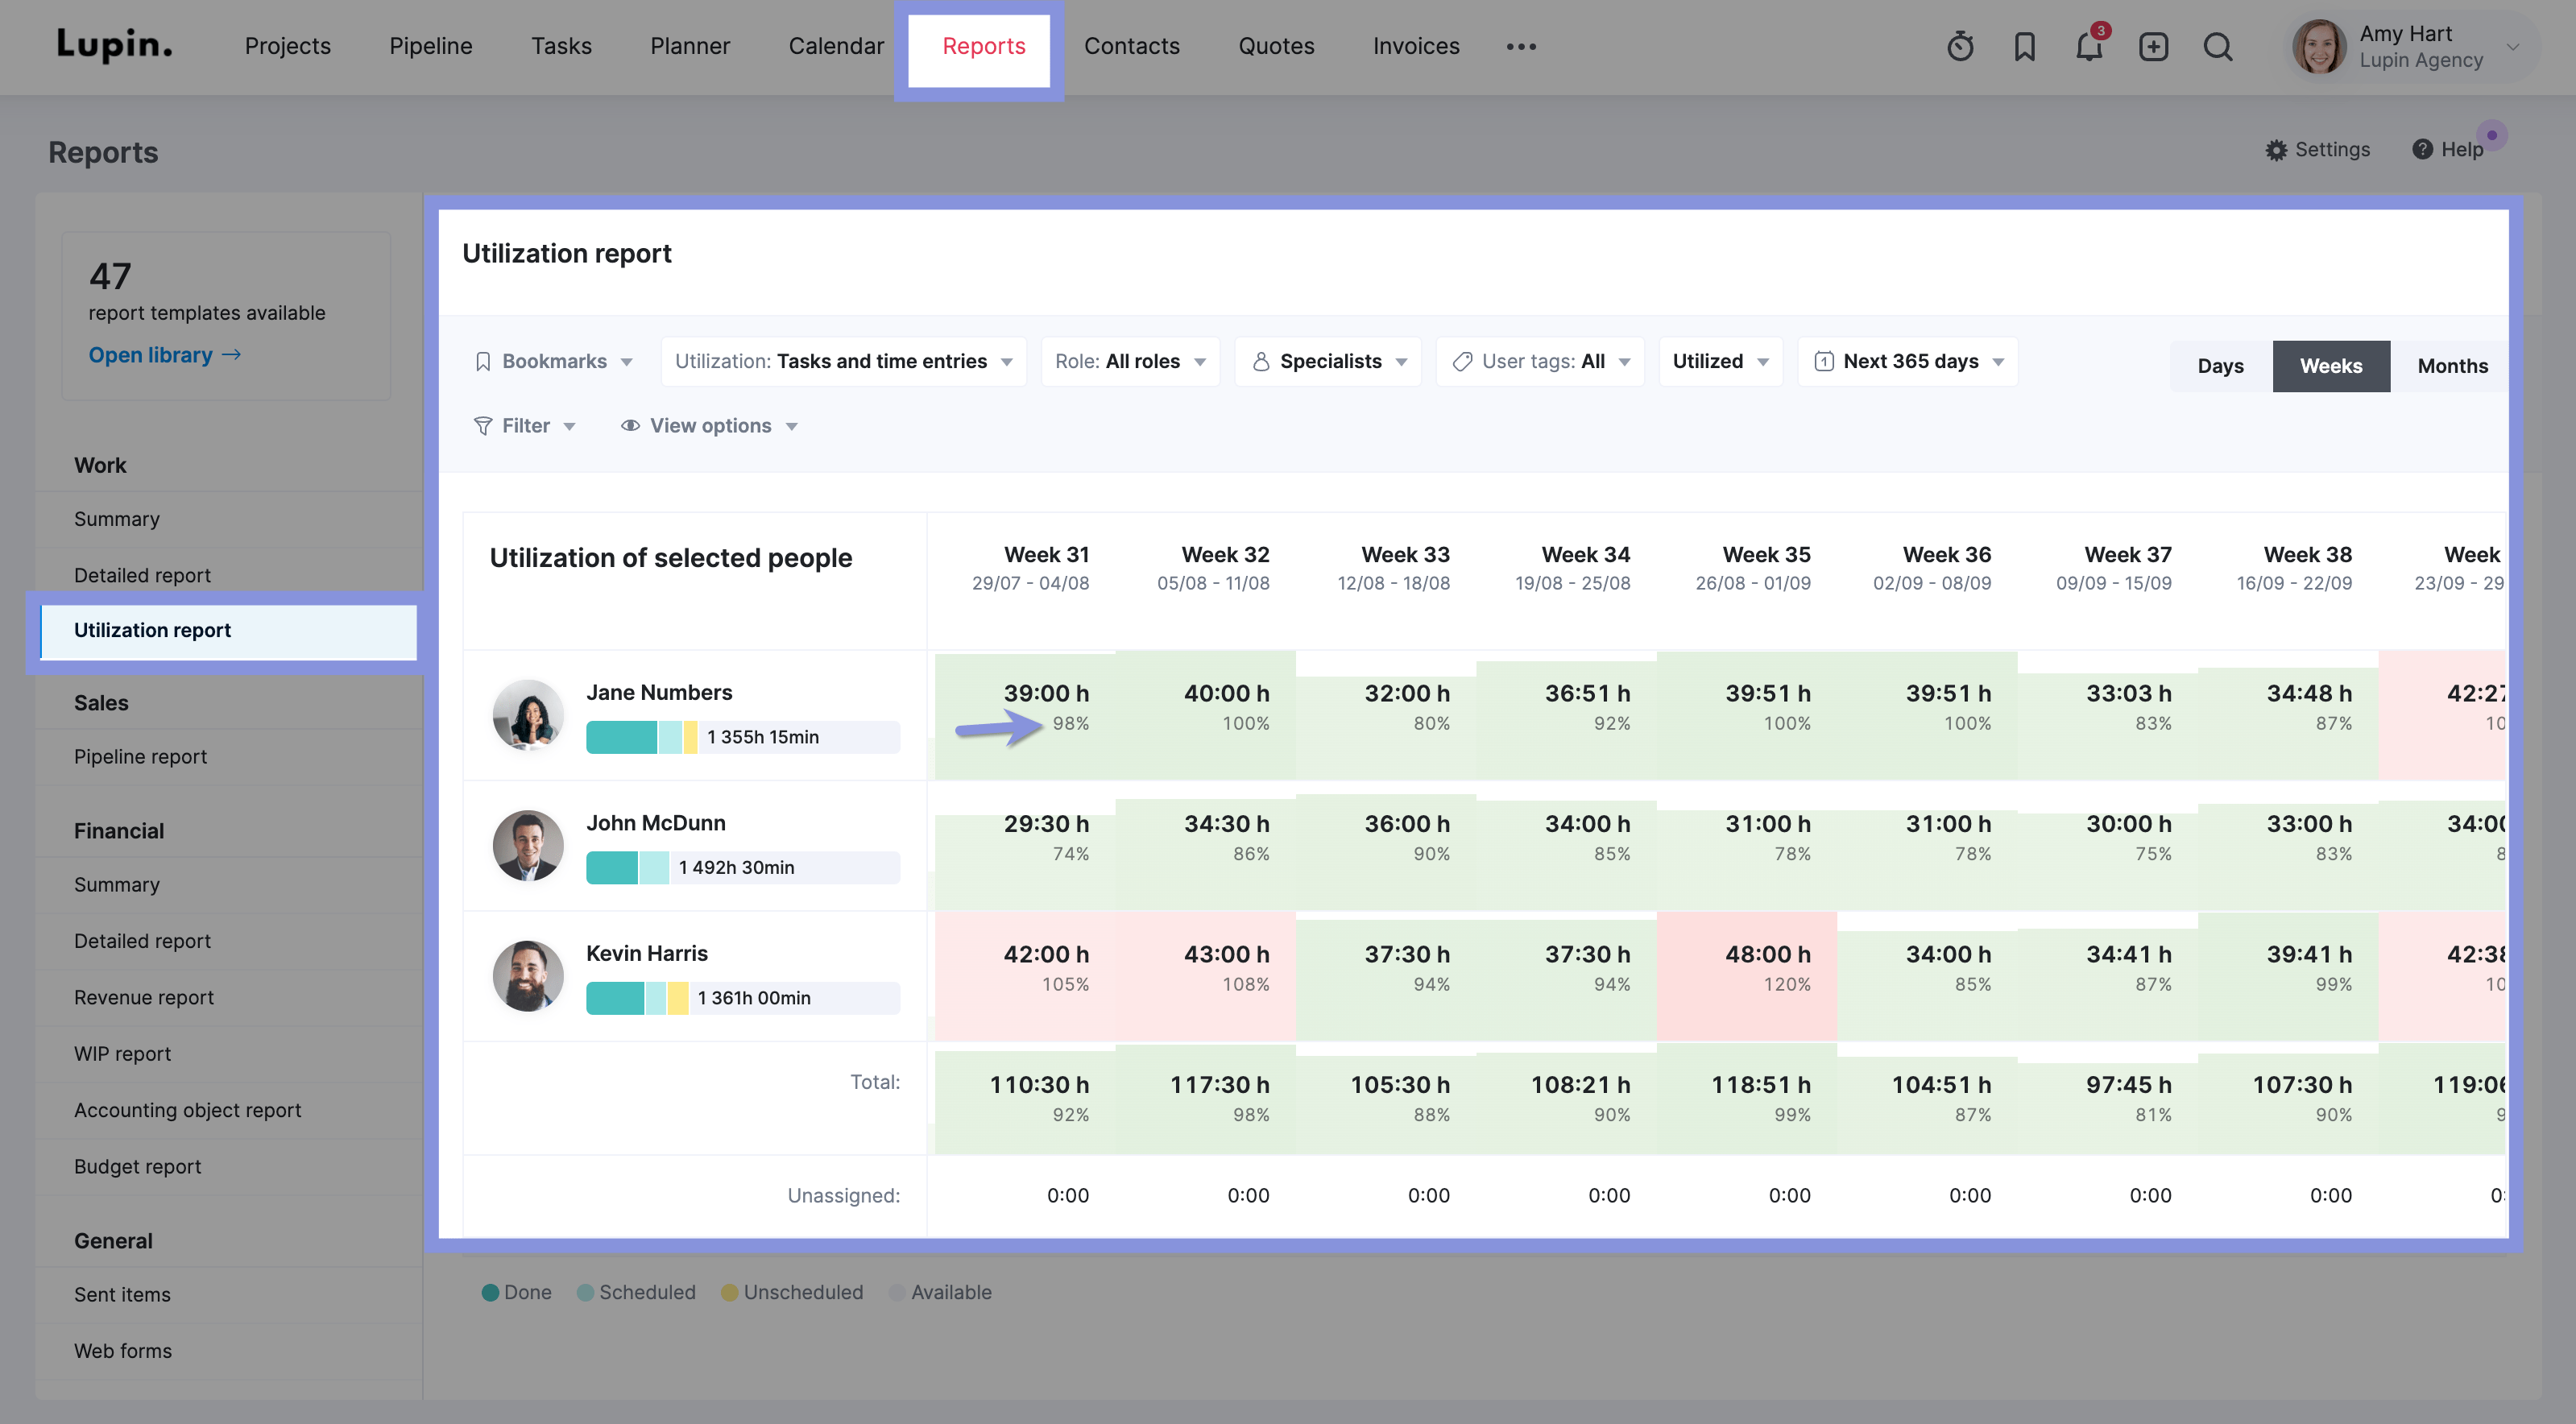
To see the billable utilization rate specifically, you must filter the data to show only logged hours associated with the billable activity types and tasks you previously defined in the settings.
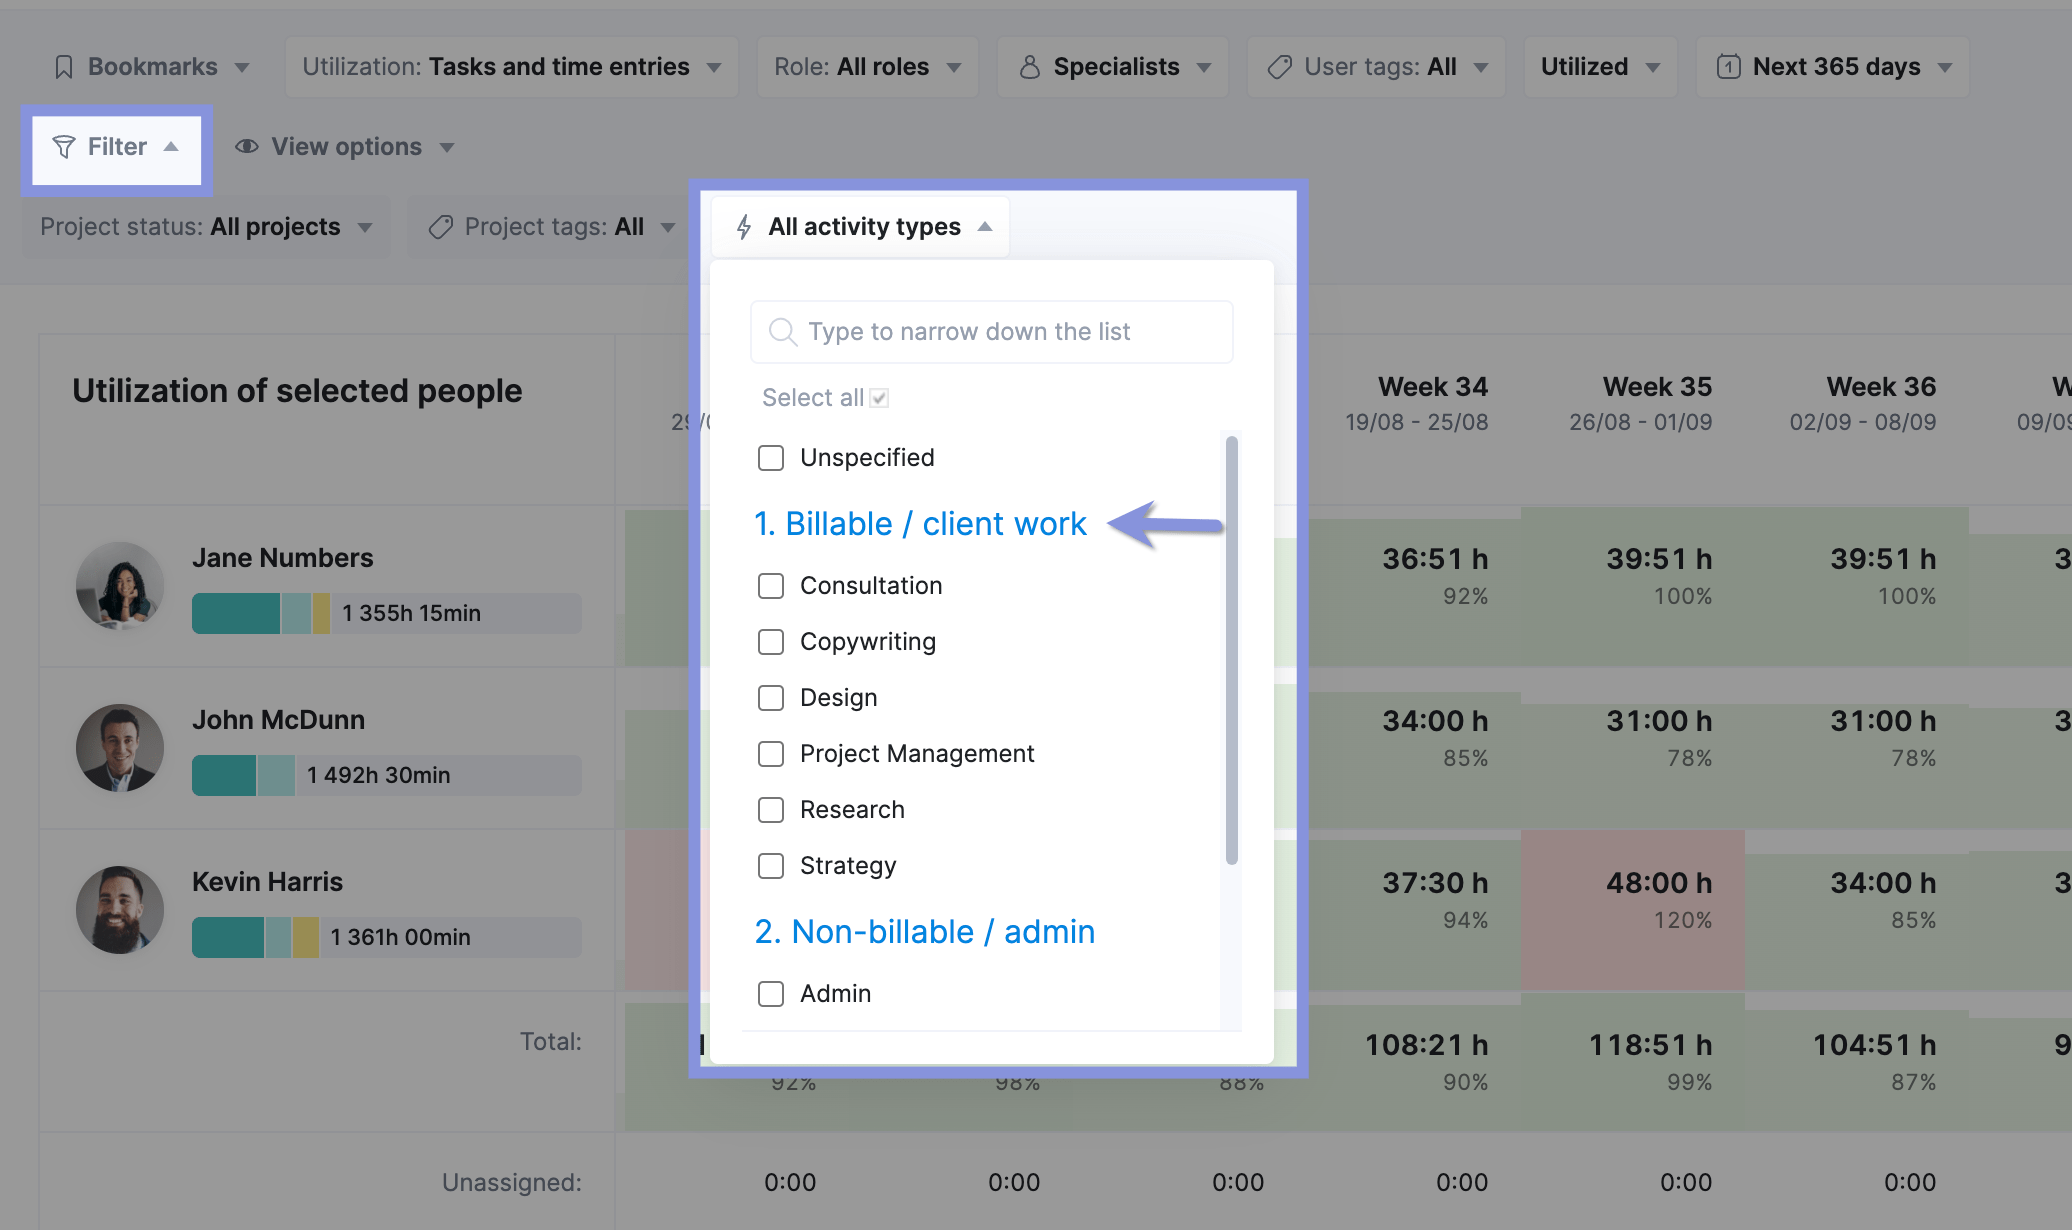
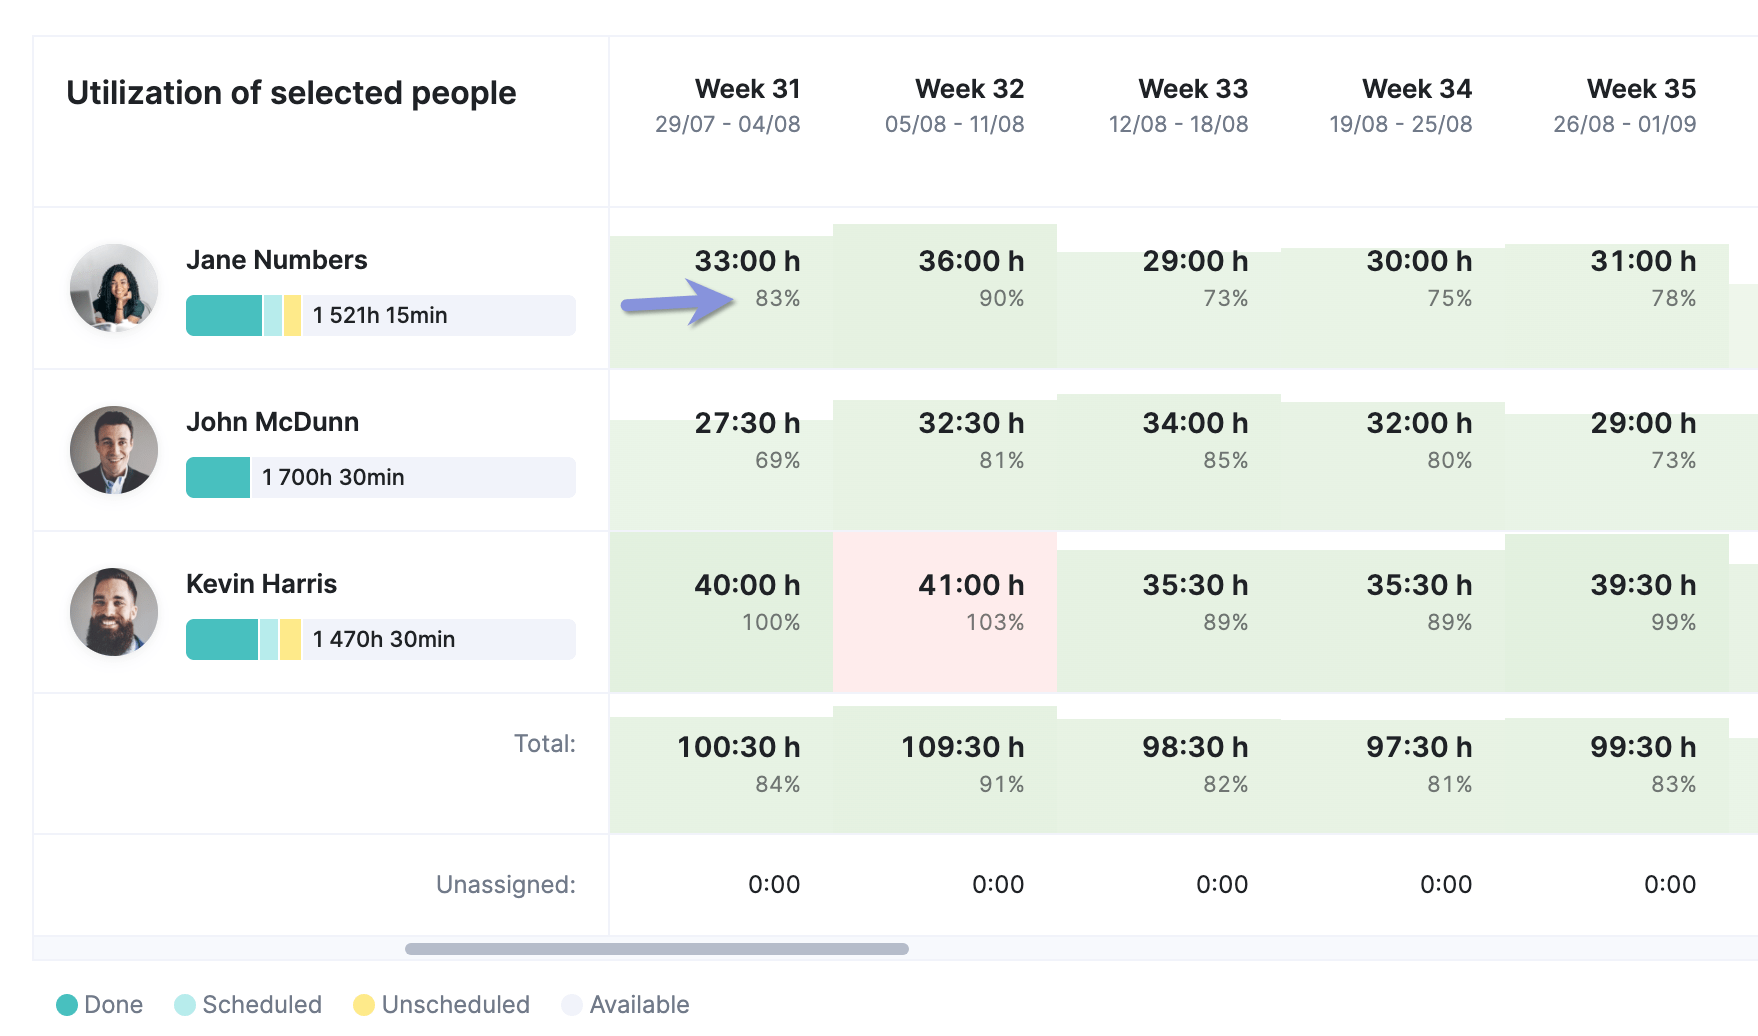
This will show your team’s daily, weekly, or monthly billable utilization rates, which should typically be lower than your overall resource utilization rates, as it doesn’t include non-billable work like administrative tasks or internal meetings.
Each box “fills up” with colors corresponding with workloads:
- White: How much billable capacity a team member has left
- Green: How many billable hours a team member has used while staying within their capacity limit
- Red: How many billable hours a team member has used while going over their capacity limit
If a team member has a lot of white space in their heatmap boxes, you’ll need to find more work for them. See if you can move some tasks from an over-utilized team member (red box) to their workload. Or look for new projects to take on to fill out your team’s workloads.
4. Analyze non-billable time
Don’t overlook the importance of understanding how your team spends non-billable hours. Ideally, for client-facing roles, this should account for no more than 20-25% of their total time. If it exceeds this benchmark, it’s time to investigate.
For example, you might have a few employees who consistently have low billable utilization rates.
By examining their non-billable time, you could discover they’re spending a significant portion of their day on administrative tasks or attending unnecessary meetings. Addressing these issues frees up their time for billable work, boosting their utilization and the agency’s overall revenue.
Scoro’s “Detailed report” can help you pinpoint these areas for improvement and optimize your team’s productivity.
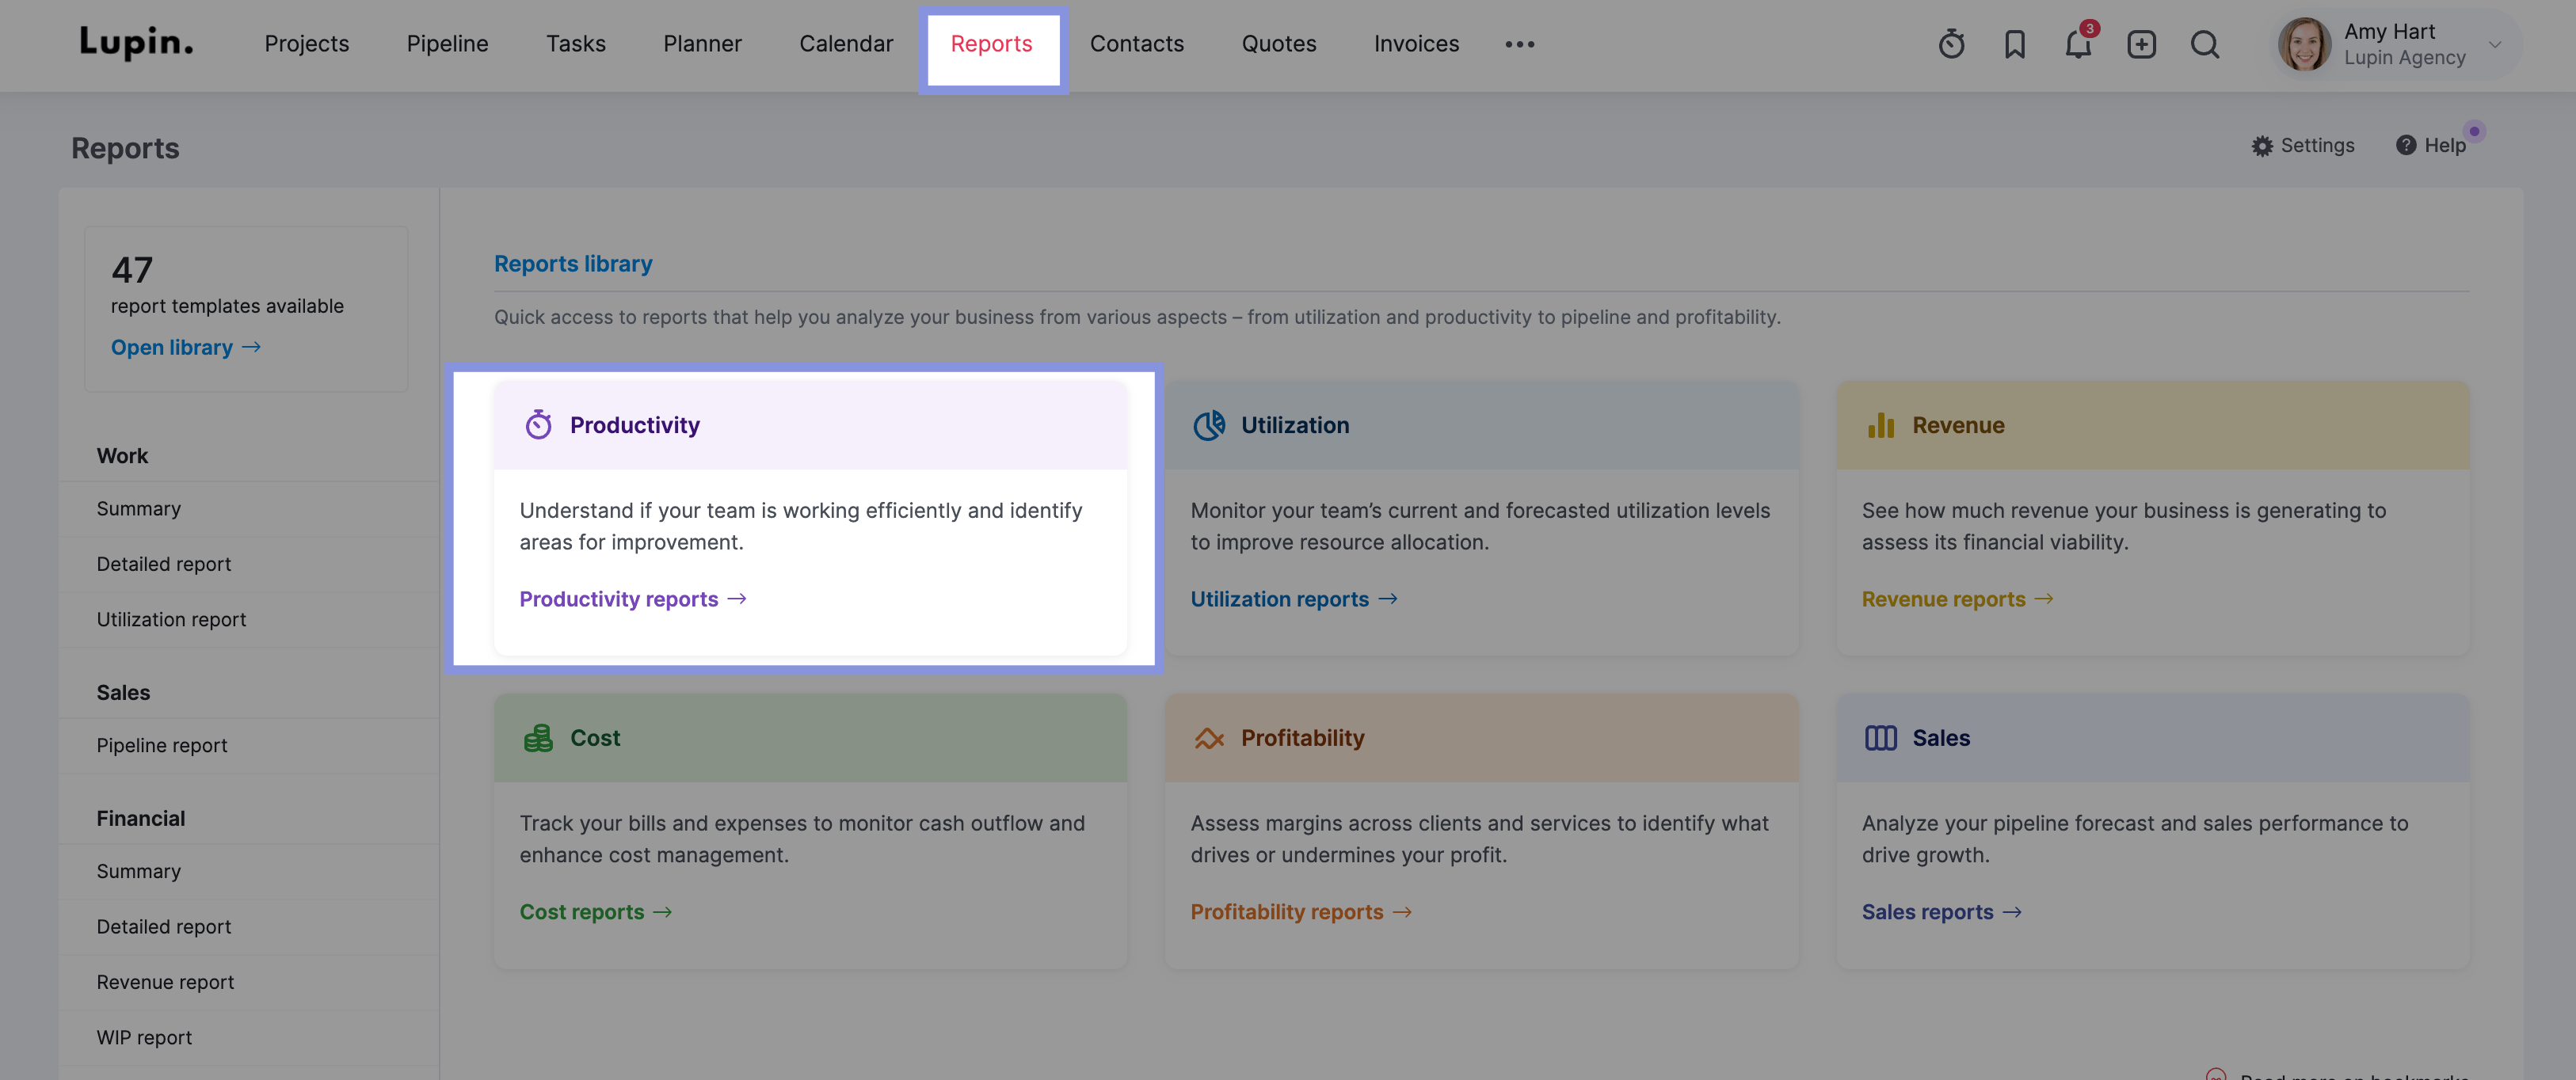
Go to “Reports.” Then click “Productivity,”
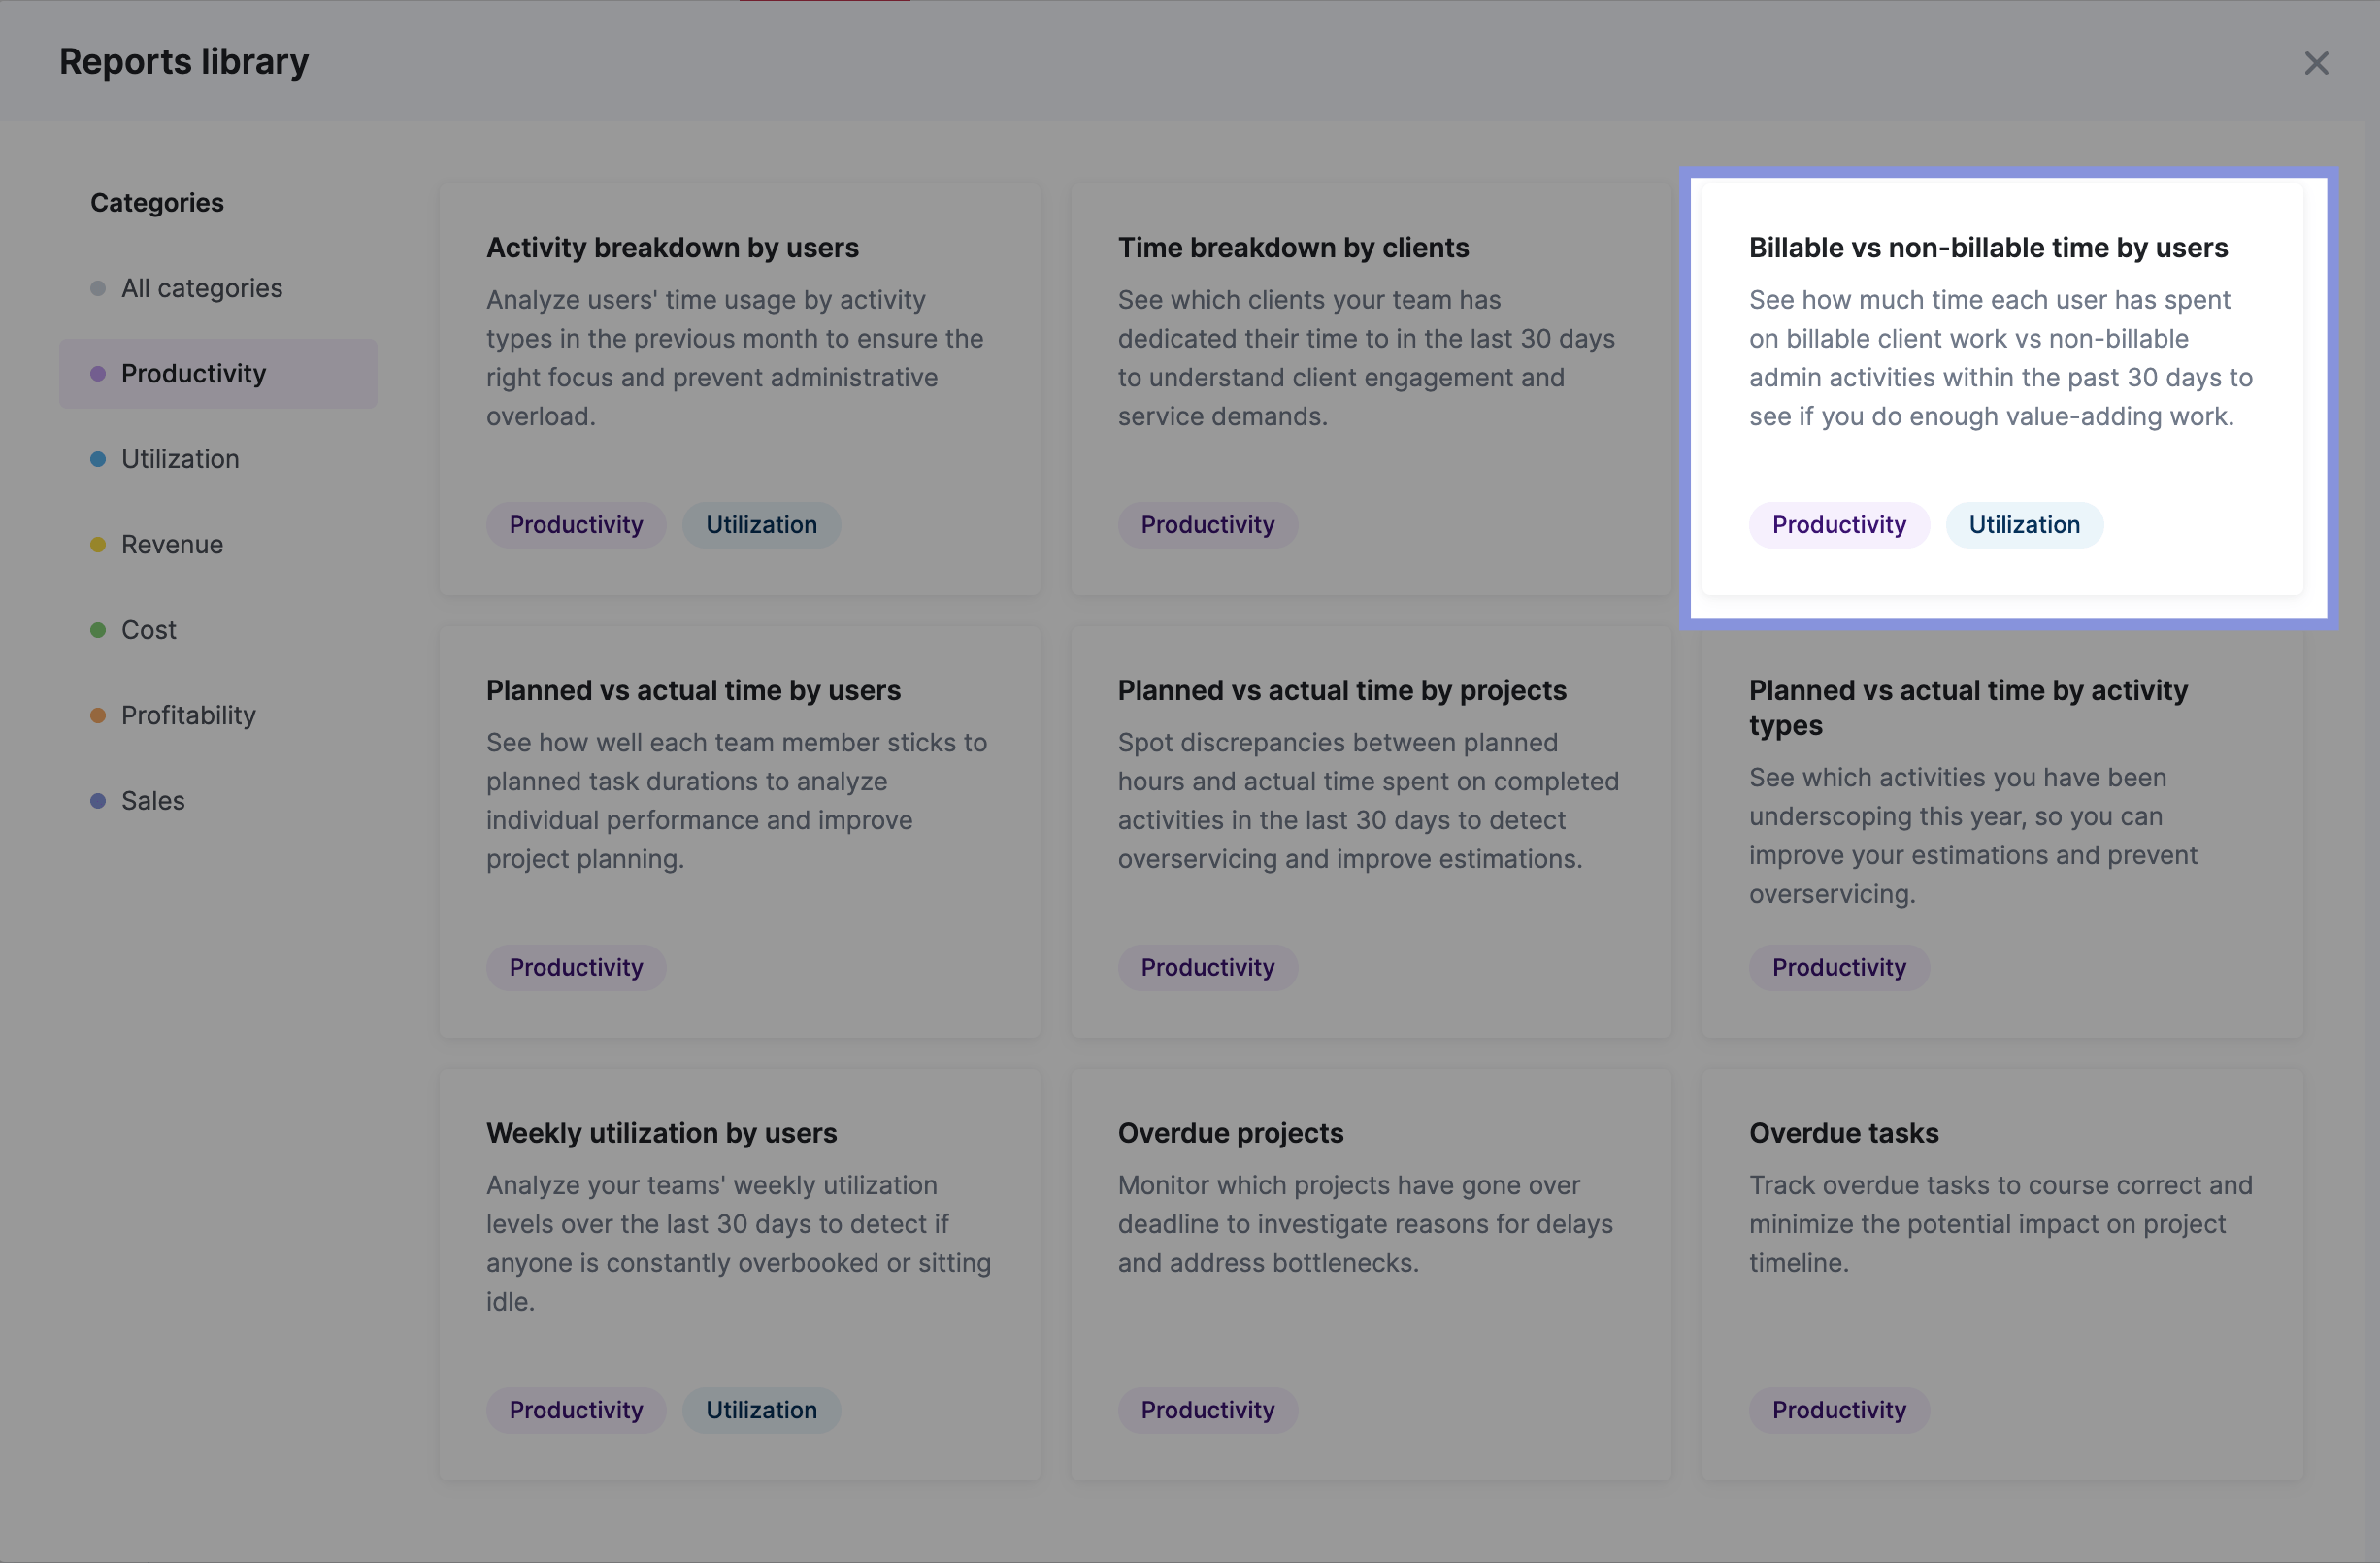
And select the “Billable vs. non-billable time by user” report.
Then, apply the following filters:
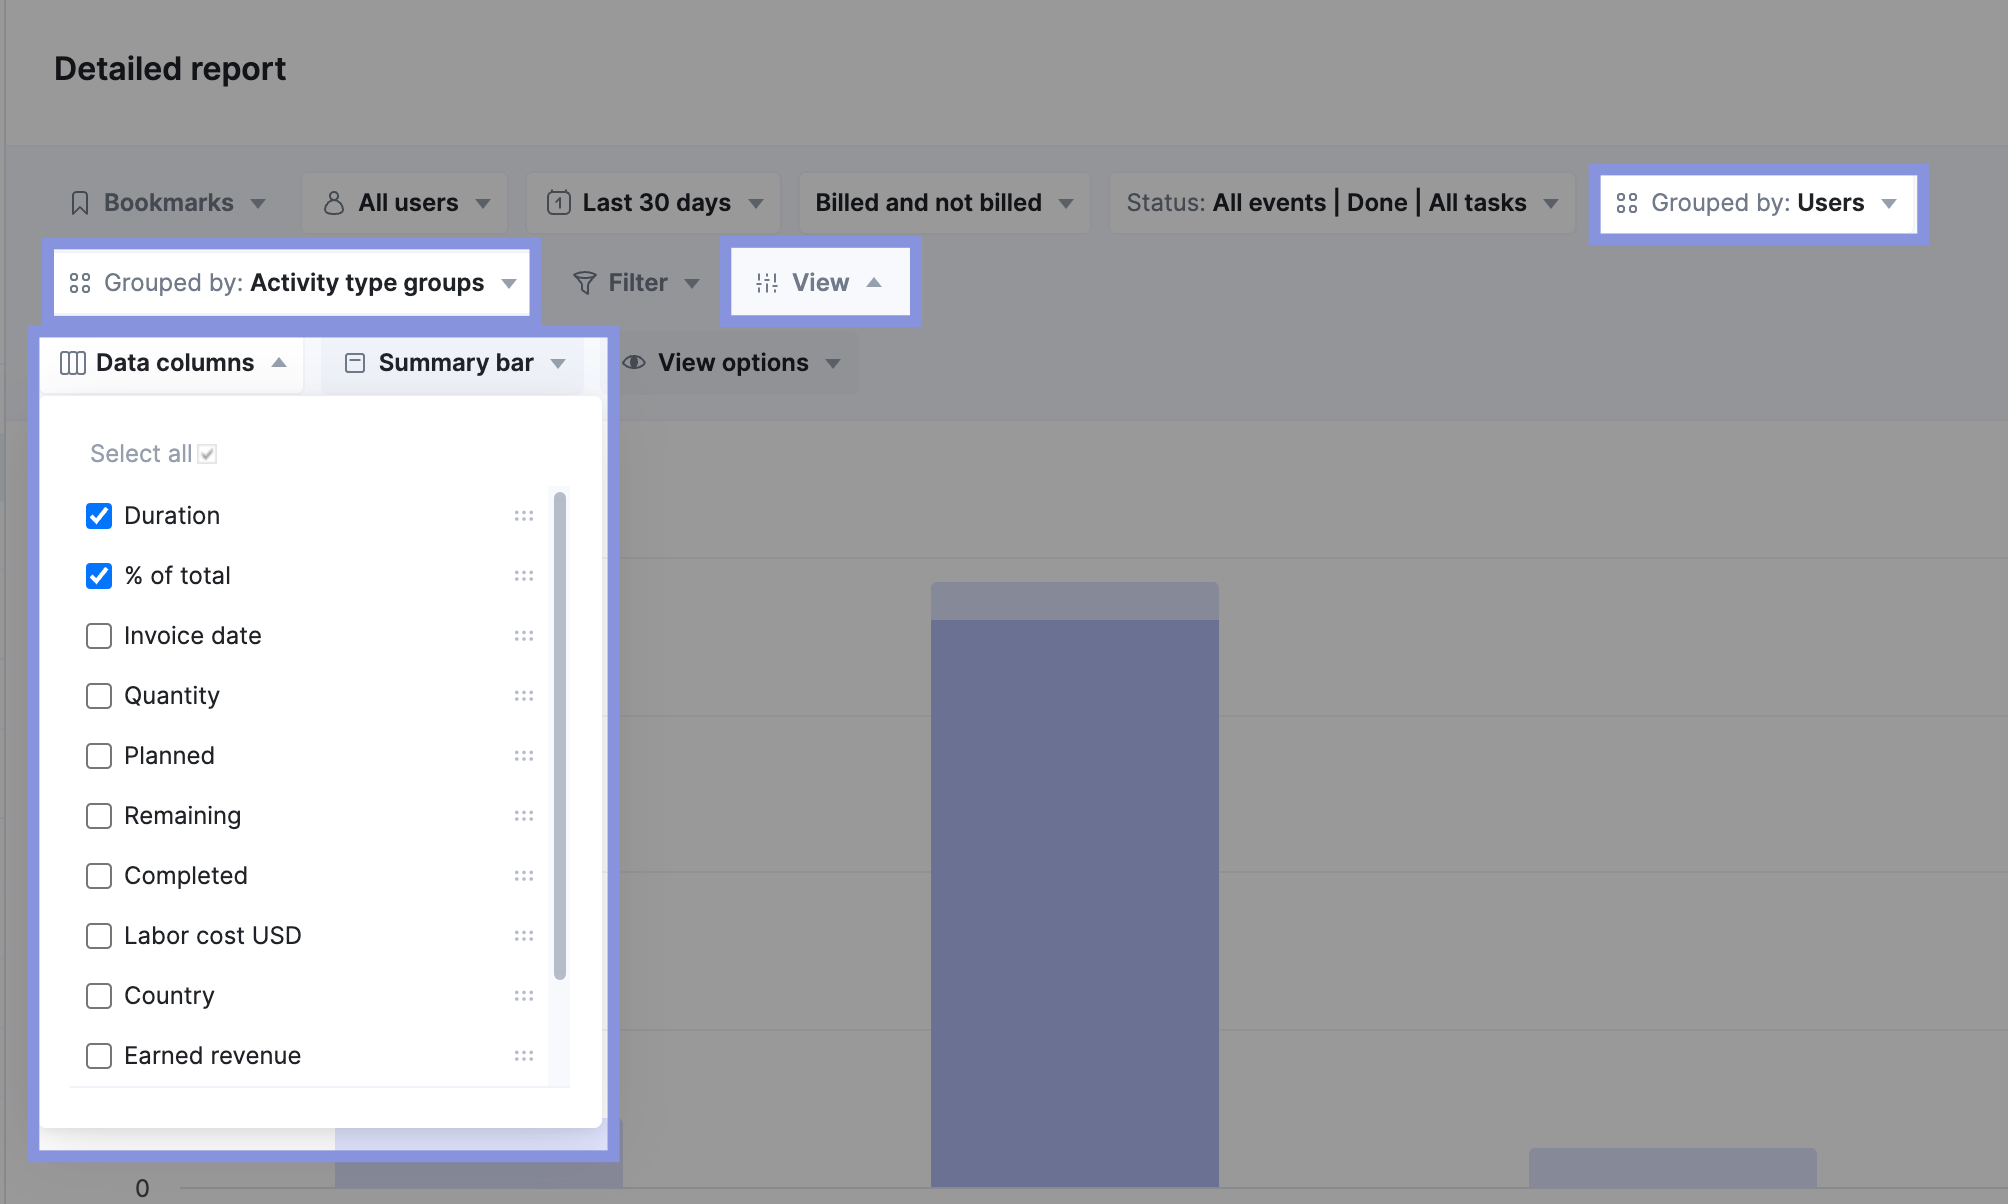
- Grouped by (1st): Select “Users”
- Grouped by (2nd): Select “Activity type groups”
- Data columns: Click “View” and check “% of total”
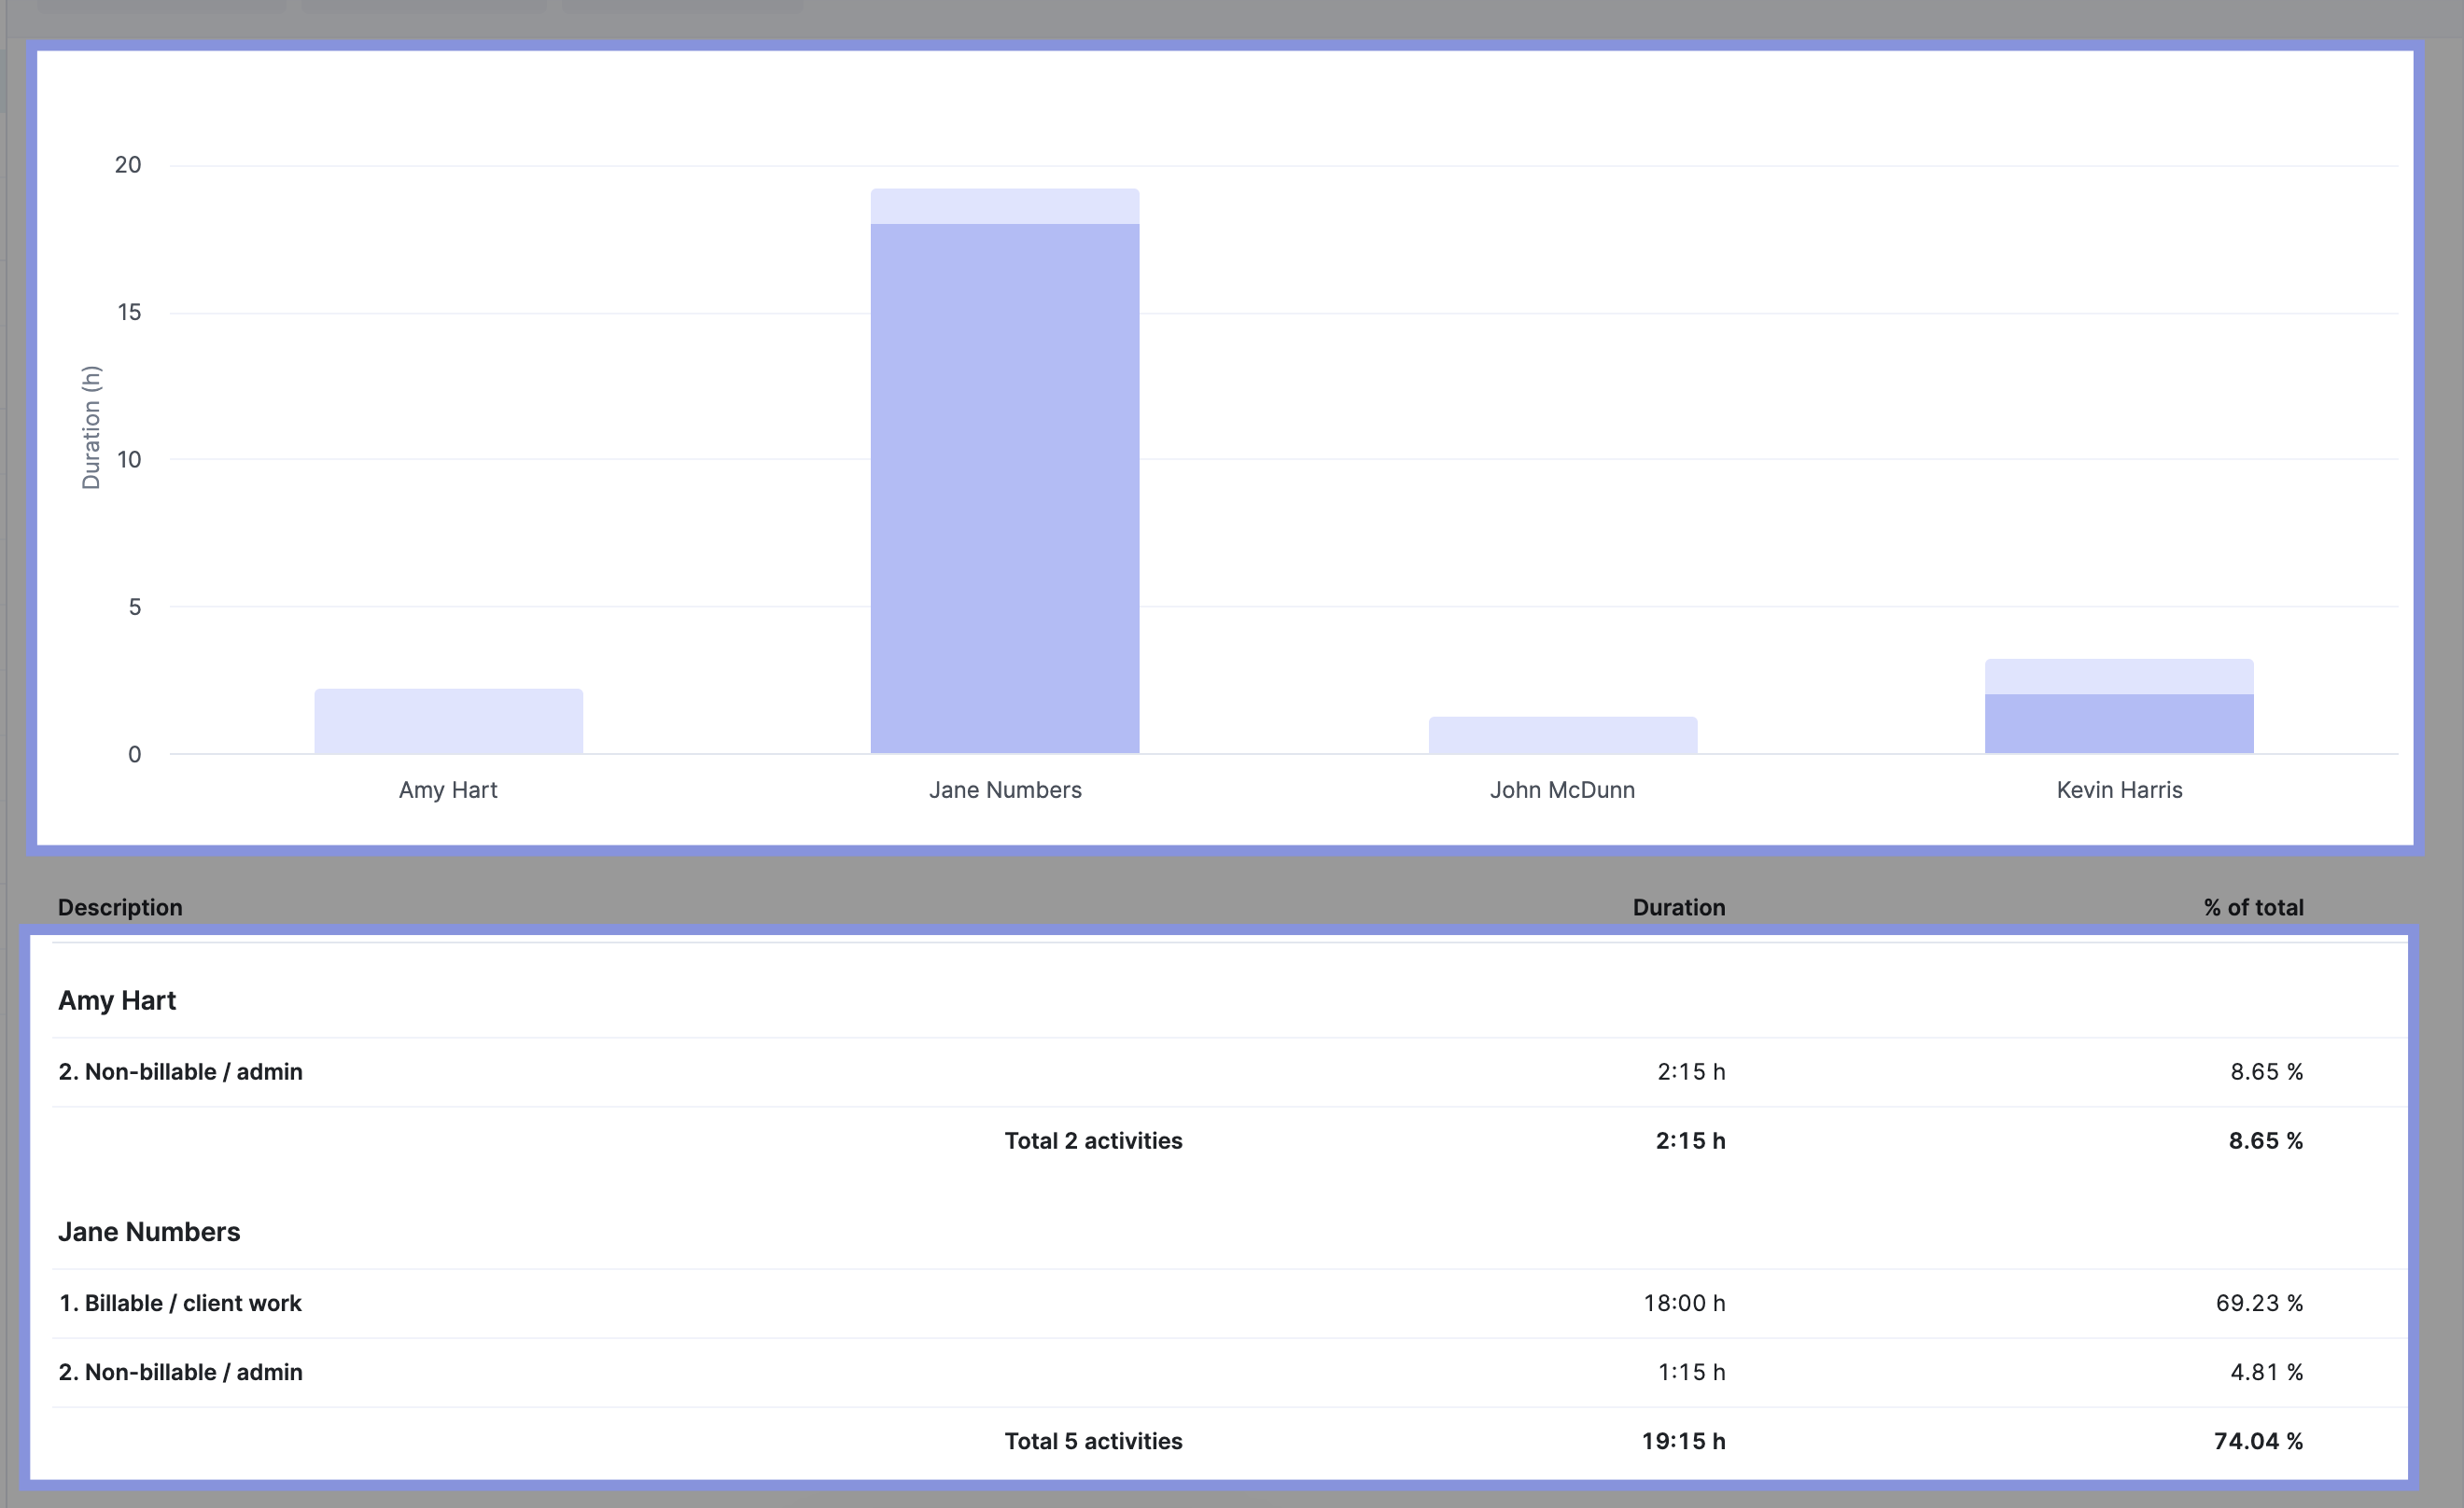
You’ll see a chart of all tracked billable and non-billable hours, broken down by team member.
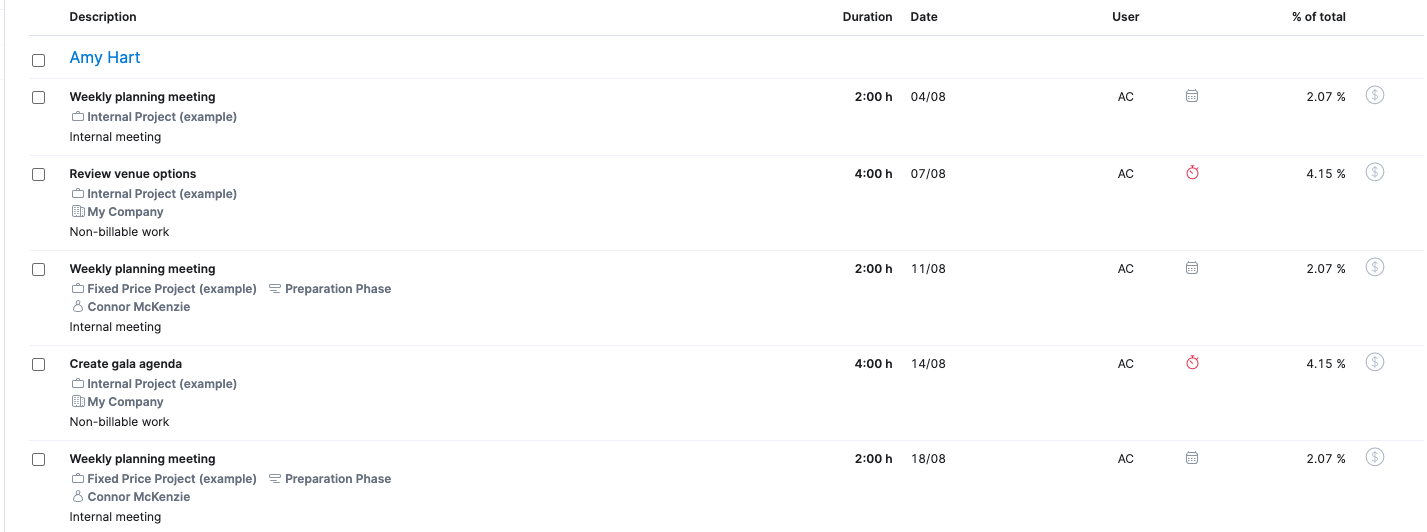
Now, click on “Non-billable / admin” (or your chosen category for non-billable time) under any team member’s name. This reveals a detailed breakdown of their non-billable tasks, showing you exactly how their time is spent – whether on vacation, in meetings, productive business development, or inefficient admin work.
This granular view helps you pinpoint areas for improvement. For example, if you see excessive time spent on low-value admin tasks, you can explore ways to automate or streamline those processes, freeing up your team’s time for billable work.

5. Forecast billable utilization using historical data
Analyzing your team’s booked time is crucial for accurate capacity planning and preventing overbooking.
Scoro’s “Utilization report,” accessible by clicking on the “Reports” module followed by “Utilization report,” provides a forecast based on both confirmed and tentative bookings, offering a comprehensive view of your team’s projected workload.
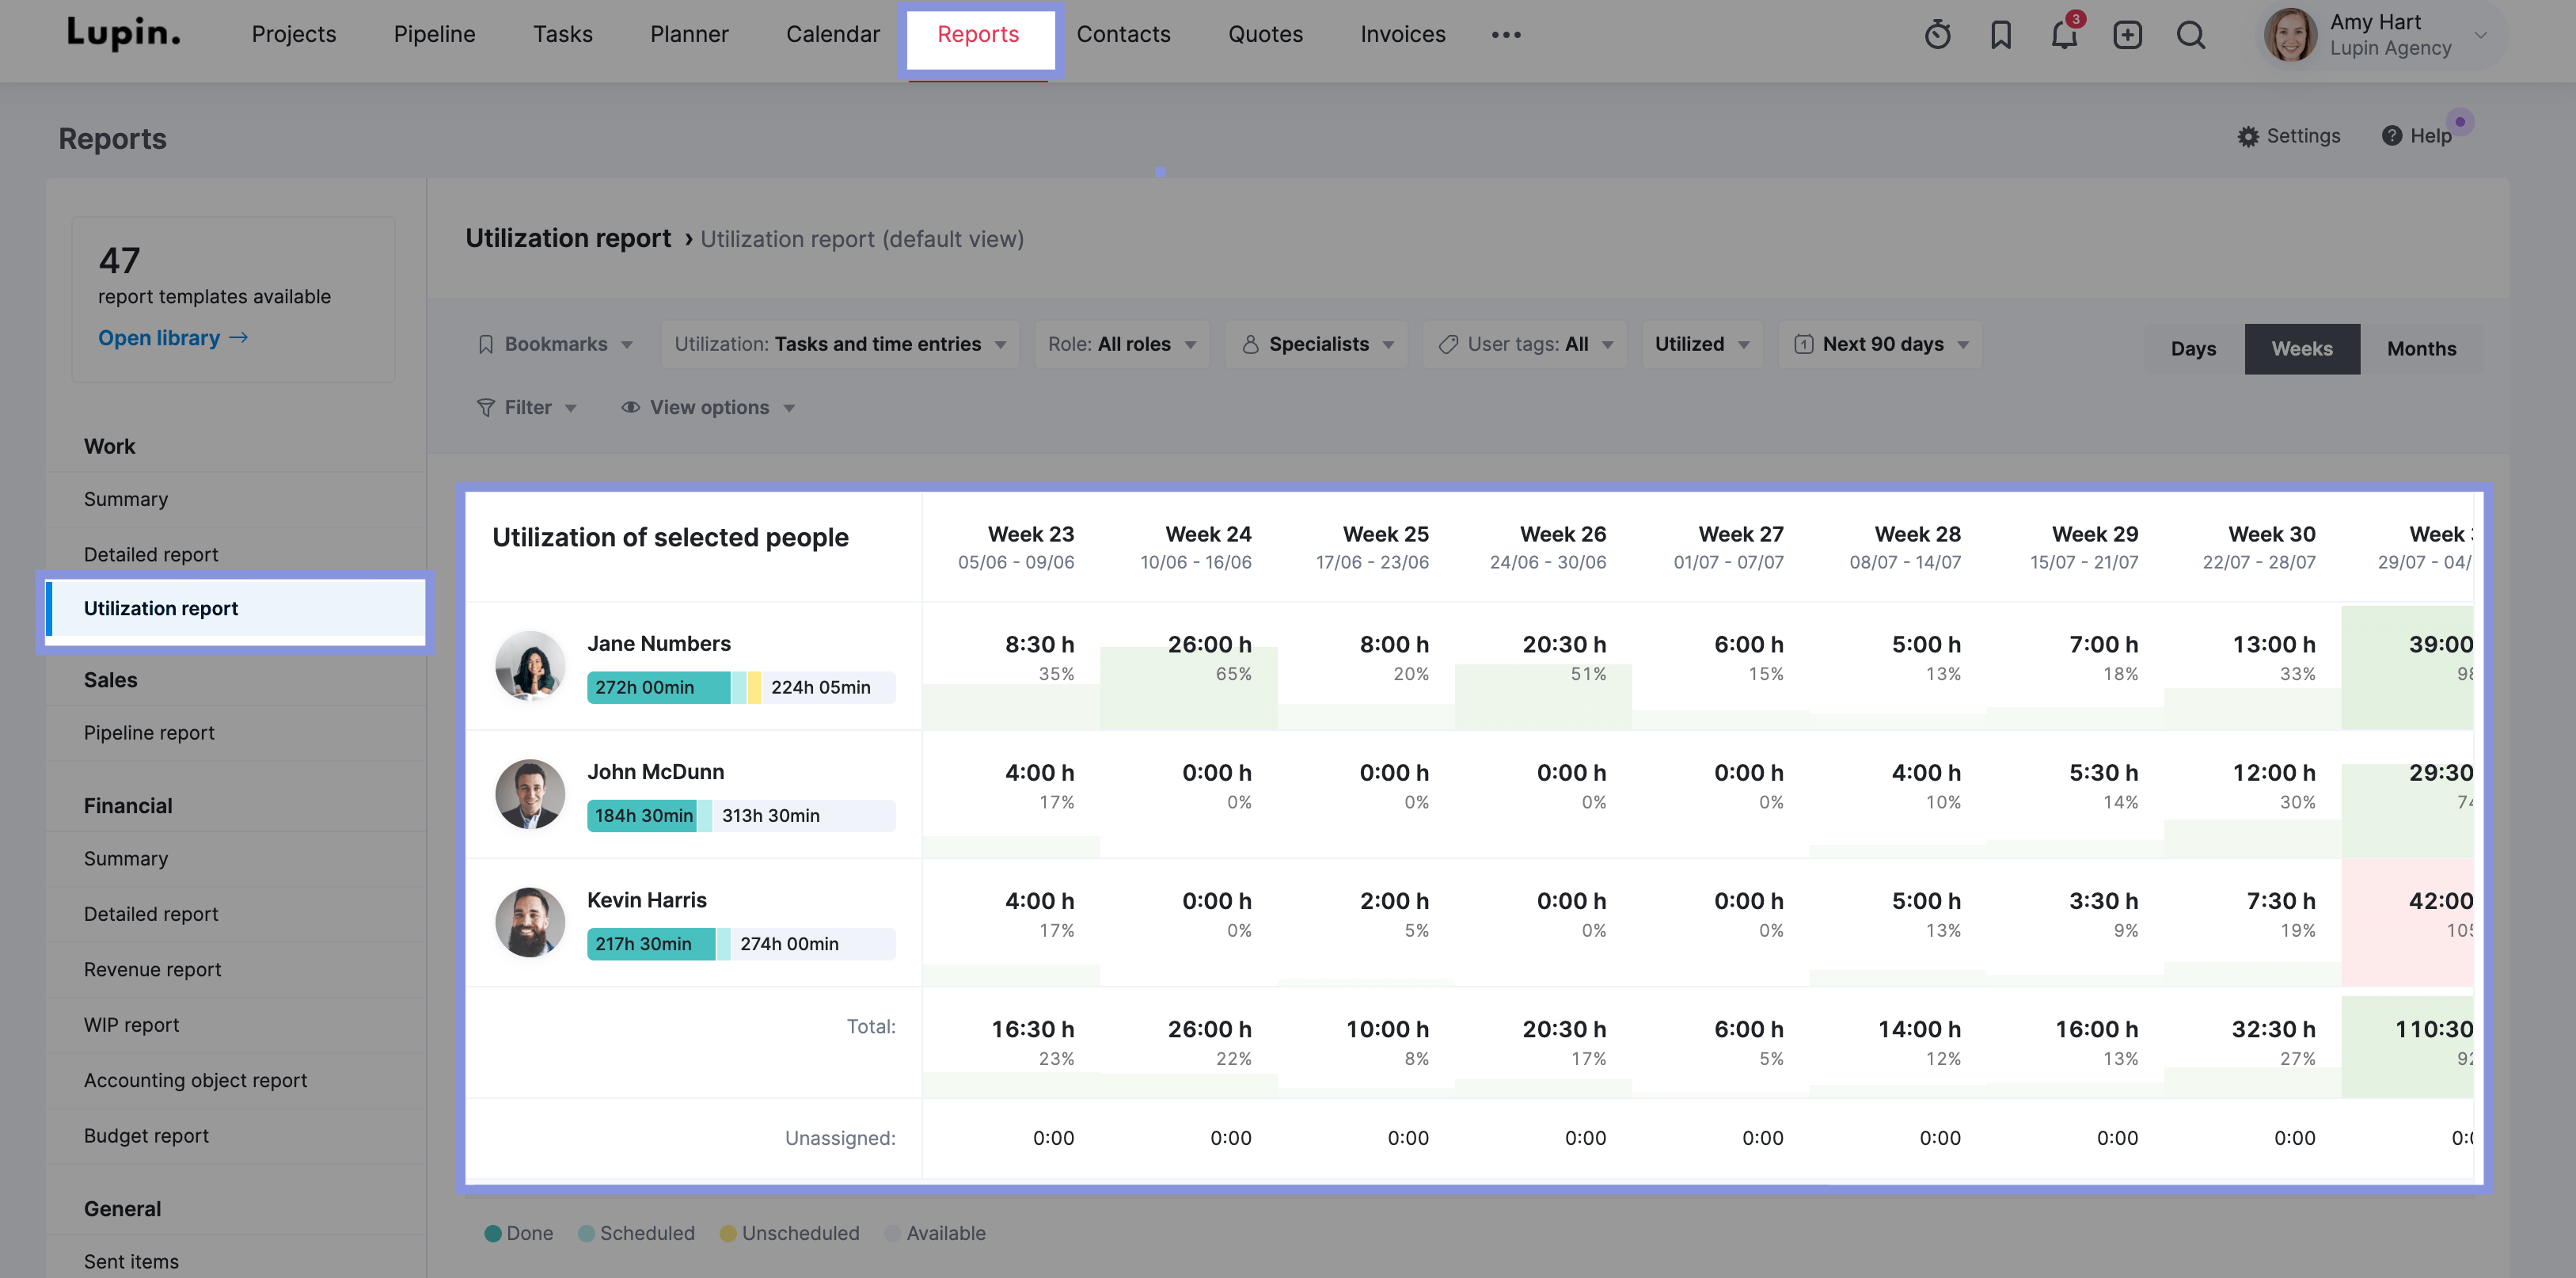
Make sure you have selected “All bookings” in the “Utilization” drop-down menu. This includes both confirmed and tentative bookings, providing a comprehensive view of your team’s projected workload.
Then, use the date picker to select a timeframe (such as “Next 90 days”) to analyze.
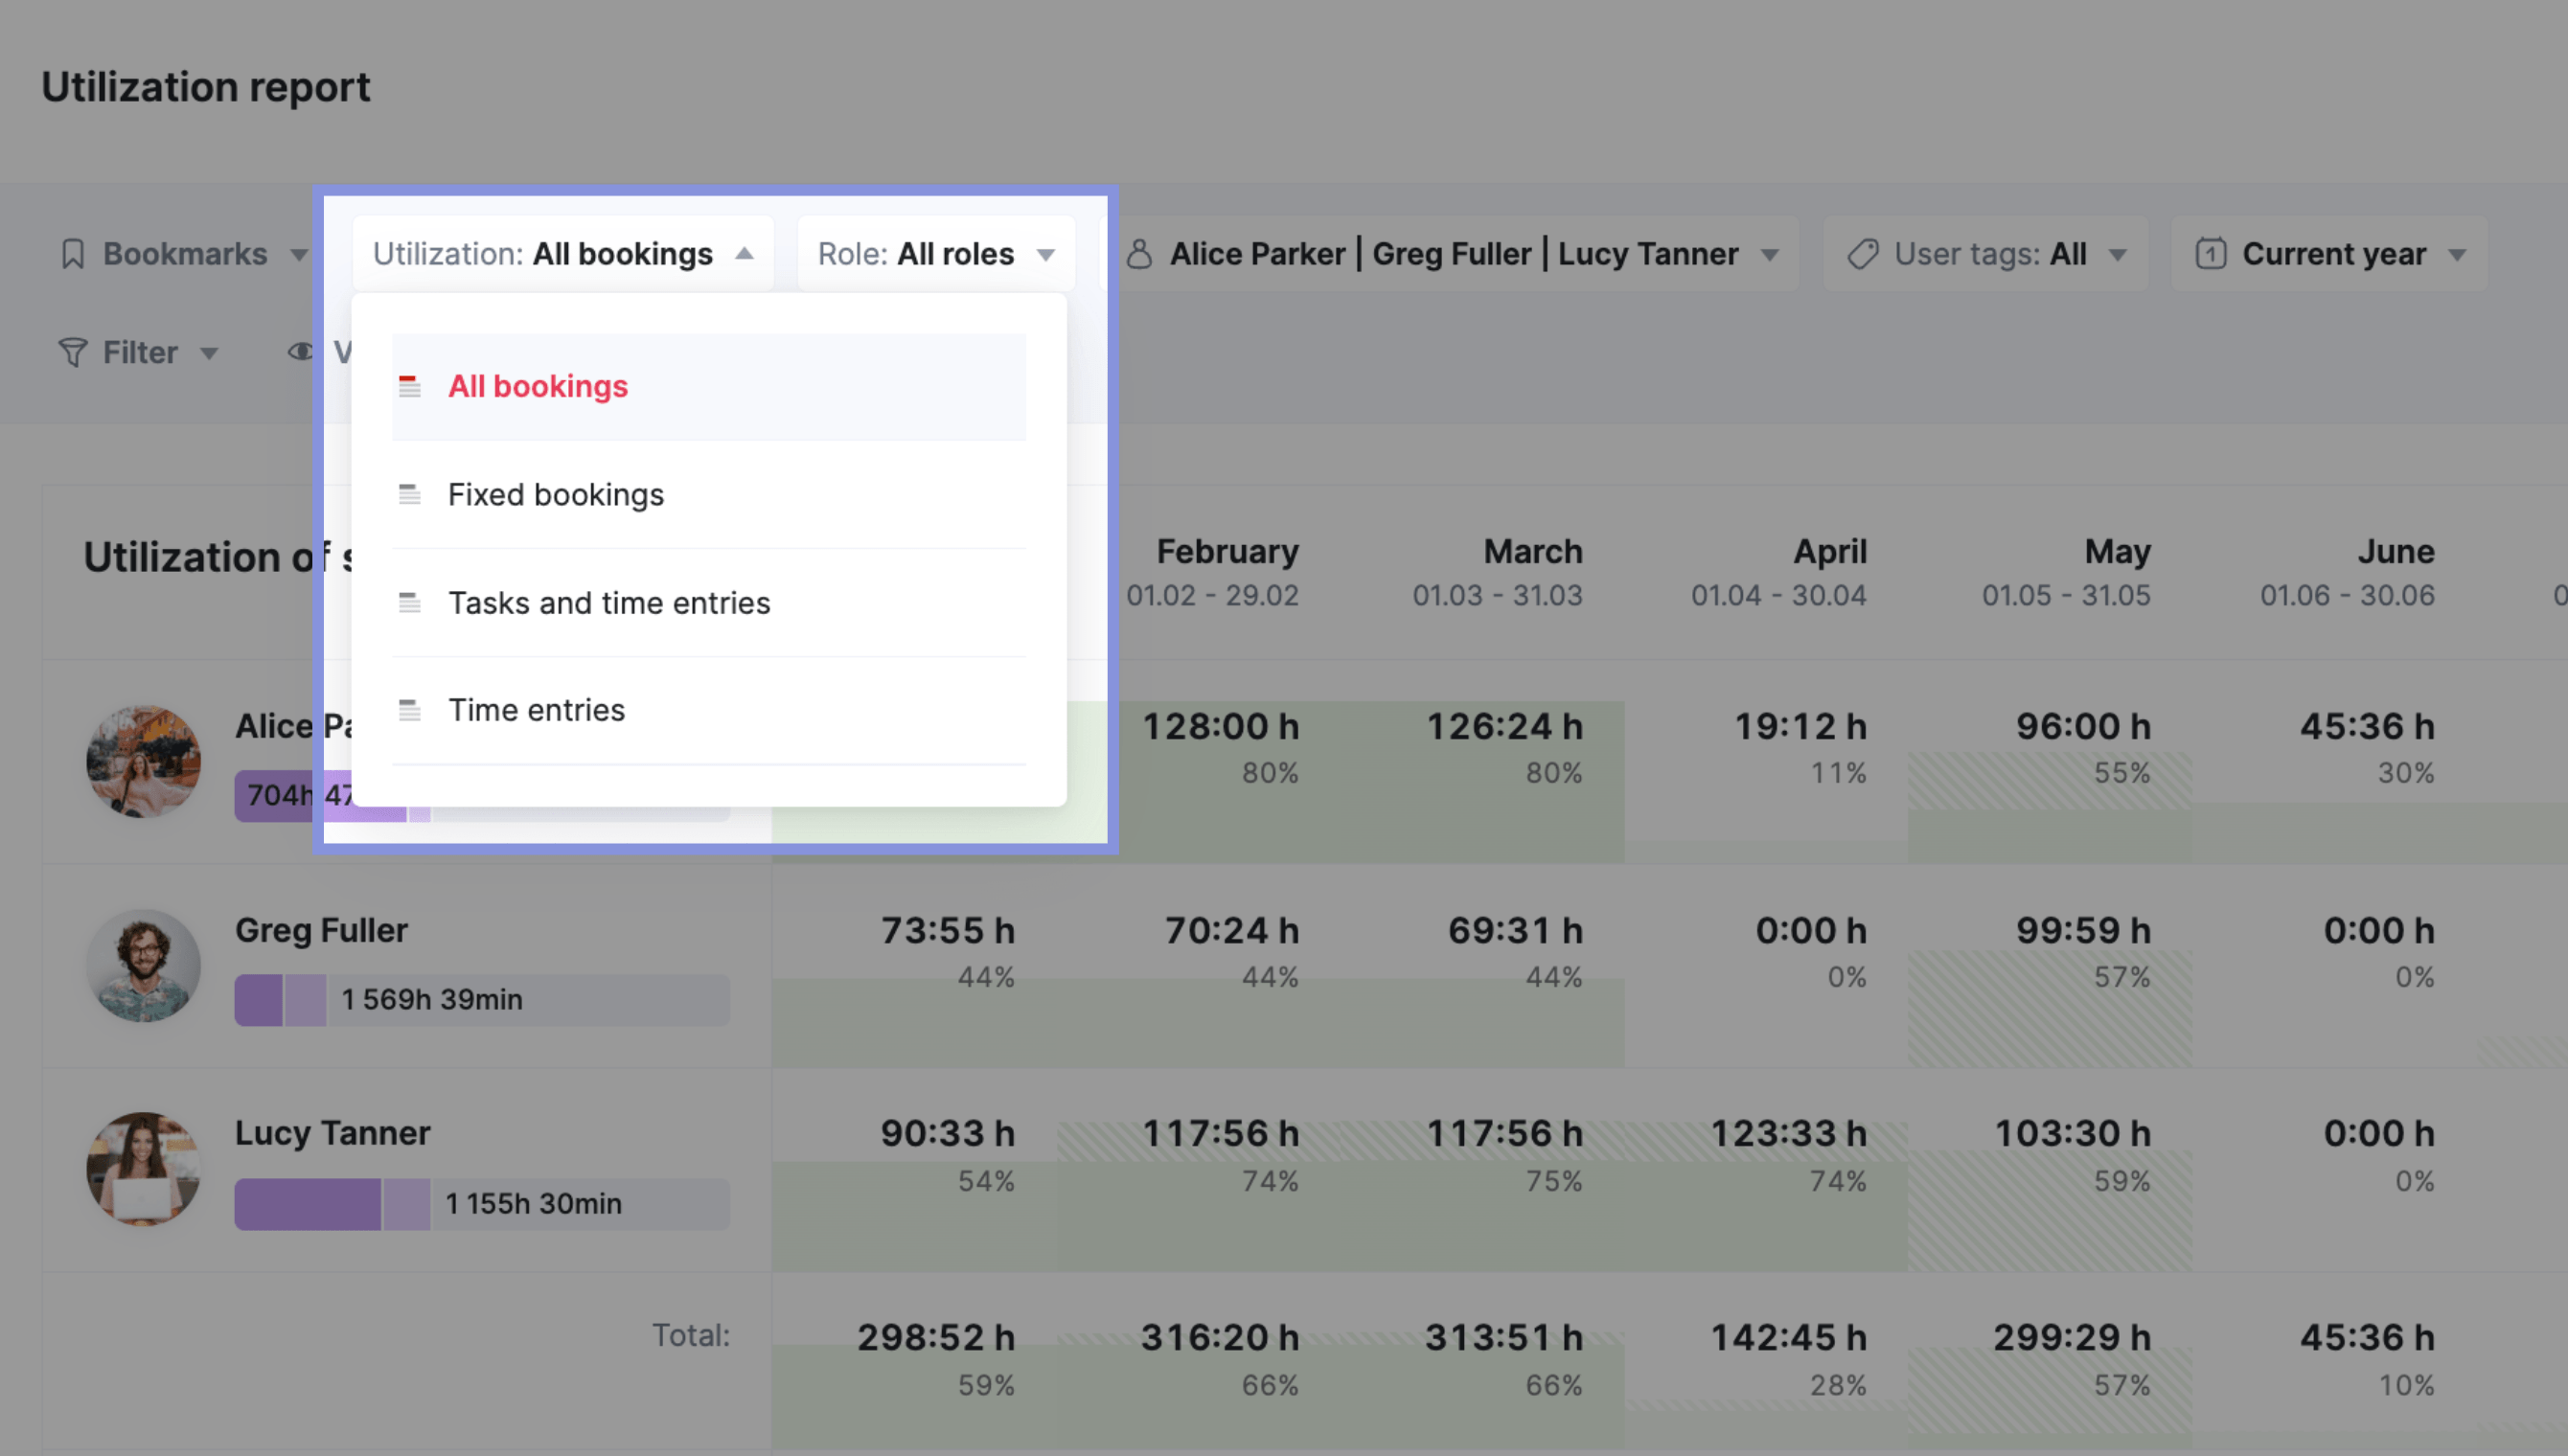
This will show you a prediction of each team member’s utilization level for the upcoming weeks.

Top Tip
Bookings in Scoro come into play in the early preparation phase of a project once you start assembling the project team. Bookings make it easy to reserve someone’s time for the project before any specific tasks are created.
Tips to improve billable utilization
Once you understand, benchmark, and monitor your billable utilization rates over time, it’s time to focus on improving those numbers to increase profitability.
Here’s how:
1. Make sure you have enough work
Problem: Billable utilization rates are low because there’s not enough work for your team’s capacity
Solution: Boost your sales pipeline to build out your team’s roster of projects
Not having enough work for your team results in low utilization. And less revenue and profits.
To fix this, actively monitor your organization’s sales pipeline. This way, you can find opportunities to help ramp up sales and take advantage of your team’s availability.
Head to the sales “Pipeline” view in Scoro. Here, you can see the number of active quotes and where each deal is in the sales process.
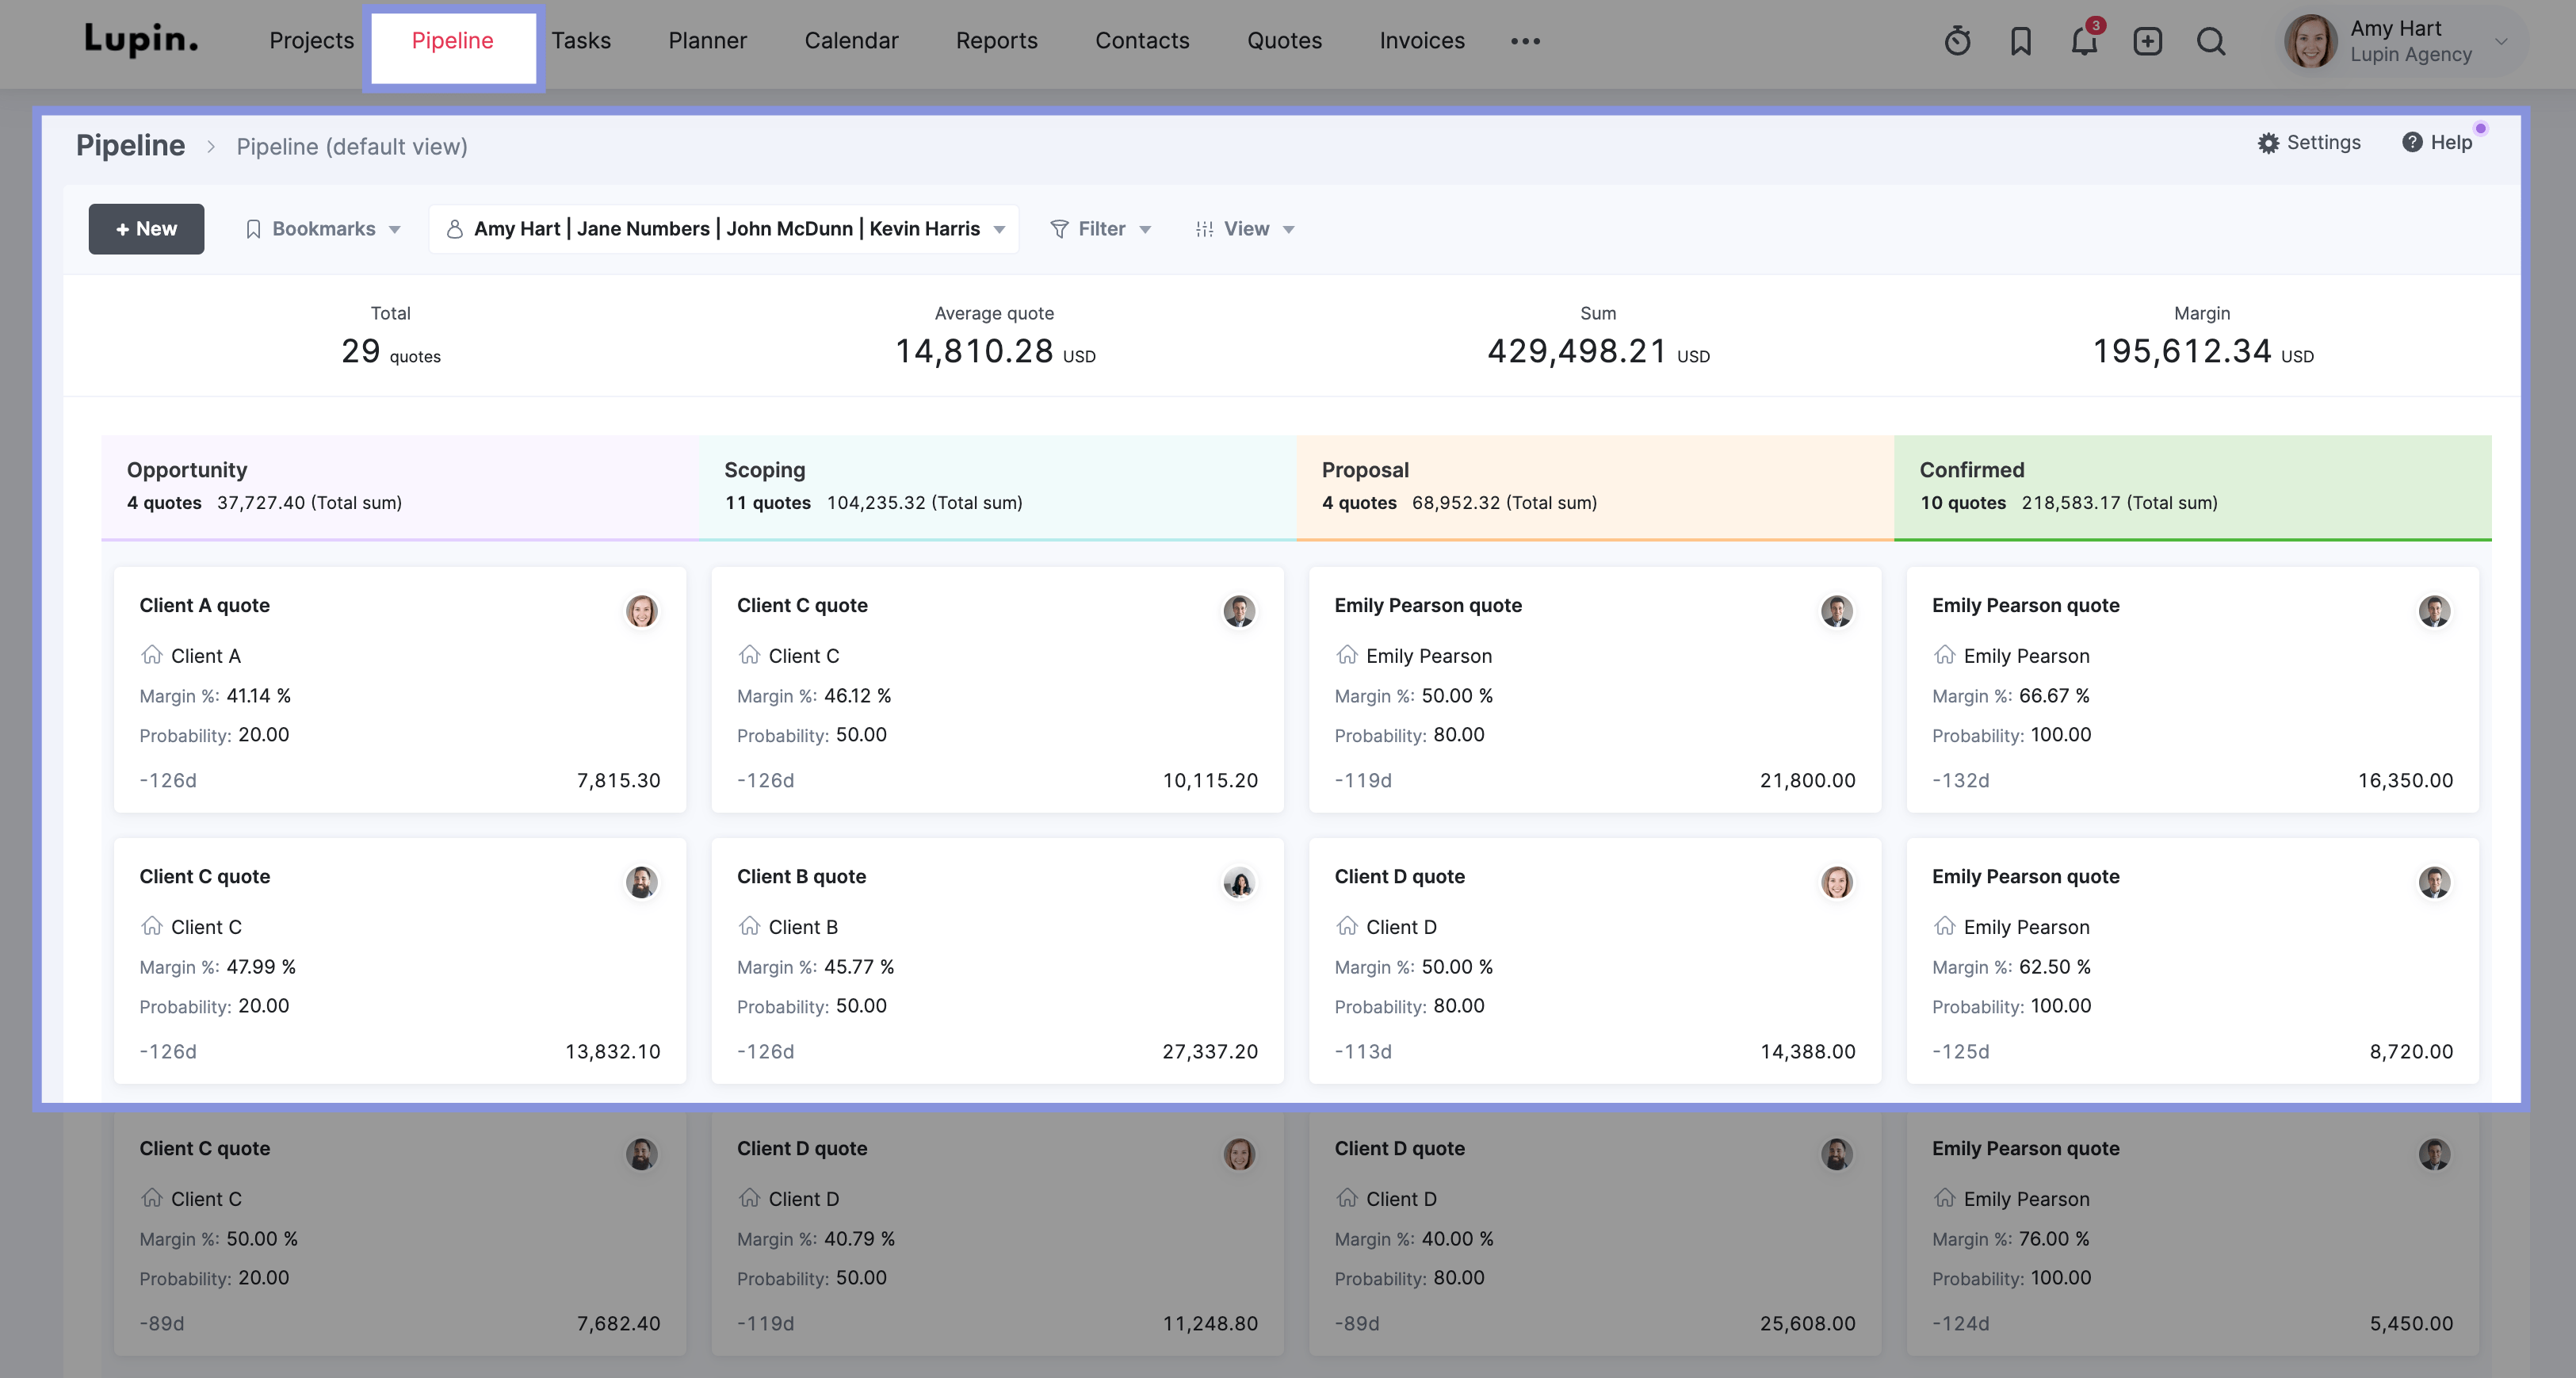
Click “View” and then “Summary bar” to select the high-level data that is most useful for analyzing your pipeline health. Like:
- The average quote amount
- The margin of all quotes combined
- The average margin across quotes
- The average age of each quote
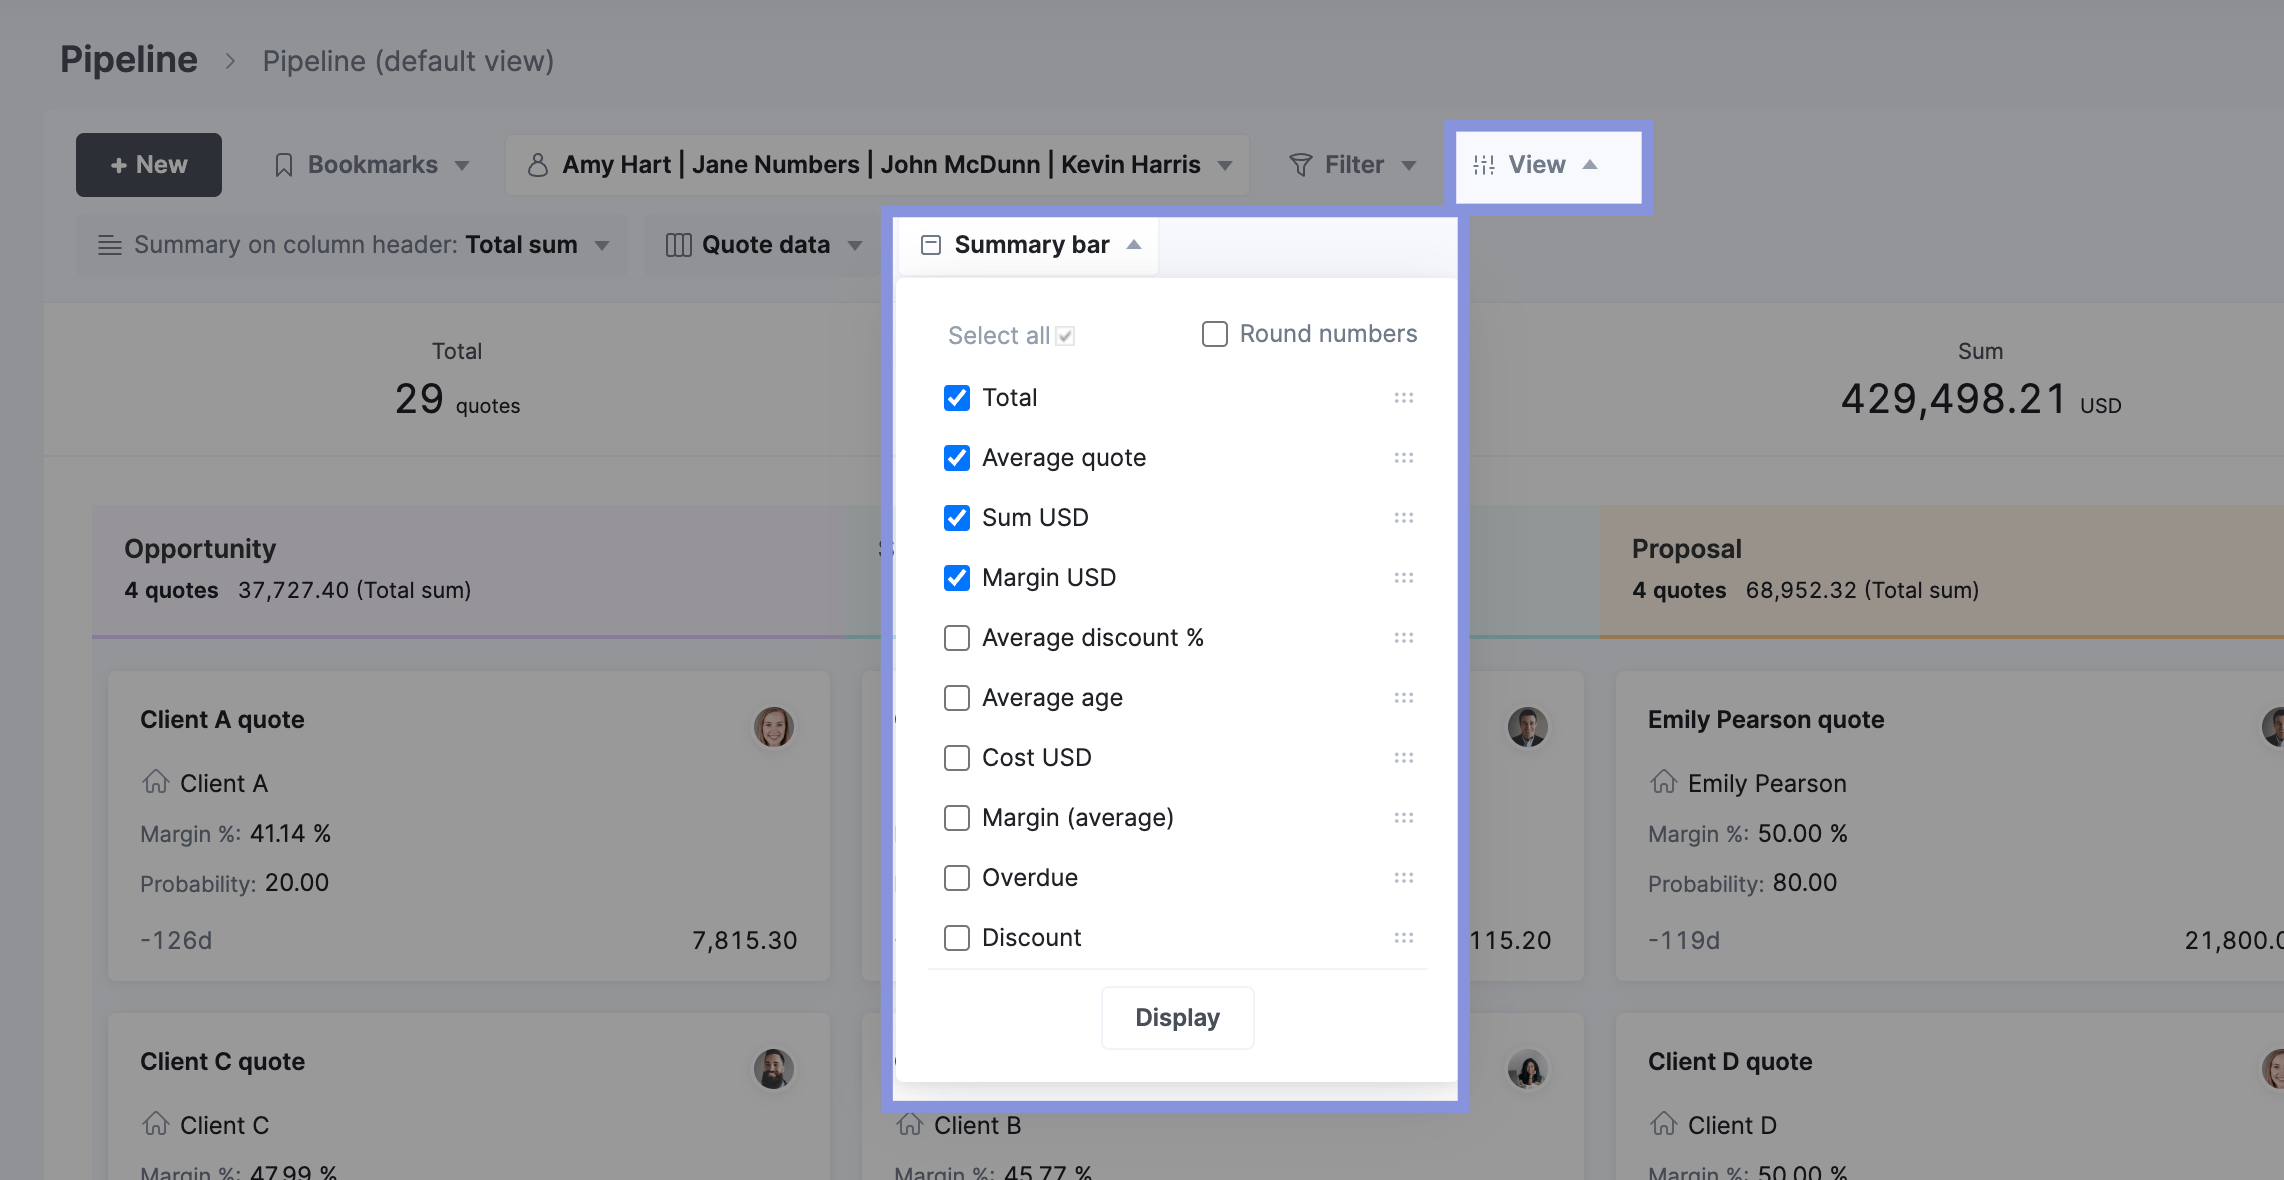
Keeping this high-level data in the summary bar can give you valuable insight into the value and timeline of your sales process. This allows you to make smarter decisions about the number of quotes you need to send to generate the appropriate amount of work.

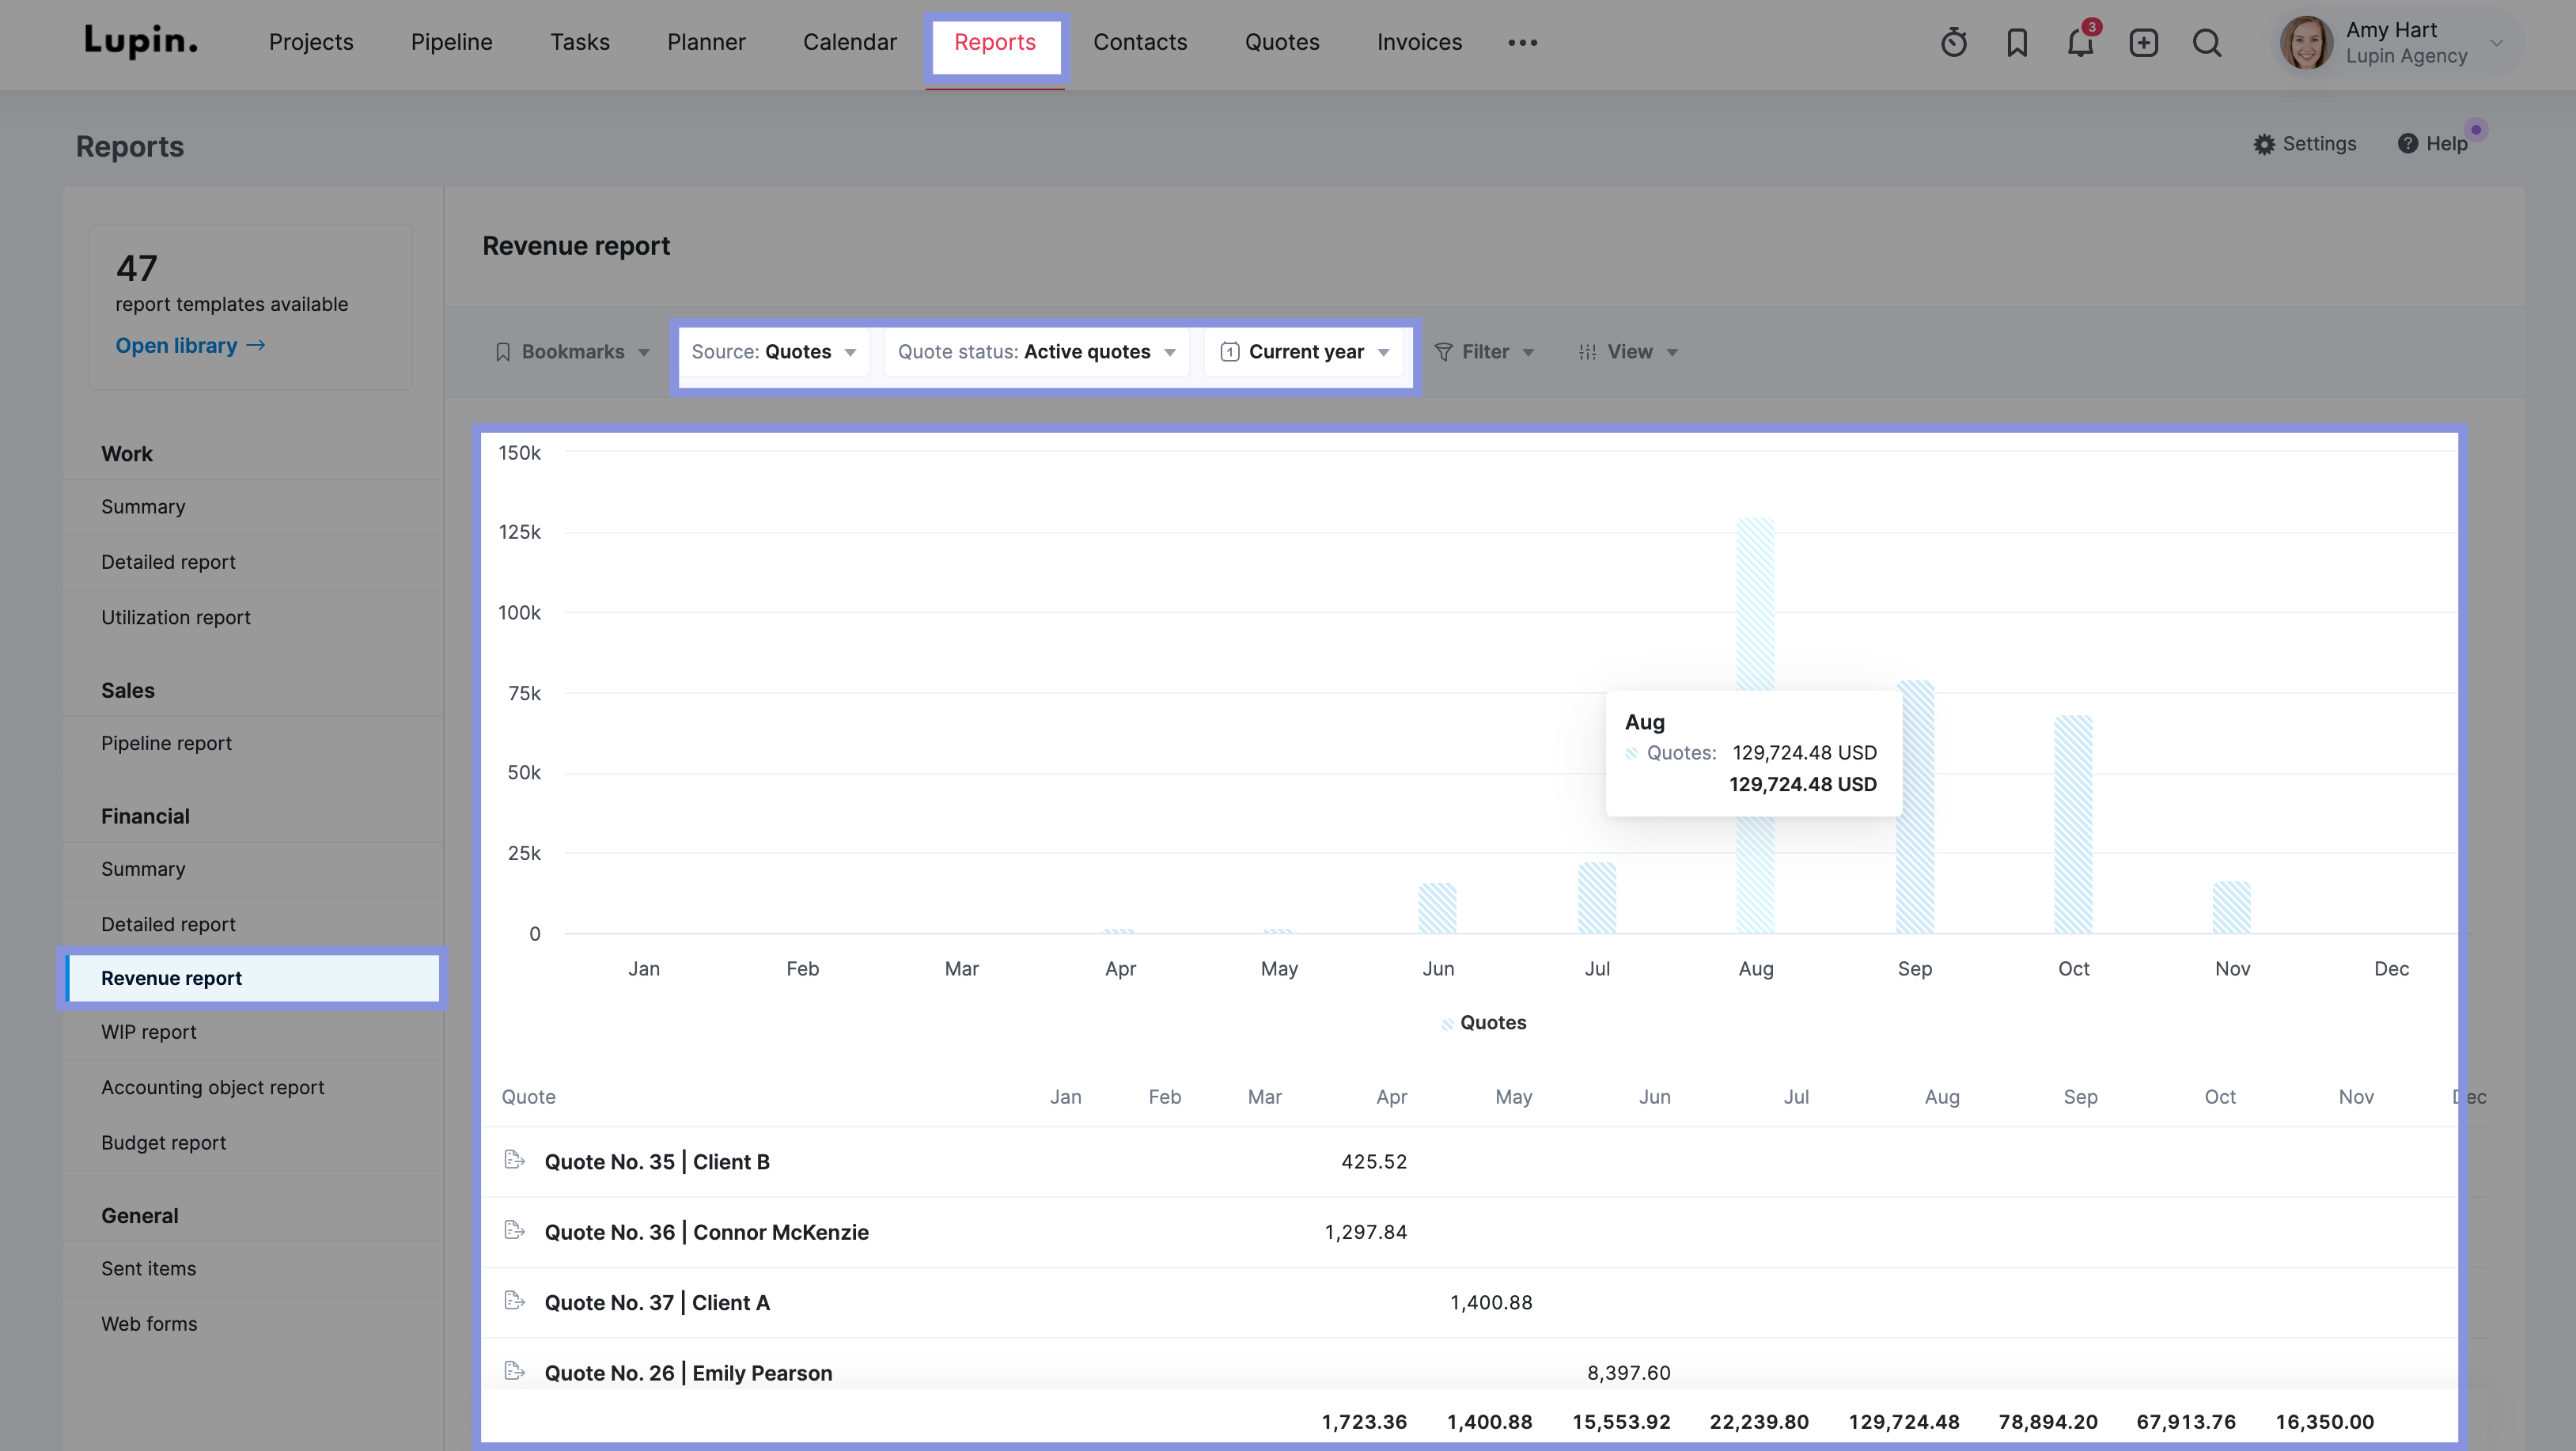
You can also use the “Revenue report” to spot future slumps or spikes in your potential revenue. This gives you a heads up on when your team members might need more time or external support to complete high-priority billable work. And when it makes more sense to add more projects to the queue.
Go to “Reports.” Then, select “Revenue.”
Then, set the following filters:
- Set “Source” to “Quotes”
- Set “Quote status” to “Active quotes”
- Set the “Date range” to the future time period you’re analyzing
2. Set clear productivity expectations and billable utilization targets
Problem: You’re the only one focusing on billable utilization.
Solution: Set clear target utilization rates.
Improving billable utilization rates is a team effort. Everyone, from core contributors to managers and executive teams, needs to be on board.
For example, a 75% annual utilization target is a good goal for individual contributors, but how does that break down on a daily or weekly level, considering holidays, vacations, sick leave, and so on?
Setting a clear target for your team, such as “Spend no more than 1 hour per day on non-billable work,” is a much easier goal to track and measure. This can help you hit your overall utilization targets.
3. Assign the right people to projects
Problem: Your billable utilization rates are all over the place—with some team members overworked and some underutilized
Solution: Match your project requirements to the strengths of your available resources to optimize efficiency, quality, and utilization.
When setting up new projects and assigning tasks, assign the right people to the right projects.
Consider skills, experience, and upcoming availability to ensure adequate utilization while maximizing efficiency.
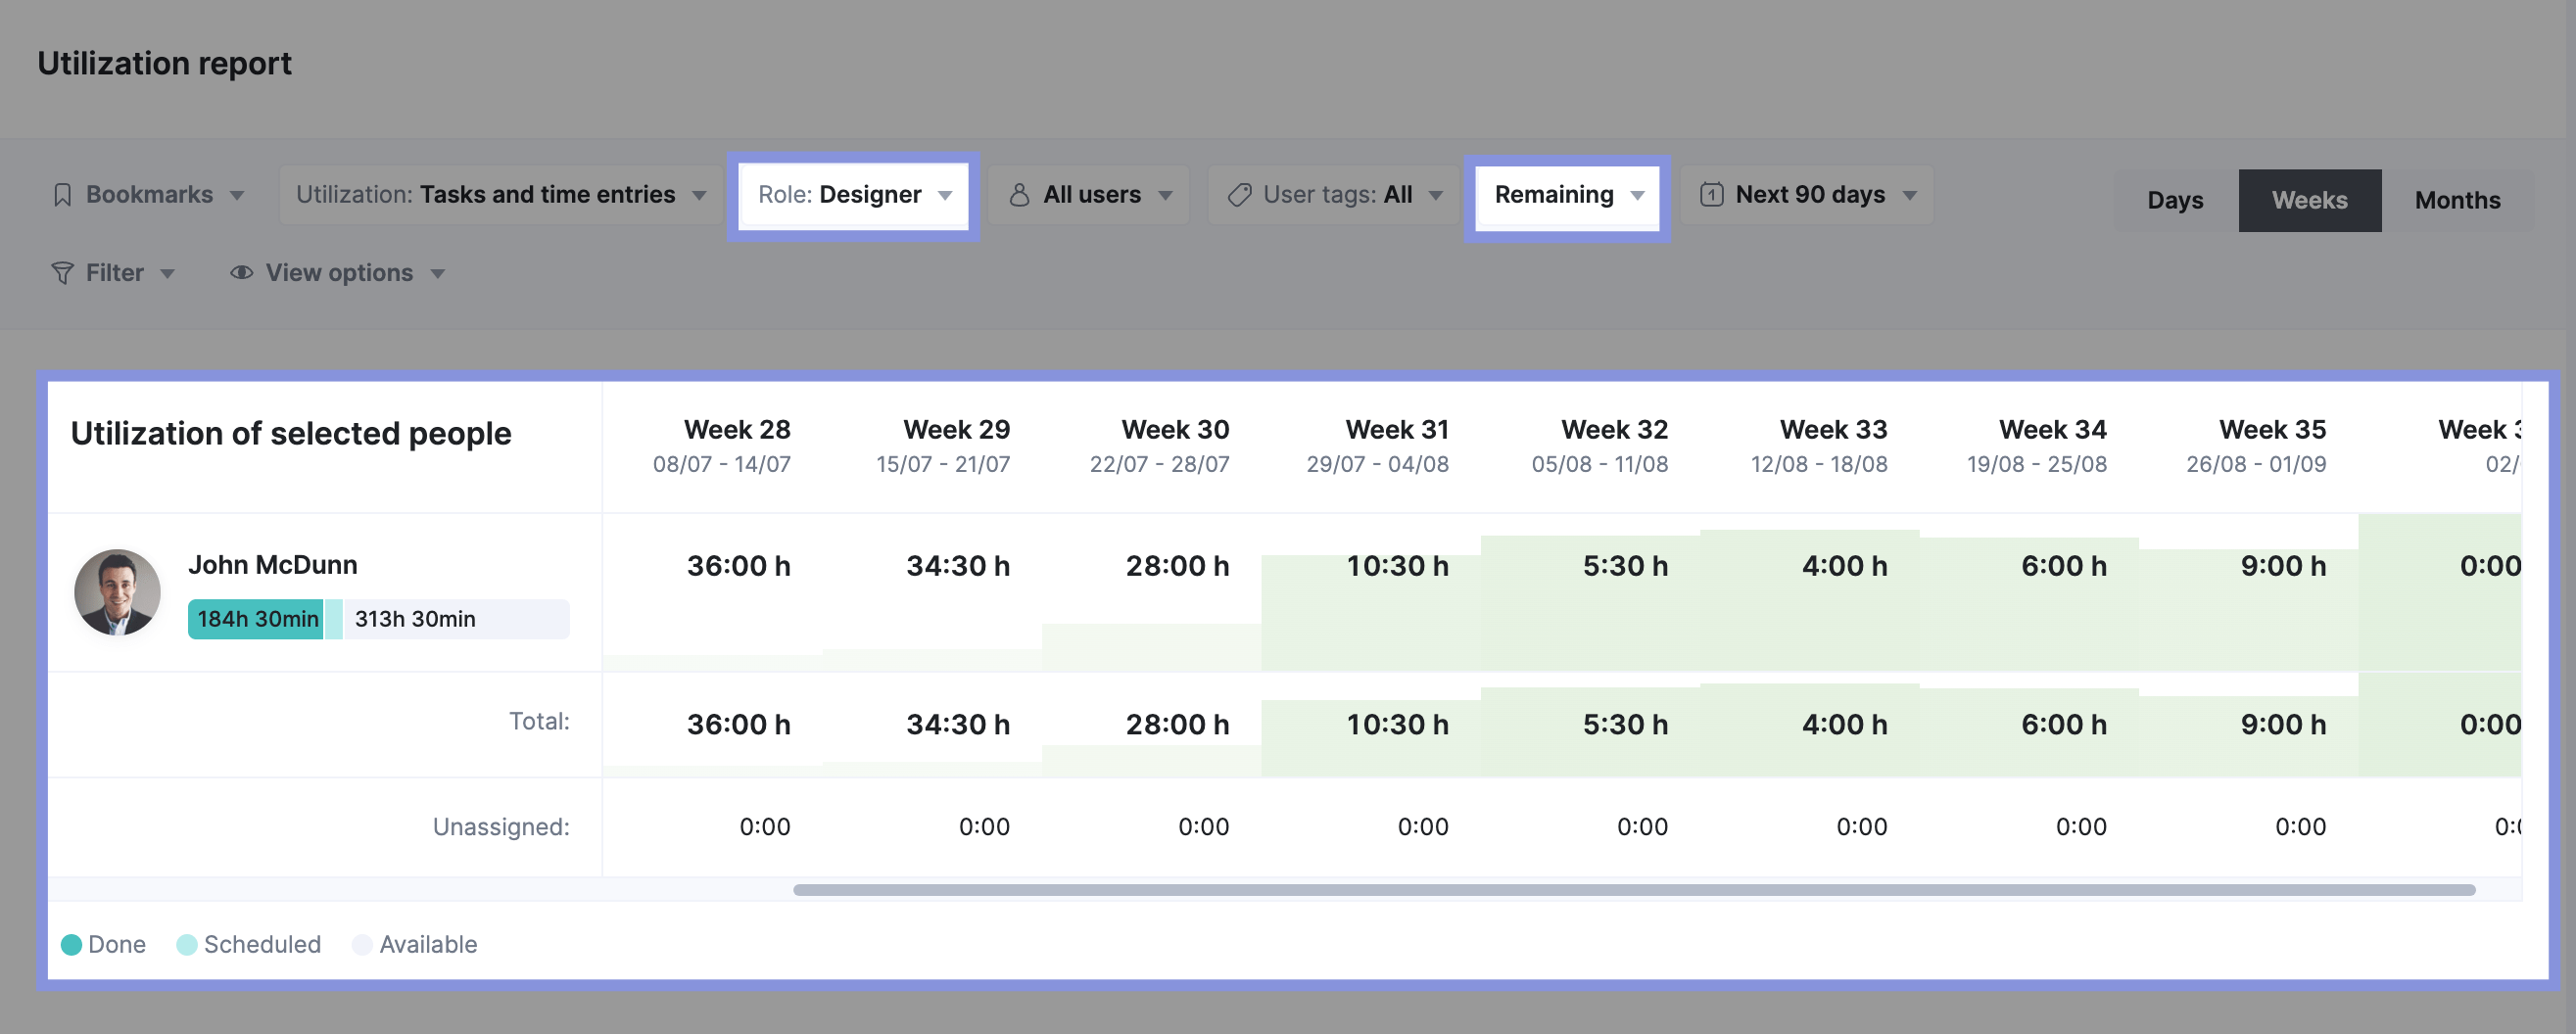
In Scoro, you can easily view team members’ availability by role. Simply select a specific role from the “Role” drop-down menu in the “Utilization report” and click “Utilized” > “Remaining” to see upcoming availability in hours.
4. Automate tasks and workflows
Problem: Your team is spending too much time on non-billable work
Solution: Identify repetitive, time-consuming tasks that can be automated to free up more time for billable work
Some non-billable work is inevitable. However, you should regularly monitor your team’s non-billable time and tasks to identify inefficiencies and streamline workflows.
One way to make your team more efficient is to use triggers and actions within Scoro to automate repetitive processes and workflows, such as notifying team members of task progress or changes.
To set up a trigger, go to “Settings” -> “My Settings” -> “Triggers and Actions.”
Then, click “+New” to design your new trigger. Or start with one of Scoro’s pre-made templates.
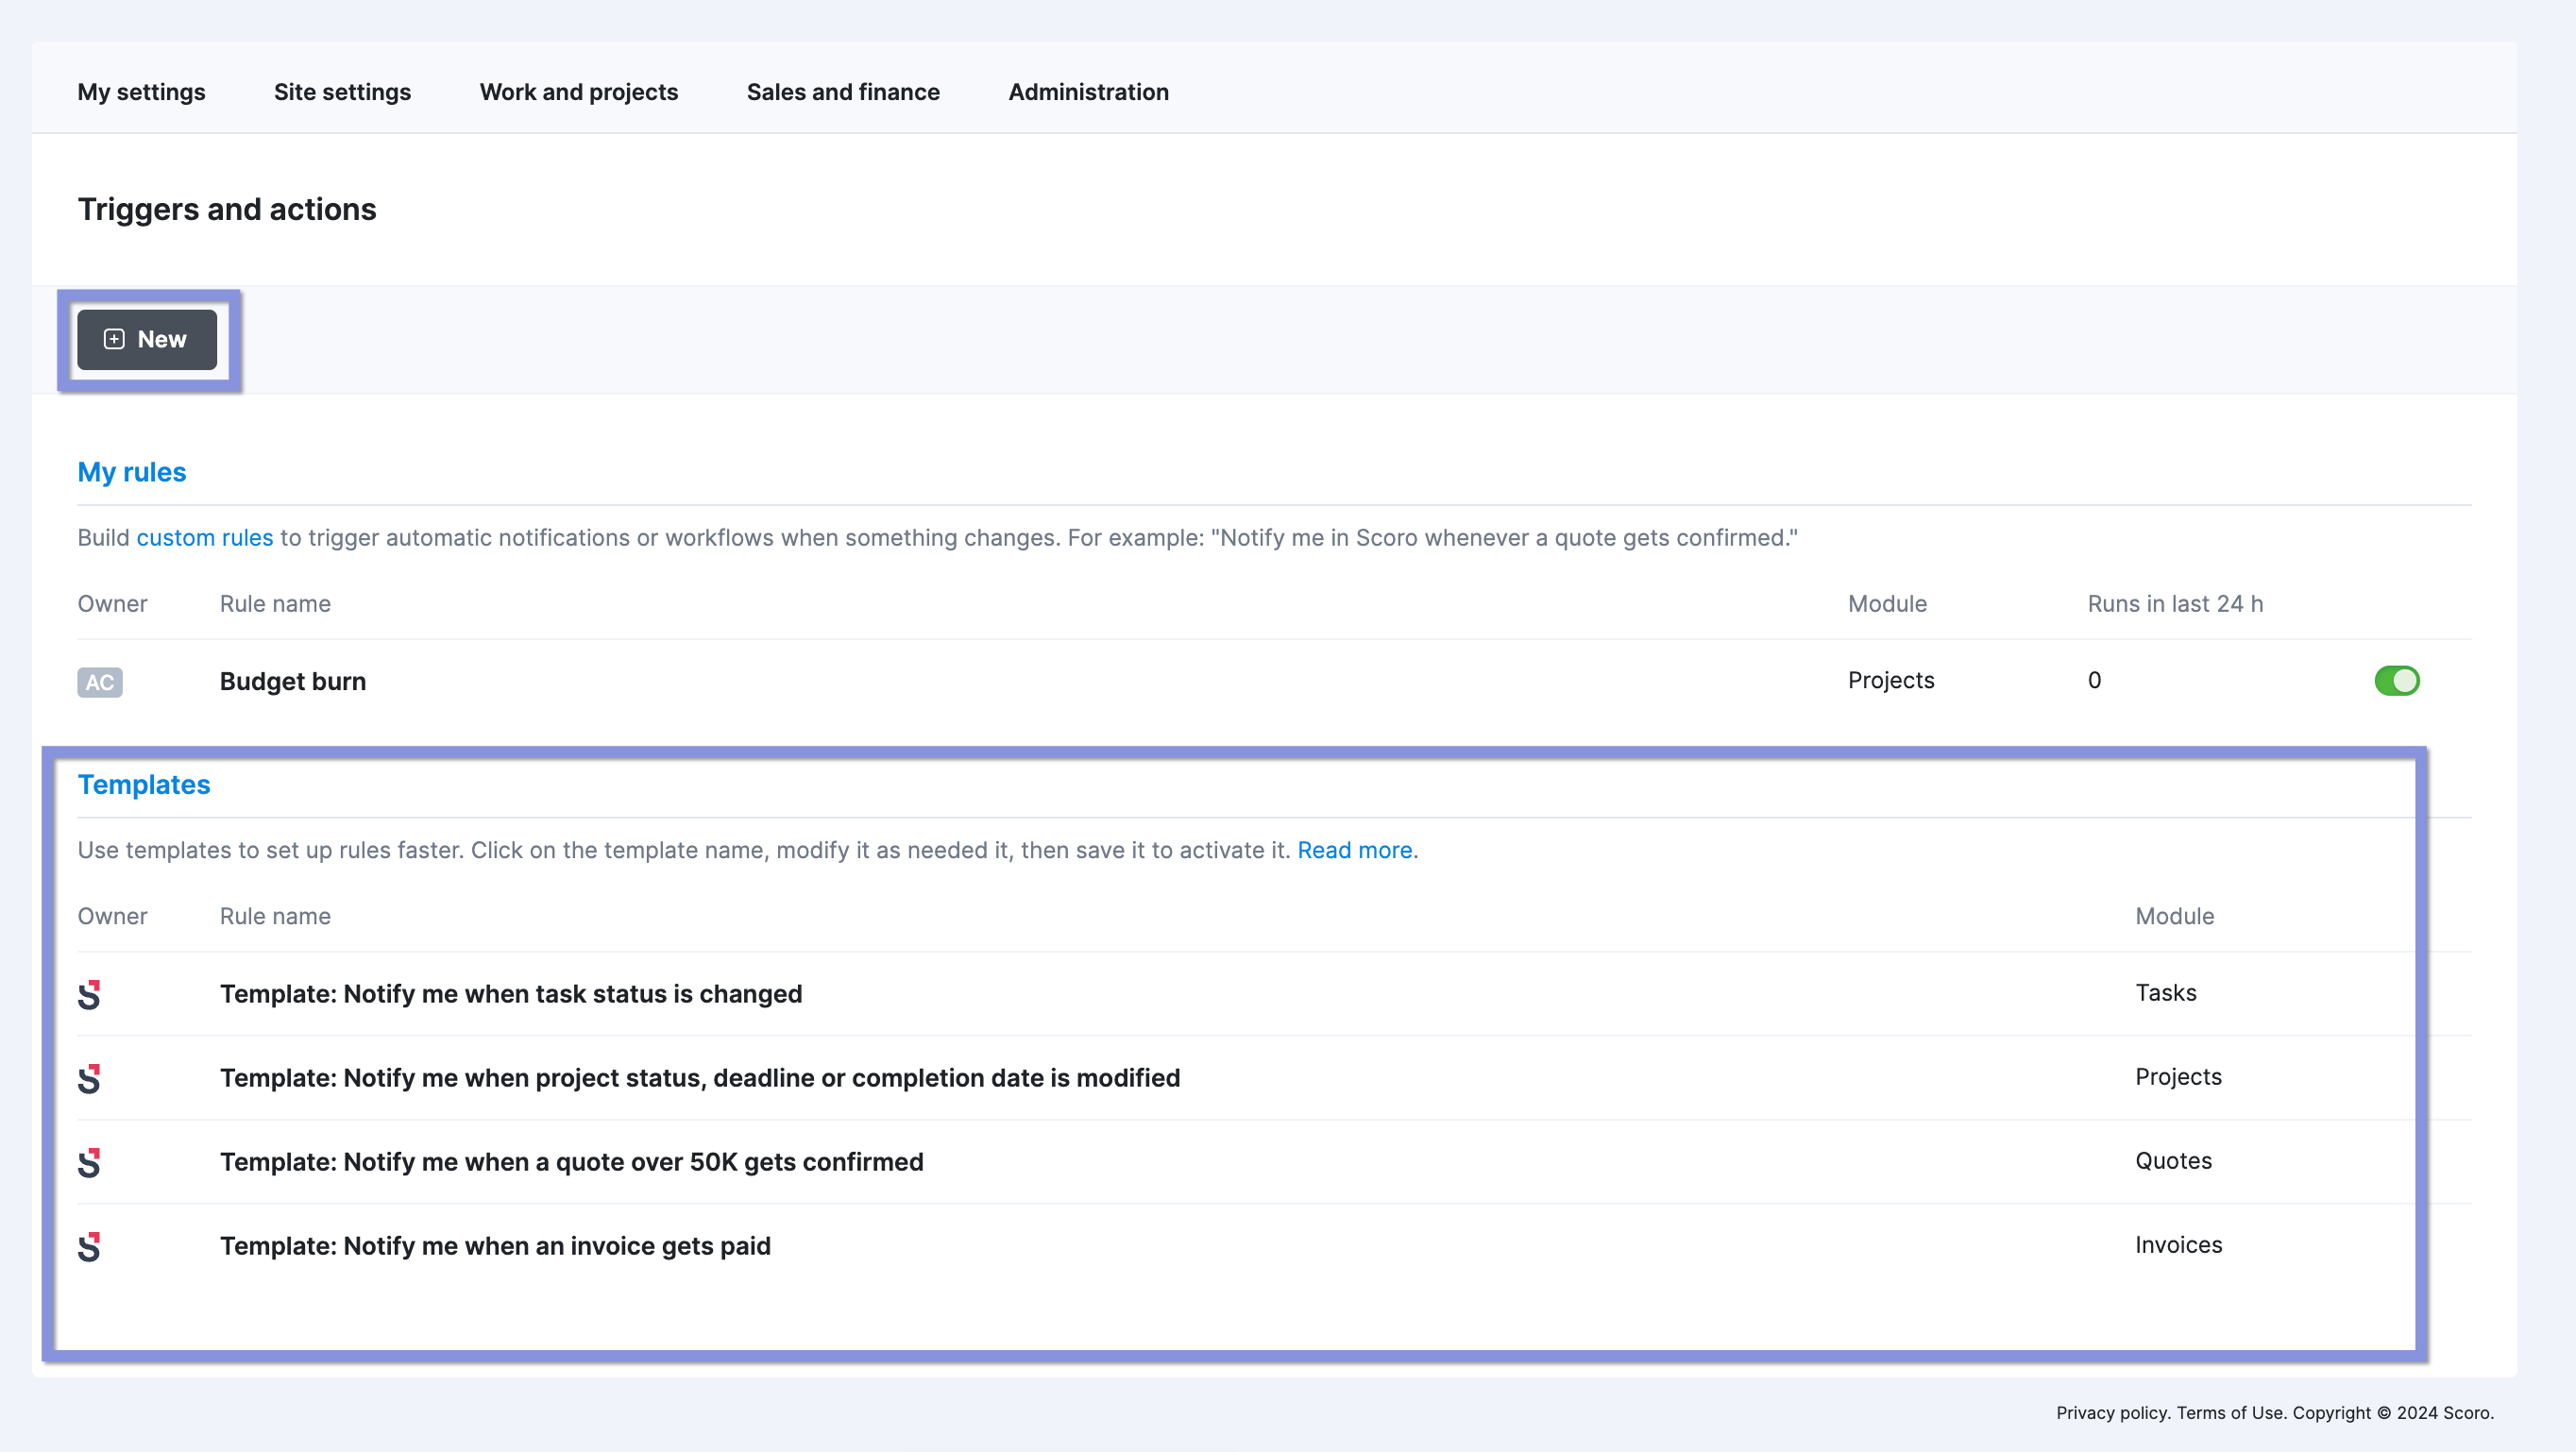
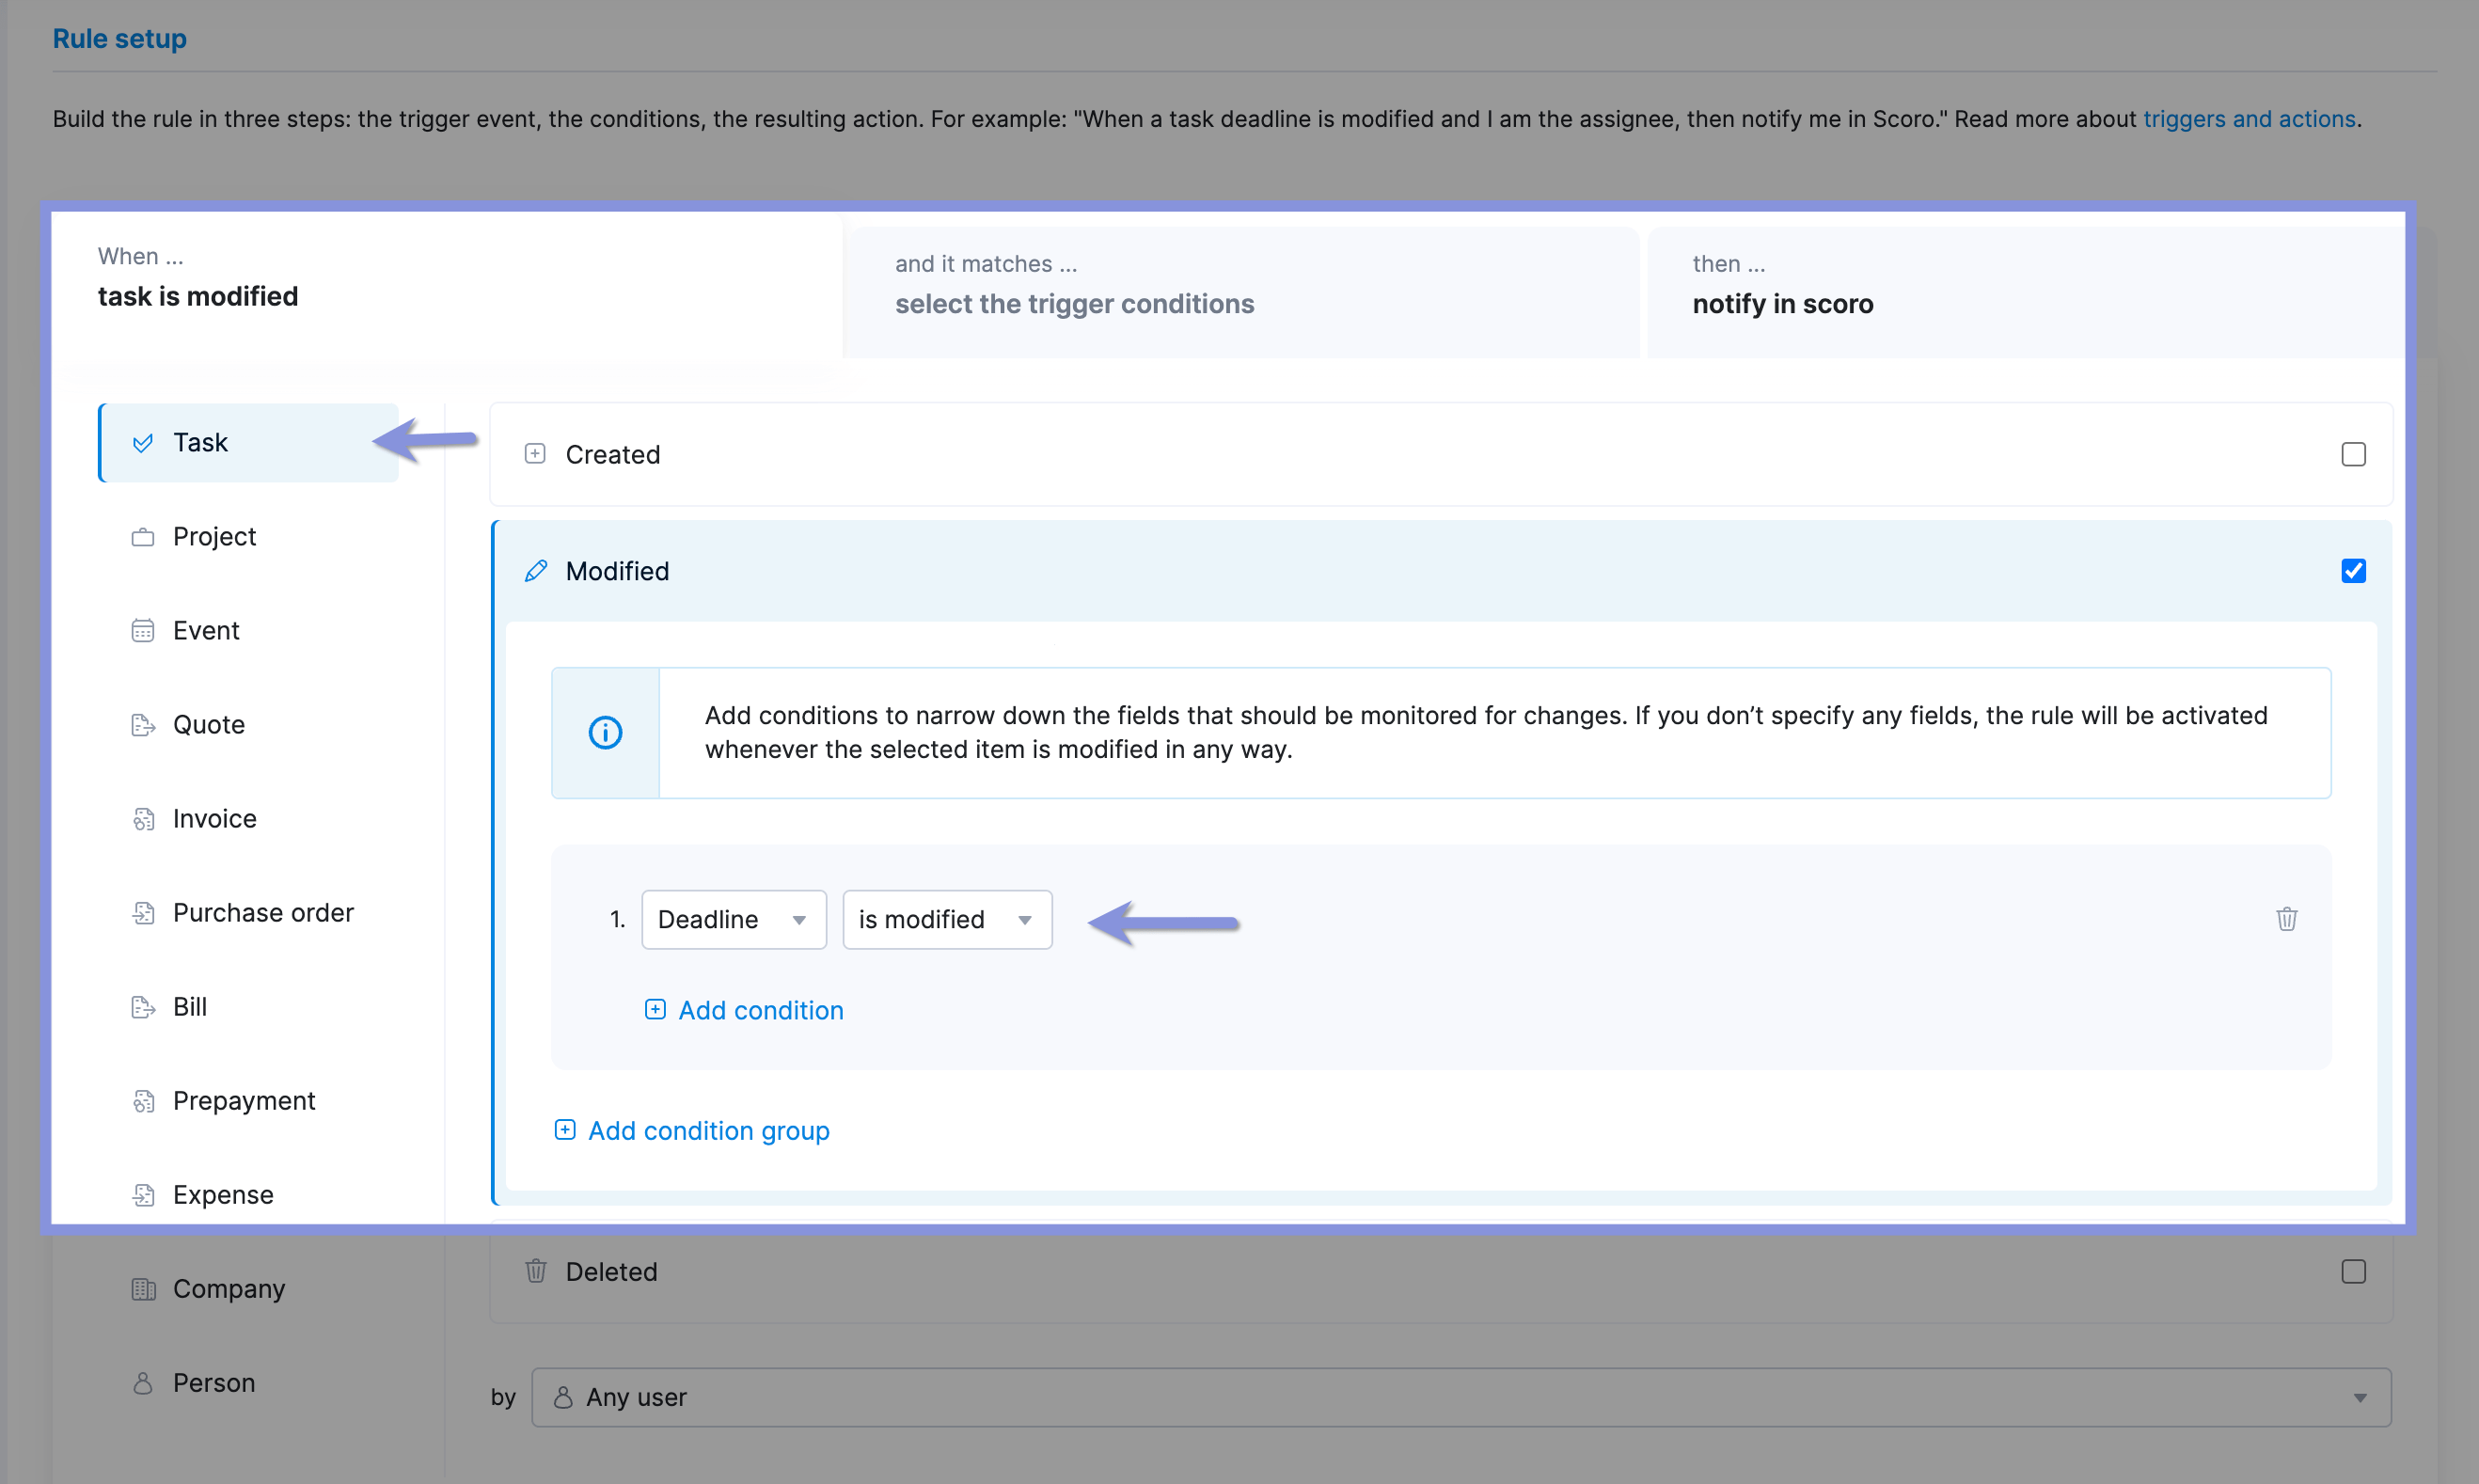
First, you’ll name your trigger and choose when to trigger the action.
For example, you might want to automatically notify relevant team members when one of their task deadlines changes. Select “Task,” then “Modified,” and set the condition to “Deadline: is modified.”
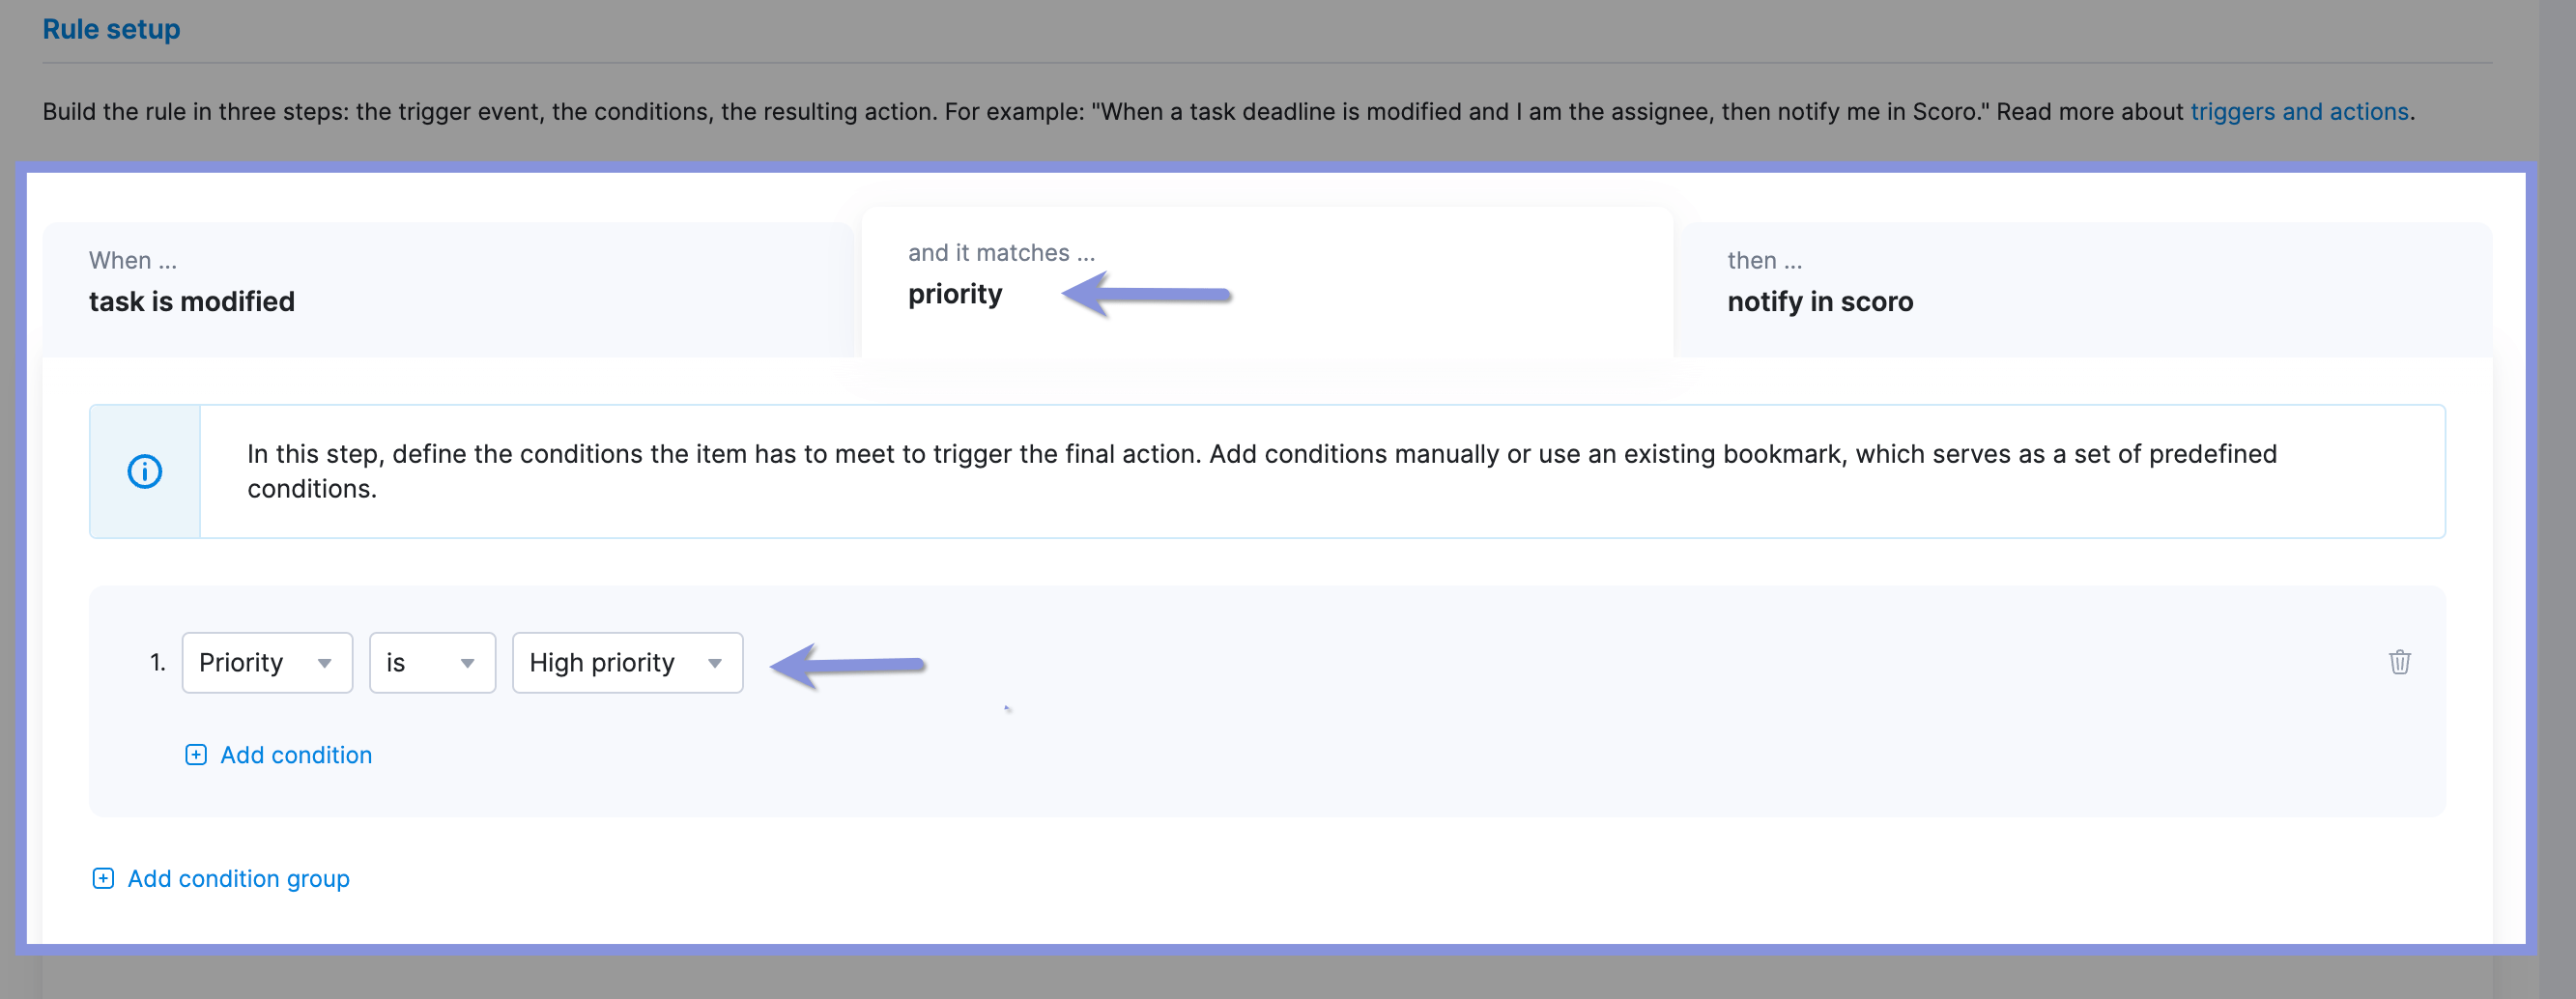
Then, set the conditions.
For example, you might only want to notify them about changes to high-priority tasks. You can set the conditions by clicking the “and it matches…” tab and choosing the appropriate conditions from the drop-down menu.
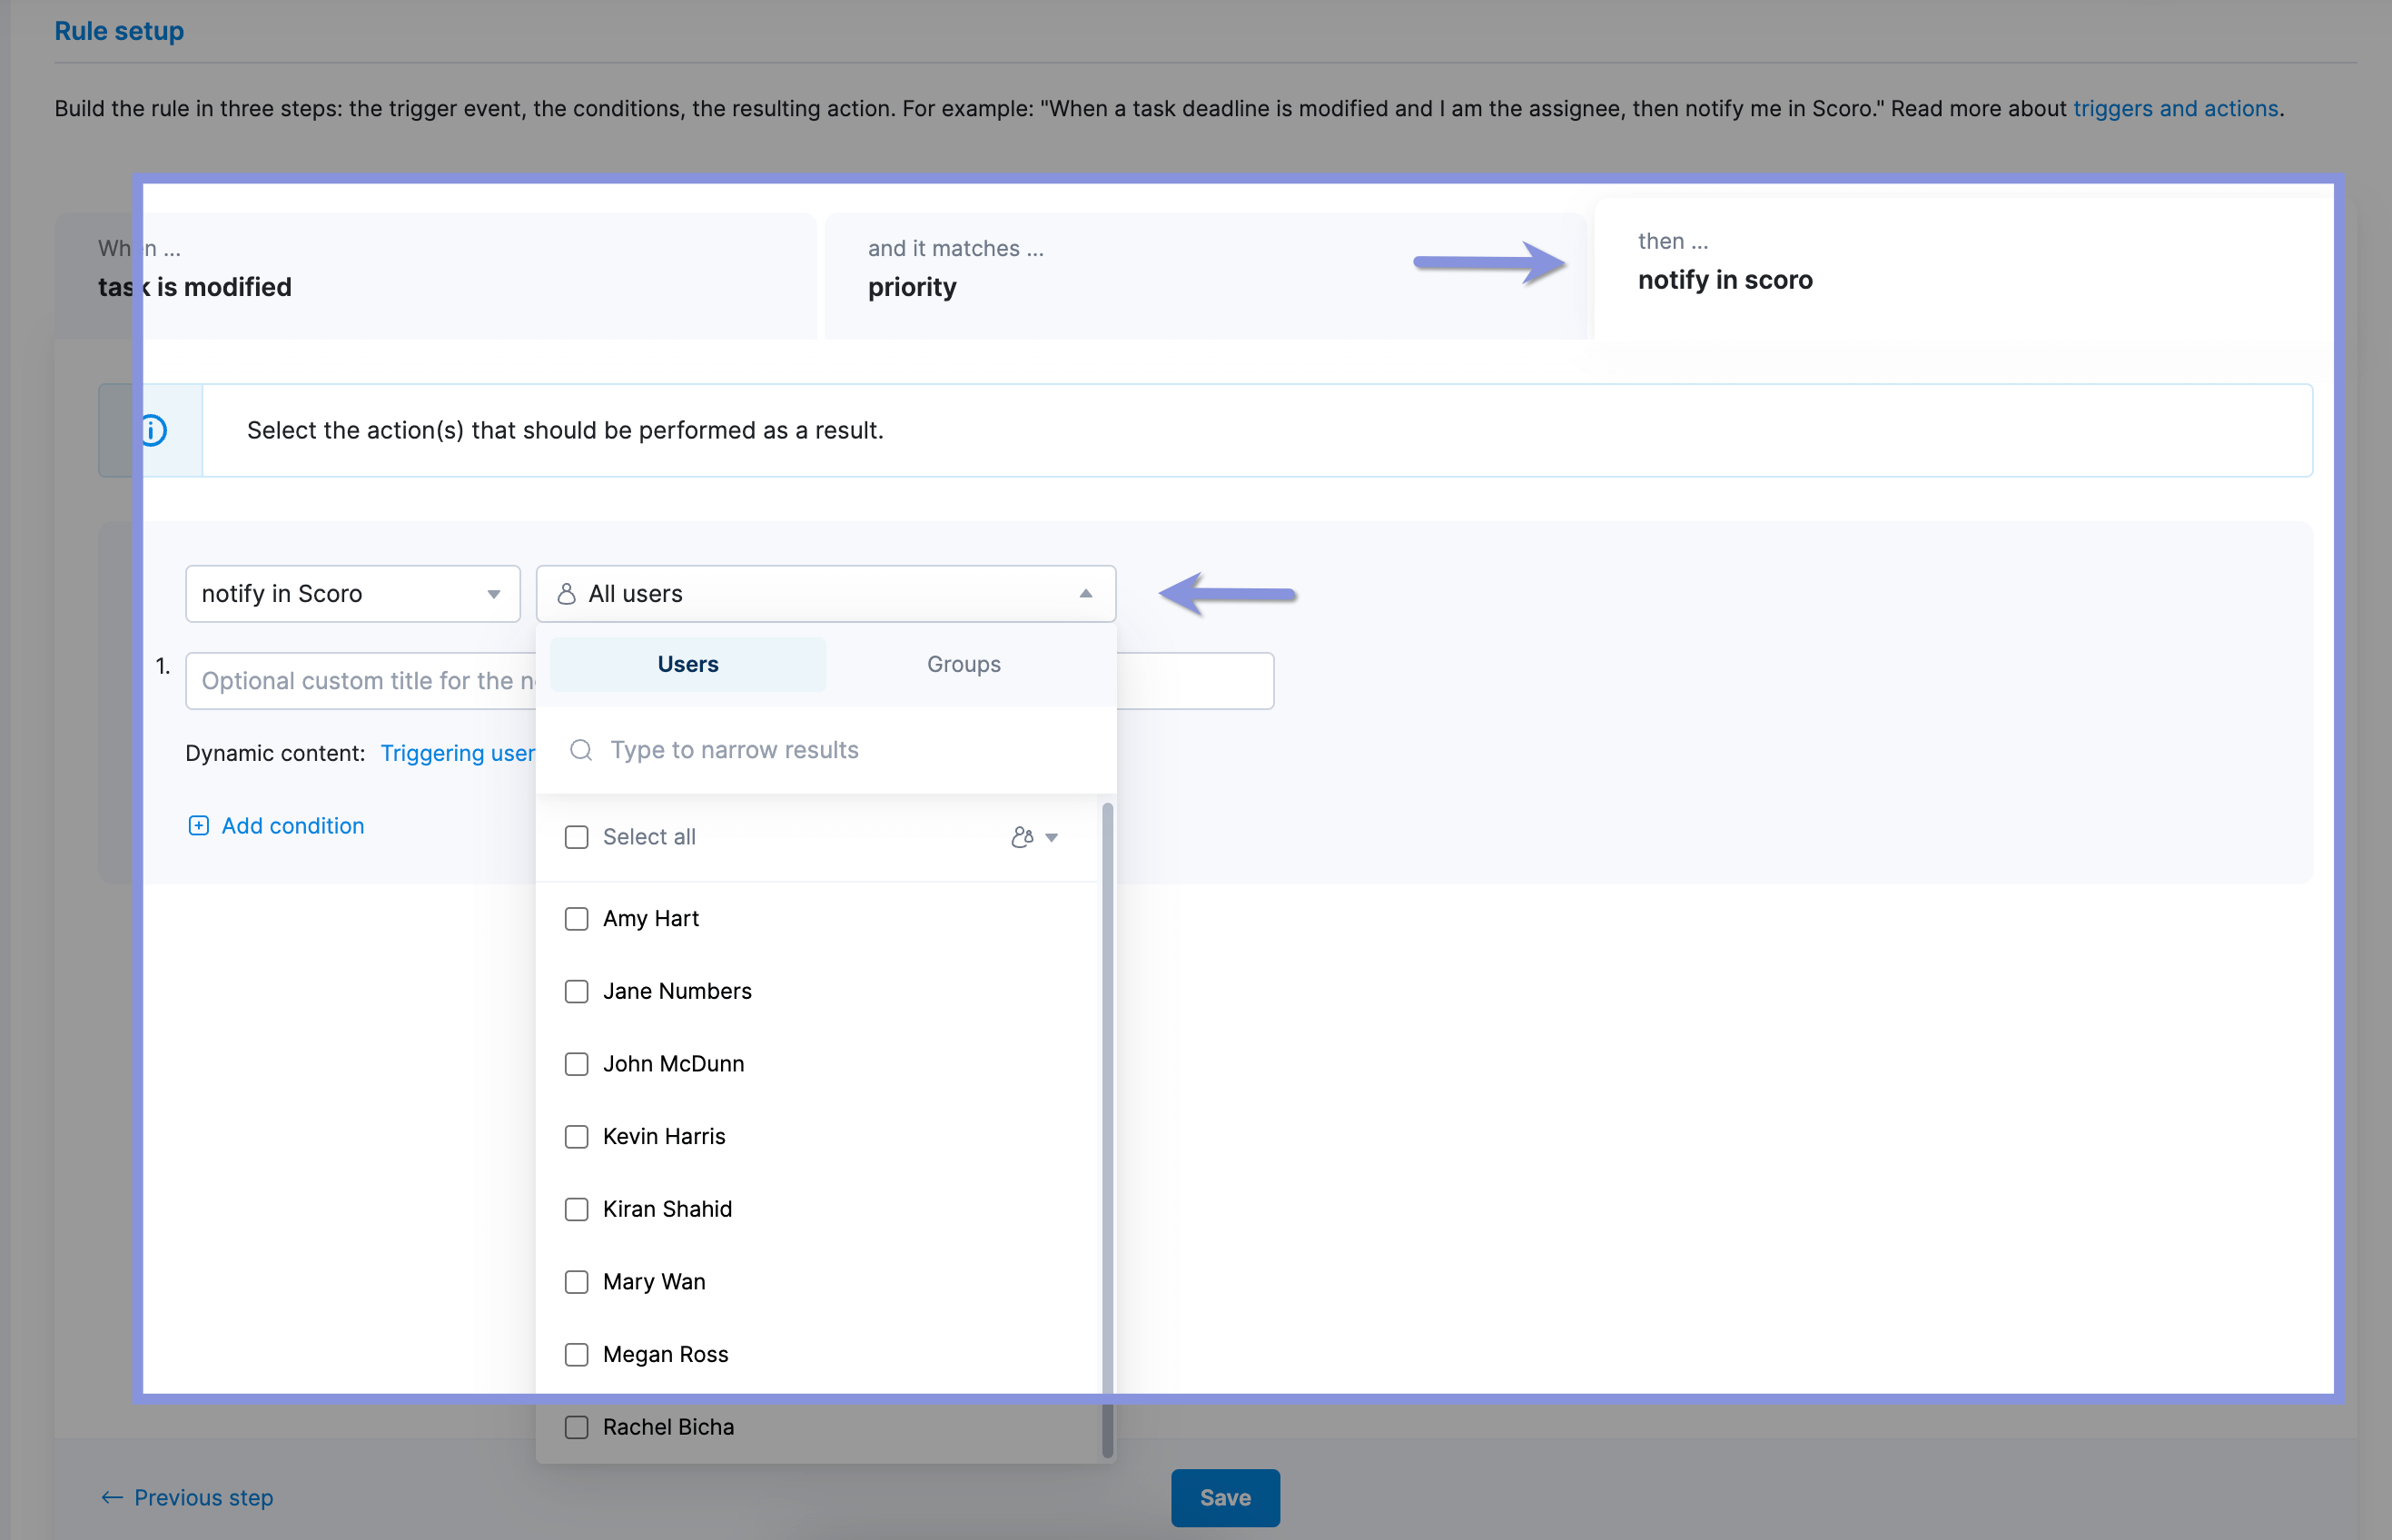
Finally, you’ll choose your action. In this case, you might select “notify in Scoro” and send the notification to the assignee. Then, hit “Save.”
Make optimizing billable utilization easy
Without the right tools, keeping track of everything you need to calculate and track billable utilization accurately is challenging.
That’s why so many agencies only calculate it quarterly or even annually—which is too late to make changes to improve productivity and profitability.
Skip the hassle and stay on top of real-time utilization with Scoro’s end-to-end agency management software.
Our user-friendly platform gives you a clear view of how your team spends their time. This helps you make proactive decisions to keep projects on track and clients and team members happy.


