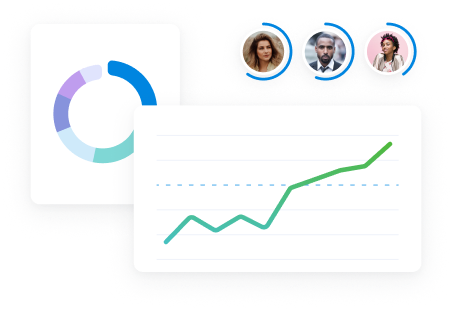

Looking for KPI dashboard software to track revenue, billable utilization, and other key metrics? The right solution can help you spot process inefficiencies, balance workloads, and boost profitability.
But with so many KPI monitoring tools available, choosing the right one can feel challenging.
So, we’ve tried and tested the best KPI software on the market to help you find the right fit. Let’s jump in.
What is KPI dashboard software?
KPI dashboard software (also known as KPI tracking software) is a business intelligence tool that collects, organizes, and visualizes your key performance indicators in real-time.
How does it work?
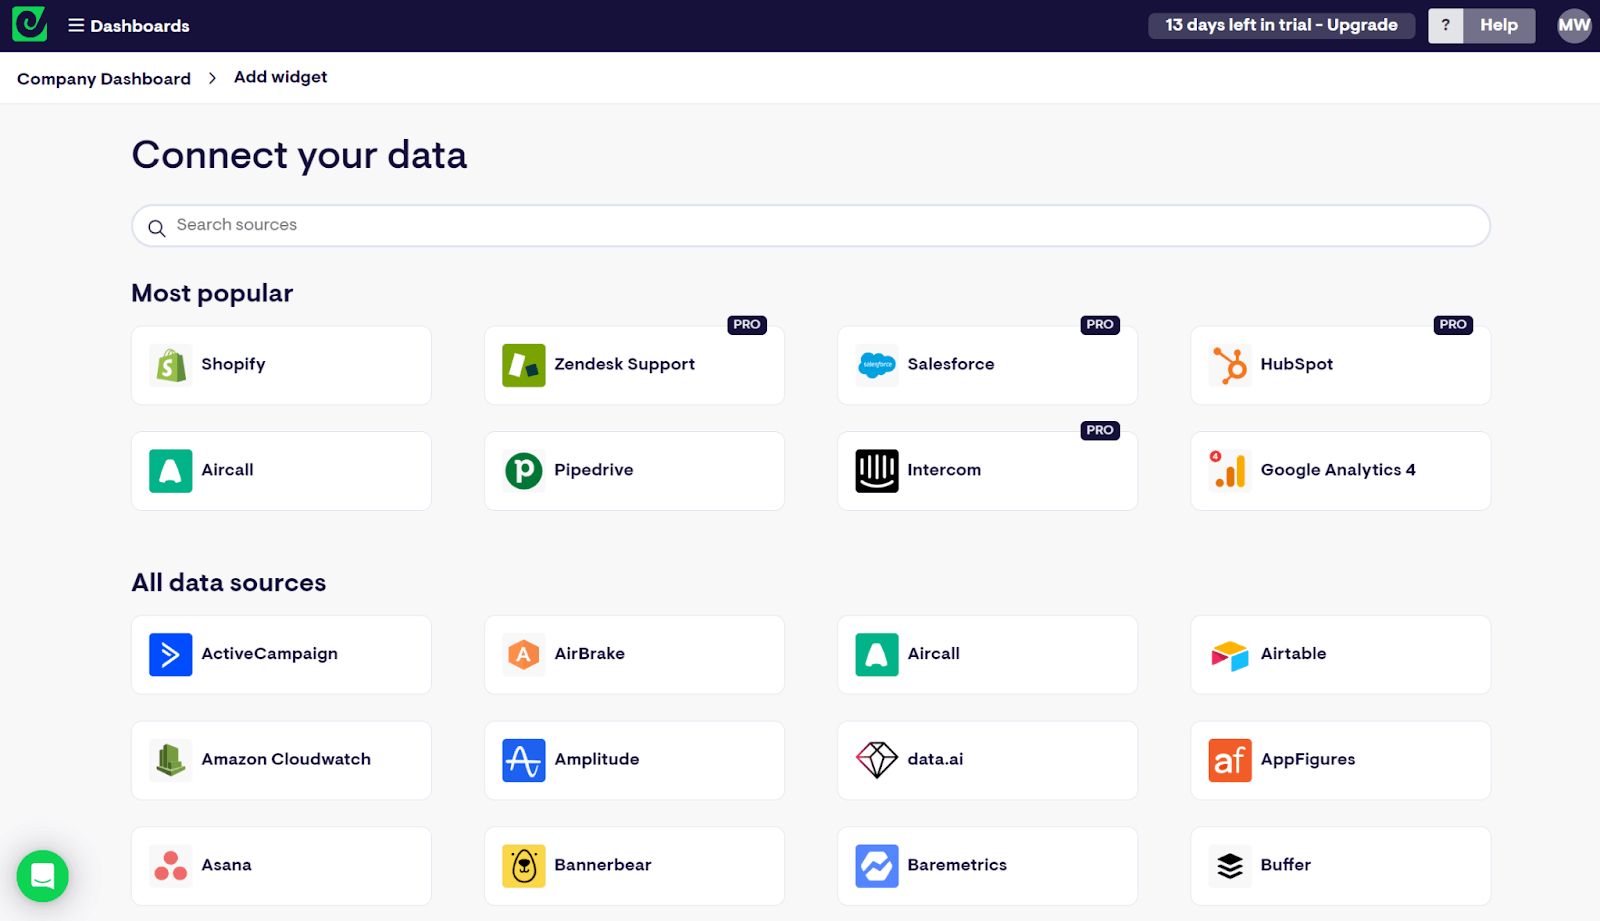
It pulls data from multiple tools your business uses. Such as:
- Project management platforms
- CRM systems
- Financial and accounting software
- Time tracking apps
- Marketing and analytics tools like Google Analytics
- And more
No more jumping between different tools and spreadsheets. Instead, you can monitor project management KPIs, team utilization, and profitability all in one place.
Our top picks for the best KPI dashboard software
| Tool | Best for | G2 Rating | Starting price |
|---|---|---|---|
| Scoro | Professional services businesses (agencies, consultancies) needing an all-in-one platform with customizable KPI tracking | 4.5/5 (400+ reviews) | $26/user/month |
| Databox | Businesses needing quick data visualization and performance monitoring across multiple sources | 4.8/5 (1,000+ reviews) | Free plan available |
| Tableau | Enterprise-level data visualization and analytics, with powerful customization options | 4.5/5 (1,500+ reviews) | $70/user/month |
| Power BI | Microsoft-centric organizations looking for comprehensive business intelligence that integrates with Microsoft 365 | 4.5/5 (2,000+ reviews) | $10/user/month |
| Geckoboard | Real-time KPI tracking and easy display options, such as TV dashboards for in-office or hybrid teams | 4.4/5 (200+ reviews) | $39/month |
| Klipfolio | Businesses seeking both simple and complex custom dashboards, with options for beginners and advanced users | 4.6/5 (200+ reviews) | $49/month |
| Looker Studio | Organizations using Google tools for data visualization, or businesses looking for a free, accessible reporting solution. | 4.4/5 (420+ reviews) | Free |
1. Scoro
Founded in: 2013
Average customer ratings: G2: 4.5 (400 reviews); Capterra: 4.6 (237 reviews)
Ideal for: Operations managers, project managers, and executives who want real-time insights into sales pipelines, team performance, and project profitability—all within a single platform
Overview
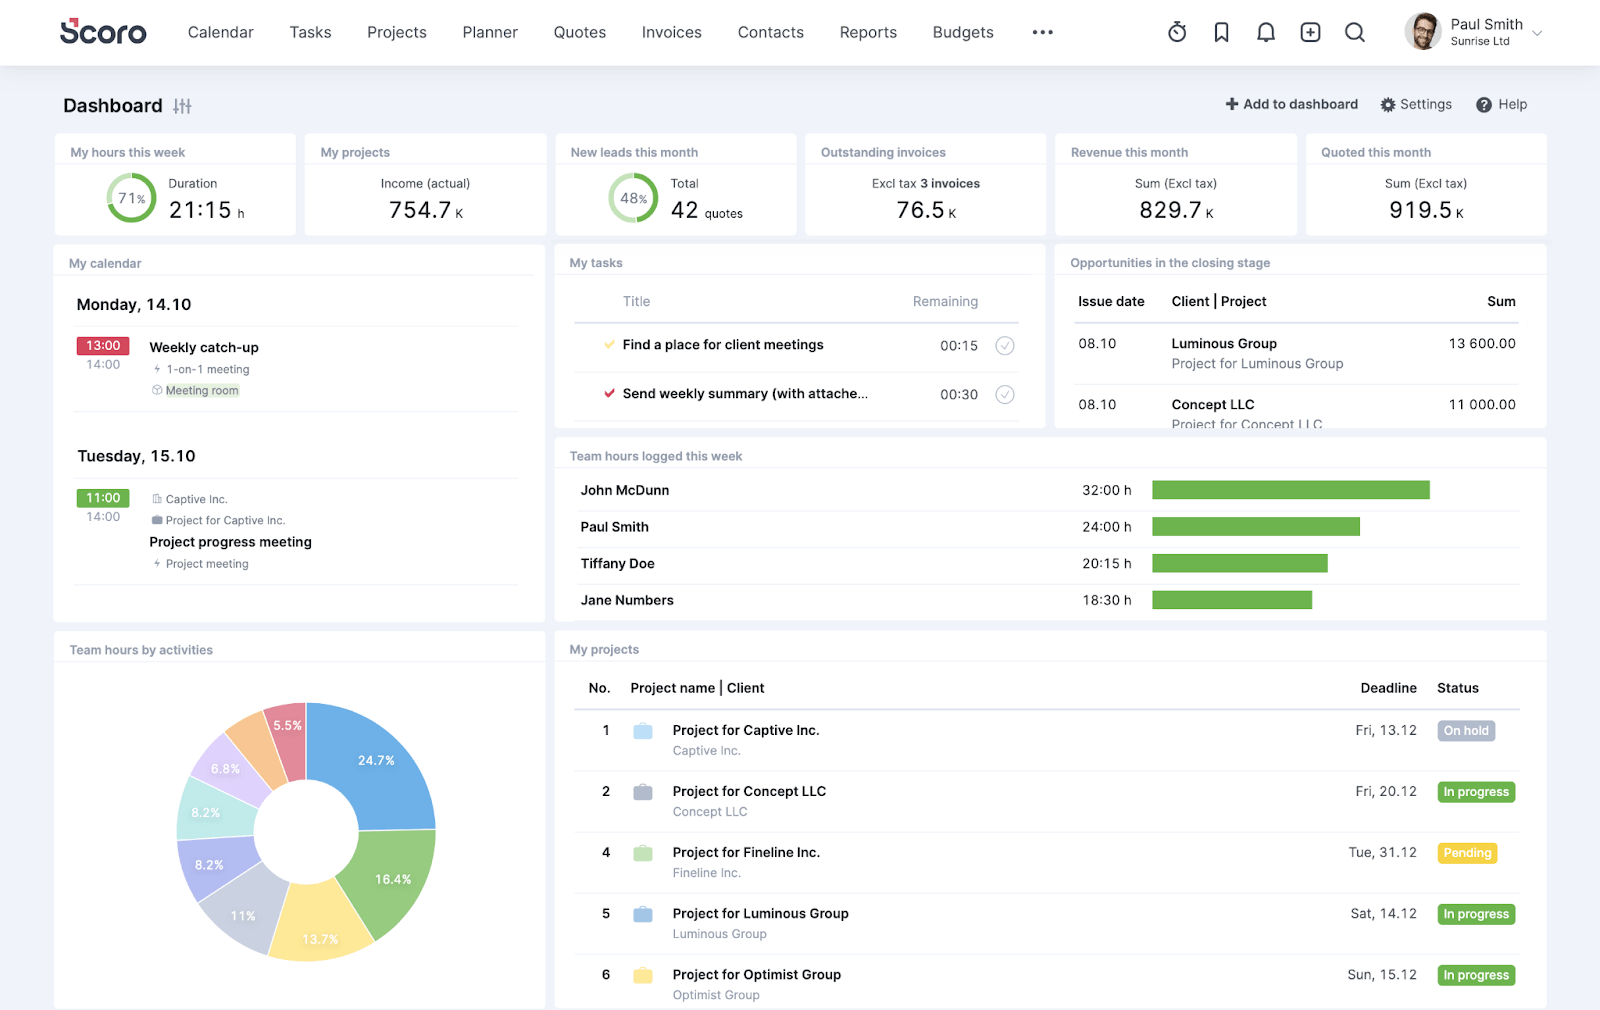
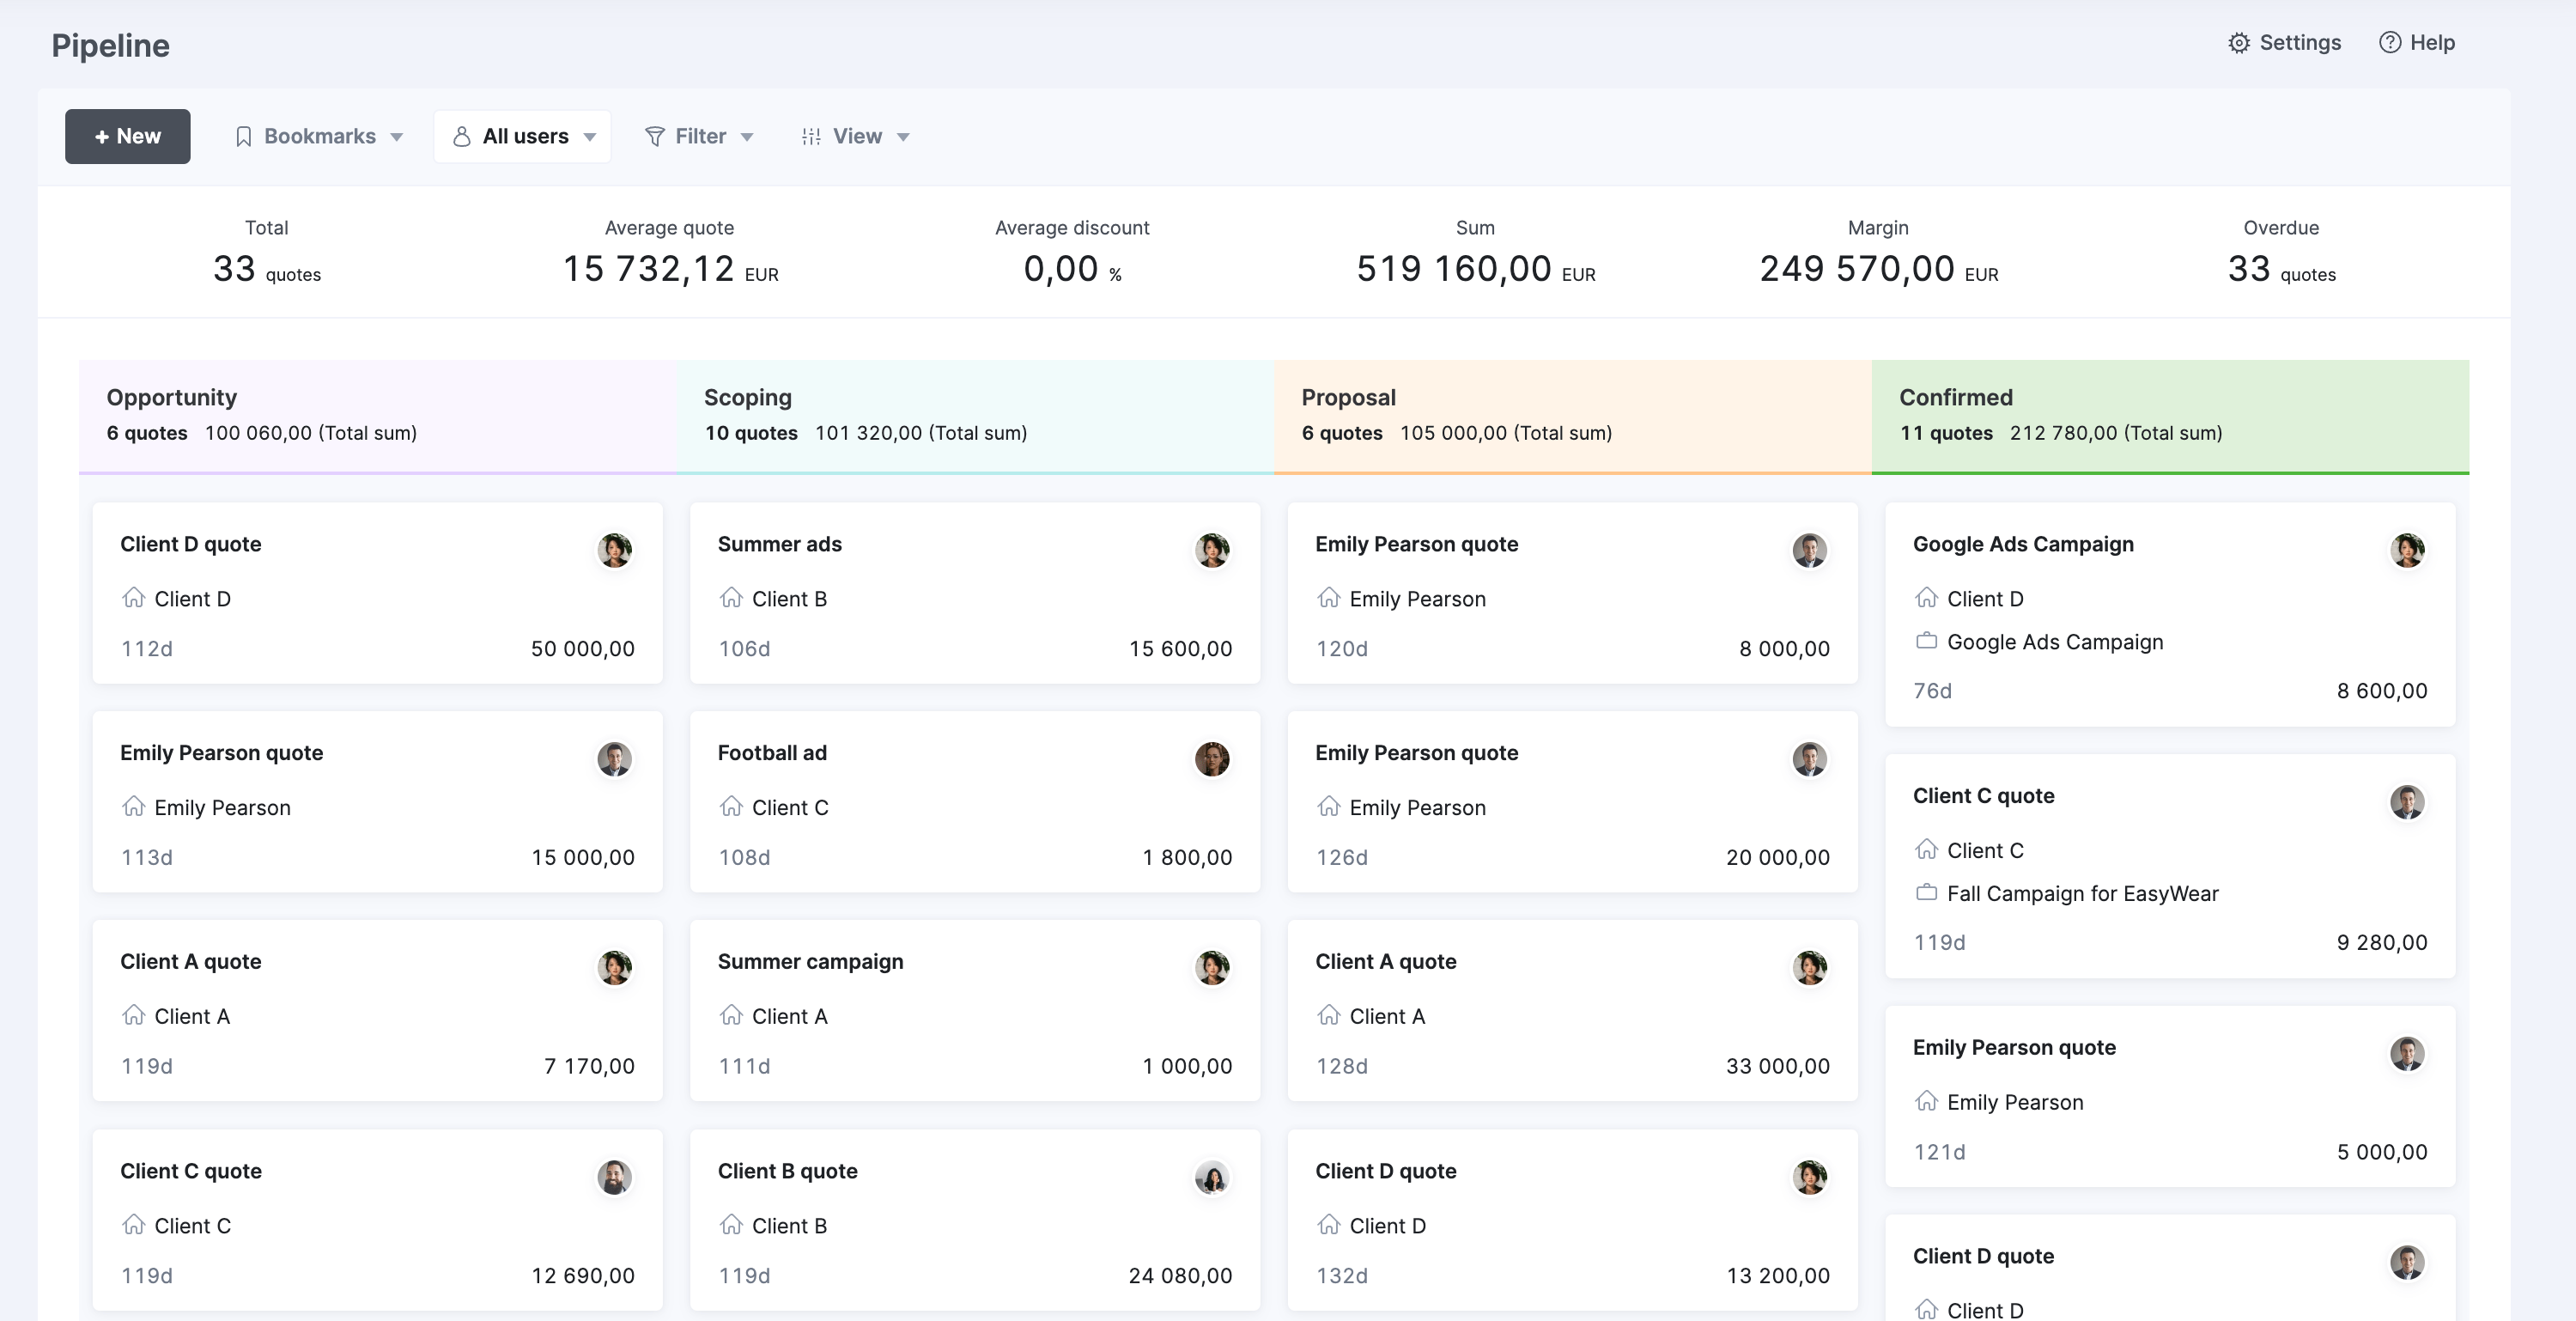
Scoro is a professional services automation (PSA) tool and its detailed, customizable KPI dashboards work across roles, letting everyone from project managers to executives track the unique metrics that matter most to them.
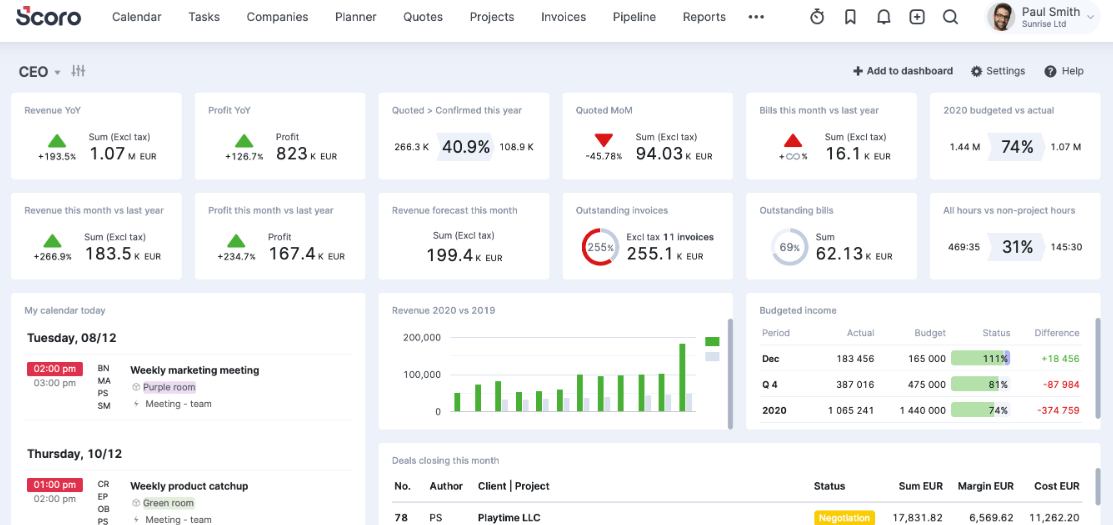
With over 50 report templates, Scoro lets you generate real-time insights on areas like your sales pipeline, team performance, project profitability, and resource utilization with just a few clicks.
If you need help with your dashboards or reports, Scoro’s AI-powered bot, ELI, can provide quick solutions.
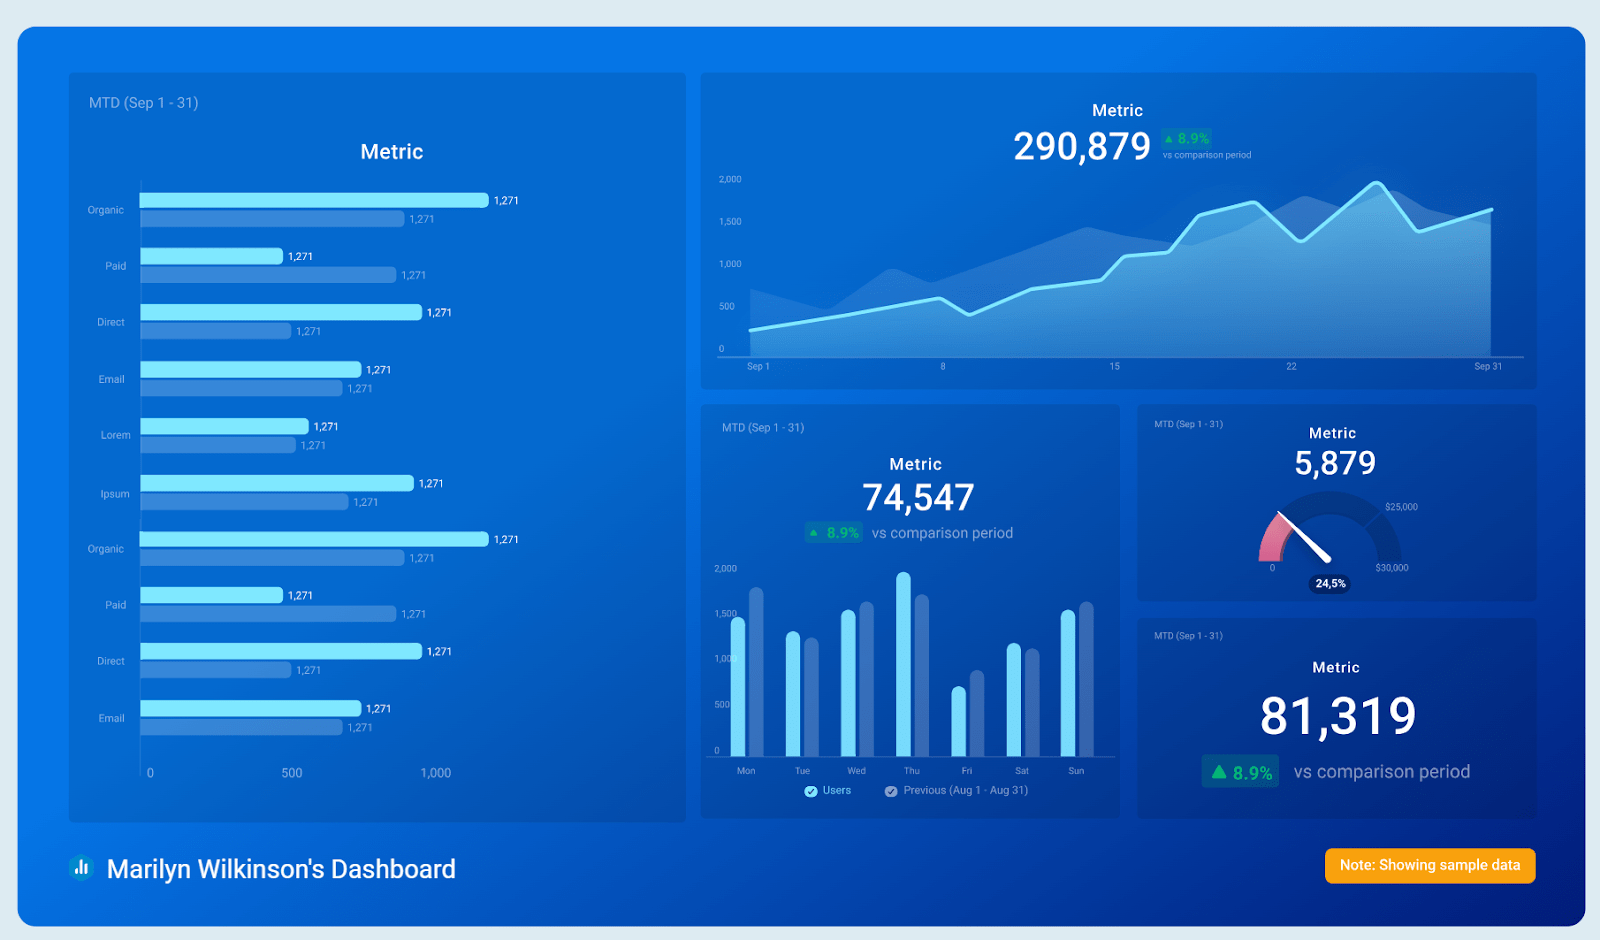
Check out the various reports and dashboards in this quick walk-through:
Key features you’ll love
- A report library with over 50 pre-built templates covering productivity, utilization, revenue, costs, and profitability
- Real-time customizable dashboards that each team member can personalize to track individual, team, or company-wide KPIs
- Financial performance tracking, including project margins, revenue, and cost monitoring
- Resource utilization dashboards showing team capacity, billable hours, and workload distributions
- Project progress tracking that shows your actual vs. estimated time and budget burn
- Sales pipeline visualization with revenue forecasts and closing probability metrics
Ease of use
Setting up dashboards in Scoro is simple. You can either start from scratch and drag and drop your preferred metrics onto the dashboard or choose from pre-built templates in the dashboard library.
- Intuitive interface: Yes—users can quickly create their own dashboards and drag and drop metrics to adjust
- Modern design: Yes—a clean, organized look with easy-to-read widgets and charts
- Customization options: High—users can add their own data sources, metrics, and benchmarks
- Learning curve: Moderate—the basic setup is simple but mastering all the dashboard features takes time
Integrations
Scoro integrates with over 45 tools, including:
- Salesforce
- HubSpot
- QuickBooks
- Xero
- Expensify
- Slack
- Google Calendar
- Zapier
- Google Analytics
- MailChimp
Pros & cons
| Pros | Cons |
|---|---|
| Extensive report library with 50+ pre-built templates for quick insights | Higher pricing point compared to basic dashboard tools |
| Automated reporting saves hours of manual data compilation | Moderate learning curve to master all dashboard features |
| Ability to create multiple dashboards for different purposes and roles | Maximum of 36 widgets per individual dashboard |
| Highly customizable widgets with benchmark tracking | Some advanced reports (like sales pipeline and utilization) only available in higher-tier plans |
| 45+ integrations with key CRMs, accounting tools, payment platforms, and more | |
| Simple drag-and-drop customization |
Use cases and ideal users
- Executives who need full visibility into all areas of the business, from the sales pipeline to billable utilization
- Operations managers focused on optimizing processes, managing capacity, and maintaining profit margins
- Project managers looking to execute profitable projects fromthe initial quote through to payment
- Financial managers who need to control costs and streamline invoicing
- Team members who want clear visibility into their day-to-day tasks and project progress
What others say about Scoro
“Scoro’s reporting and dashboard feature provides users with real-time data and insights into their projects, team performance, and business health.”
—Redemptor, Capterra
“Before Scoro, we had to make judgments based on outdated information; today, we can evaluate the data in real time. Scoro makes it extremely easy to discover and update data, and we have all we need to manage the company in one spot.”
—Jerry, G2
Pricing
There are four plans available:
- Core: $19.90 per user per month
- Growth: $32.90 per user per month
- Performance: $49.90 per user per month
- Enterprise: Contact sales for pricing
Try Scoro yourself with a free two-week trial.
2. Databox
Founded in: 2012
Average customer ratings: G2: 4.4 (189 reviews); Capterra: 4.6 (202 reviews)
Ideal for: Marketing managers, small-to-medium businesses looking for a data-driven culture, and sales teams who require real-time pipeline visibility
Overview
Databox is an analytics platform that helps you centralize and visualize your data. You can pull metrics from over 100 sources into customizable dashboards, ensuring a single source of truth for your business metrics. And avoid manually importing data from different tools.
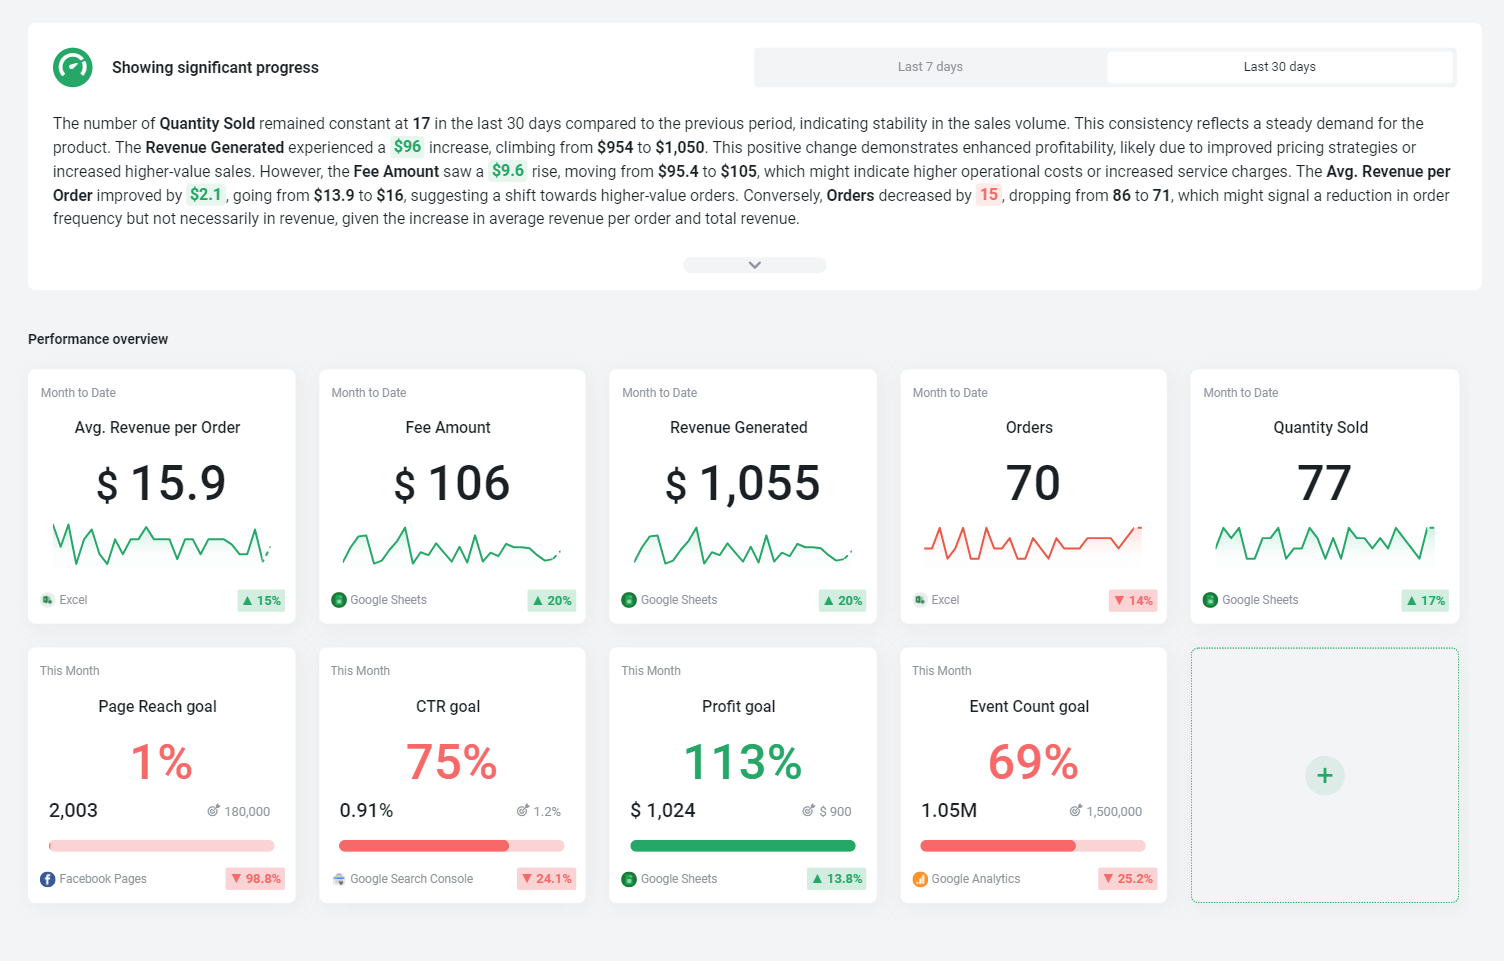
What’s more, AI-powered insights and forecasting capabilities help you quickly spot trends and make data-driven decisions. For example, Databox’s AI summaries save you time on analysis, highlighting key patterns and points to address.
Key features you’ll love
- A library with over 4,000 pre-built metrics for quick dashboard setup
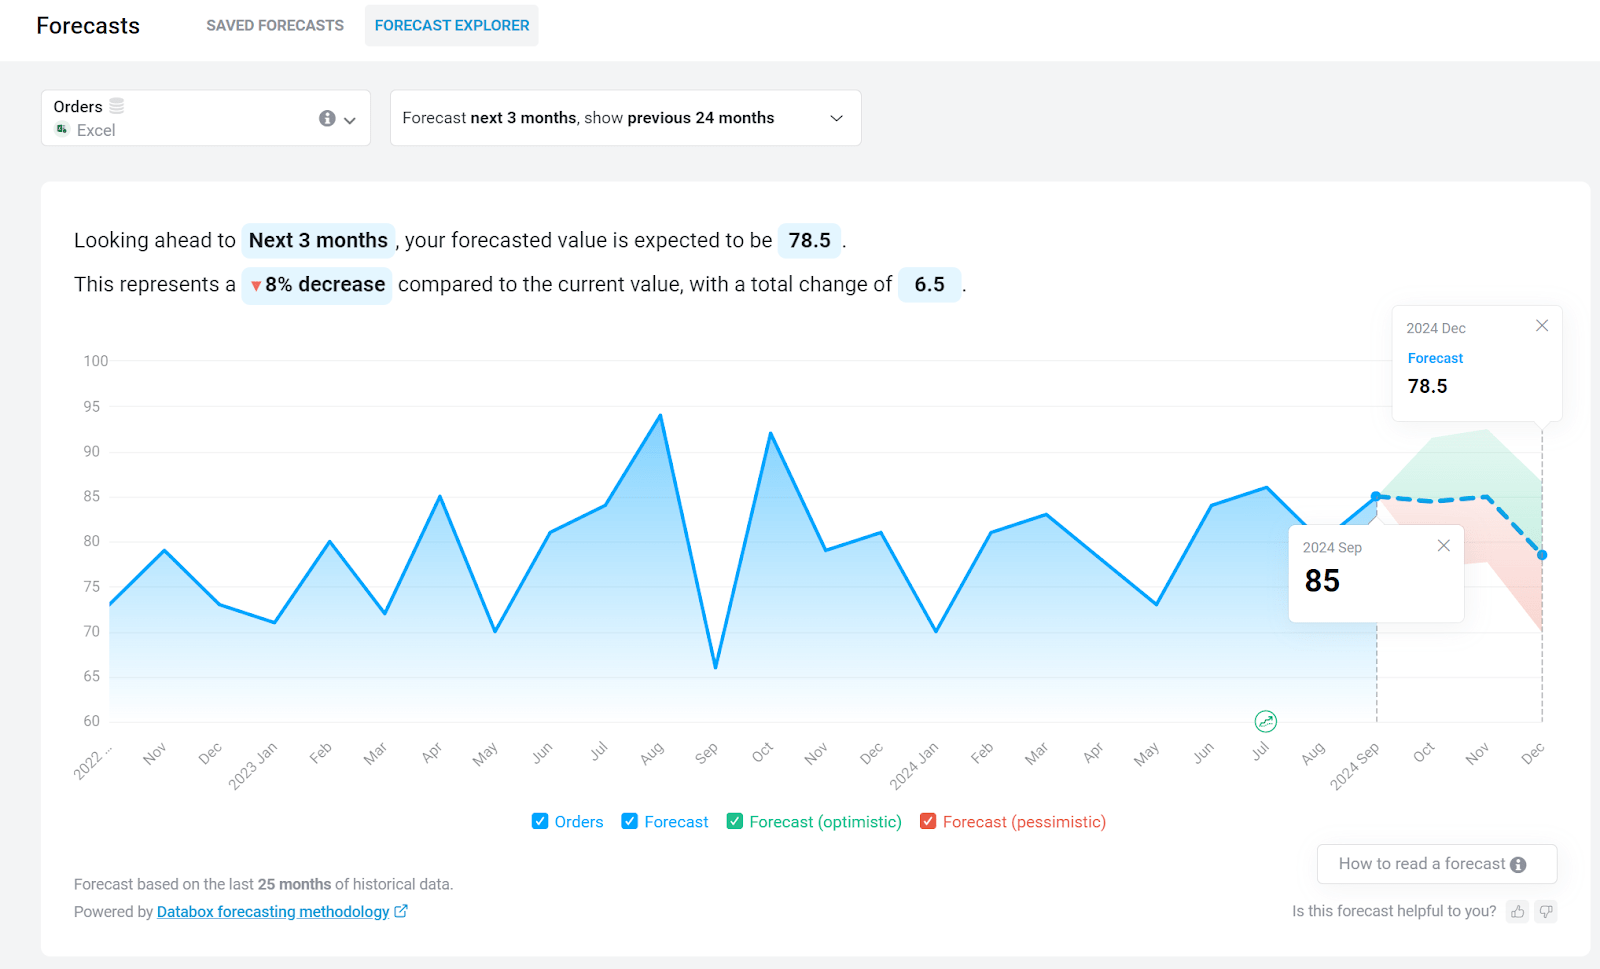
- Forecast Explorer to create forecasts of key metrics, including adjustments for seasonality and events
- Goal tracking with alerts and progress monitoring
- Benchmarking tools to compare performance with similar companies
- A drag-and-drop dashboard builder
- The option to pull ad visuals into your marketing dashboards
- AI-generated performance summaries and insights
Ease of use
With Databox, it’s easy to set up and adjust KPI dashboards. When you sign up, the system walks you through which data sources you want to connect with. Then, you can start building your dashboards, choosing your metrics, and exploring forecasts in just a few clicks.
- Intuitive Interface: Yes—it uses a drag-and-drop dashboard builder with one-click templates
- Modern Design: Yes—a clean, contemporary interface with clear data charts and graphs
- Customization Options: High—there’s flexible dashboard layouts, custom metrics, and branding options
- Learning Curve: Easy—it’s designed for all kinds of users and there’s no coding required, even for forecasts and more advanced analysis
Integrations
DataBox has a lot of integrations. Over 100, in fact. These include:
- HubSpot
- PayPal
- Jira
- Google Ads
- FreshBooks
- Slack
- Snowflake
- Gmail
- DropBox
- Zapier
Pros & cons
| Pros | Cons |
|---|---|
| Quick dashboard setup with an extensive template library | AI features only available with the Growth plan ($319 per month) |
| Easy forecasting with customizable timeframes | Data refresh limitations (free plan: daily, starter: every four hours, others: hourly) |
| 100+ integrations to create a single source of truth | Only 11 months of historical data available on lower plans |
| Real-time performance alerts | |
| AI-powered insights speed up data analysis |
Use cases and ideal users
- Marketing managers who need to track campaign performance and ROI across multiple channels
- Business leaders of small-to-medium-sized companies wanting to build a data-driven culture without complex BI tools
- Sales teams needing real-time pipeline visibility and goal tracking
- Agency professionals that need multiple client dashboards and performance reports
What others say about Databox
“Databox is hands down the best visualization tool. I can easily sync it to my Google Analytics, Hubspot, Adwords, LinkedIn, and other tools.”
—Robert, G2
“Databox is an absolute must in my tech stack. After trying most dashboard software out there, I’ve seriously come to appreciate the ease of use, large number of integrations, and great support that this product offers.”
—Paul, G2
Pricing
There are five plans available, including a free option:
- Free Forever
- Starter: $47 per month
- Professional: $135 per month
- Growth: $319 per month
- Premium: $799 per month
To give DataBox a try, sign up for a free account or take a 14-day trial.
3. Tableau
Founded in: 2003
Average customer ratings: G2: 4.4 (2,148 reviews); Capterra: 4.5 (2,295 reviews)
Ideal for: Data analysts, business intelligence teams, and large organizations that need to support various departments with robust analytics capabilities
Overview
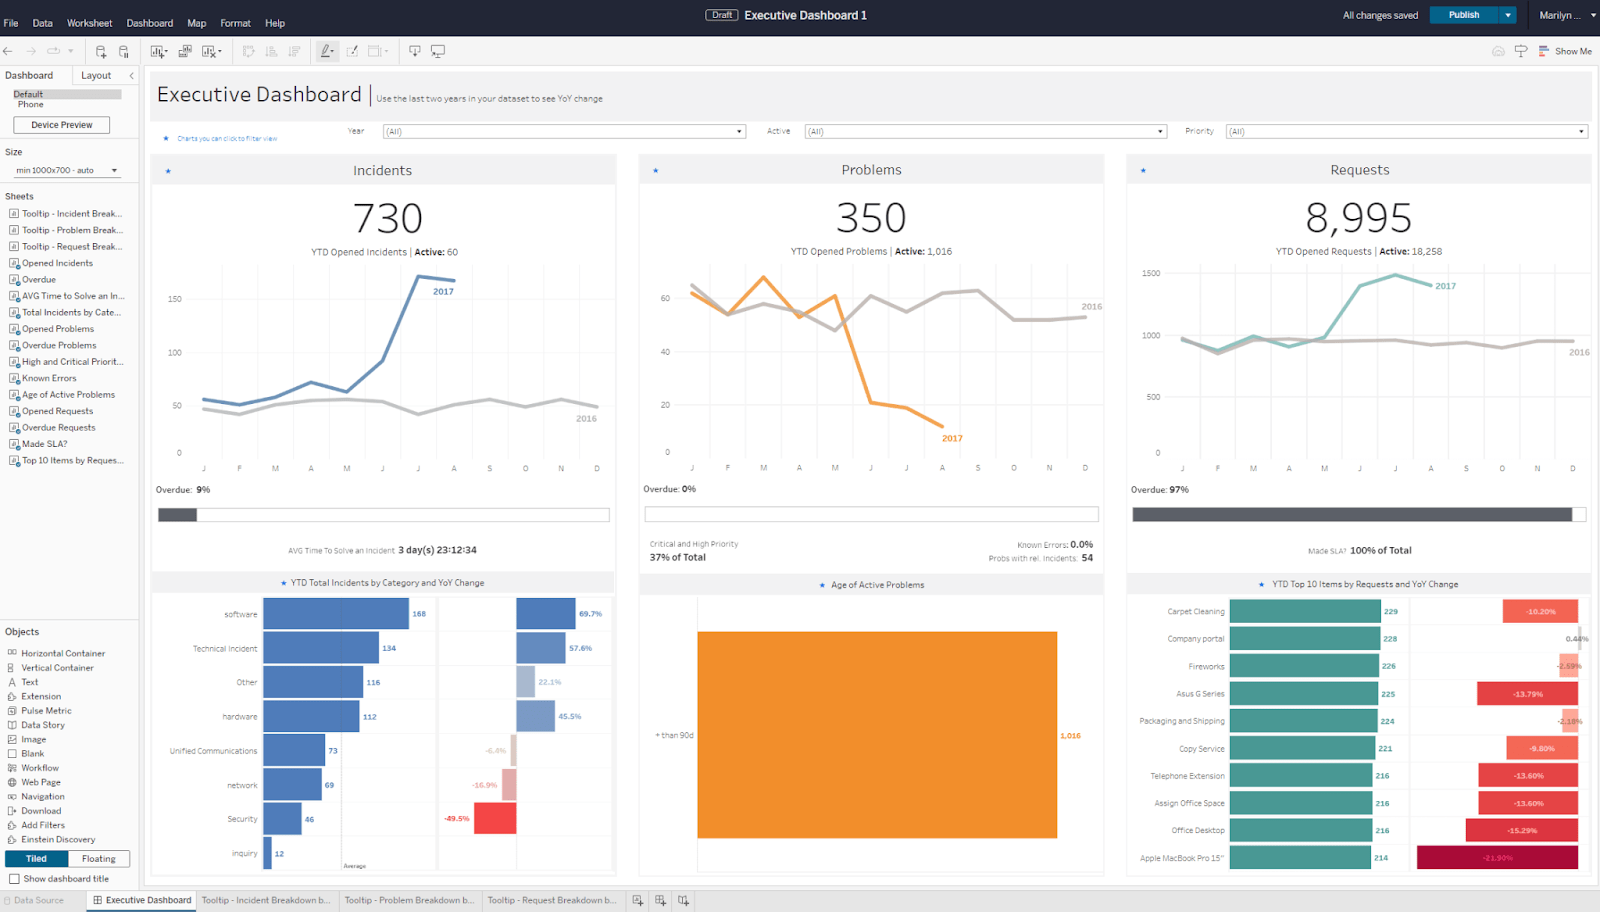
Tableau is an enterprise-grade analytics and KPI management software powered by Salesforce. It helps you turn complex data sets into clear charts, dashboards, and AI summaries.
And Tableau Pulse provides AI-generated insights to help you spot data trends and anomalies:
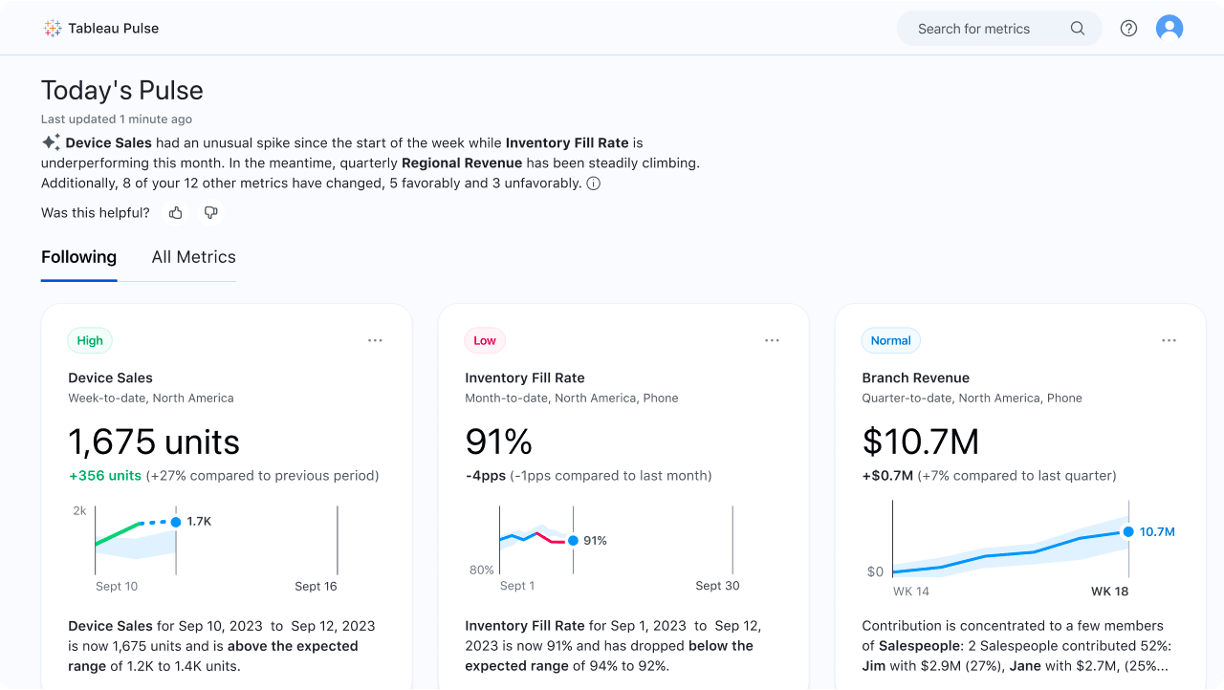
Tableau+ users can also access Tableau Einstein, which lets you ask it questions like “What’s driving sales?” and offer answers based on its review of your data.
Key features you’ll love
- Einstein AI that provides answers to your data-related questions
- AI summaries with Tableau Pulse for faster, easier data analysis
- Enterprise-grade security and governance controls for data protection
- Mobile-friendly dashboards for access across devices
- Built-in version control and change tracking for dashboards
- Powerful drill-down capabilities for detailed data exploration
Ease of use
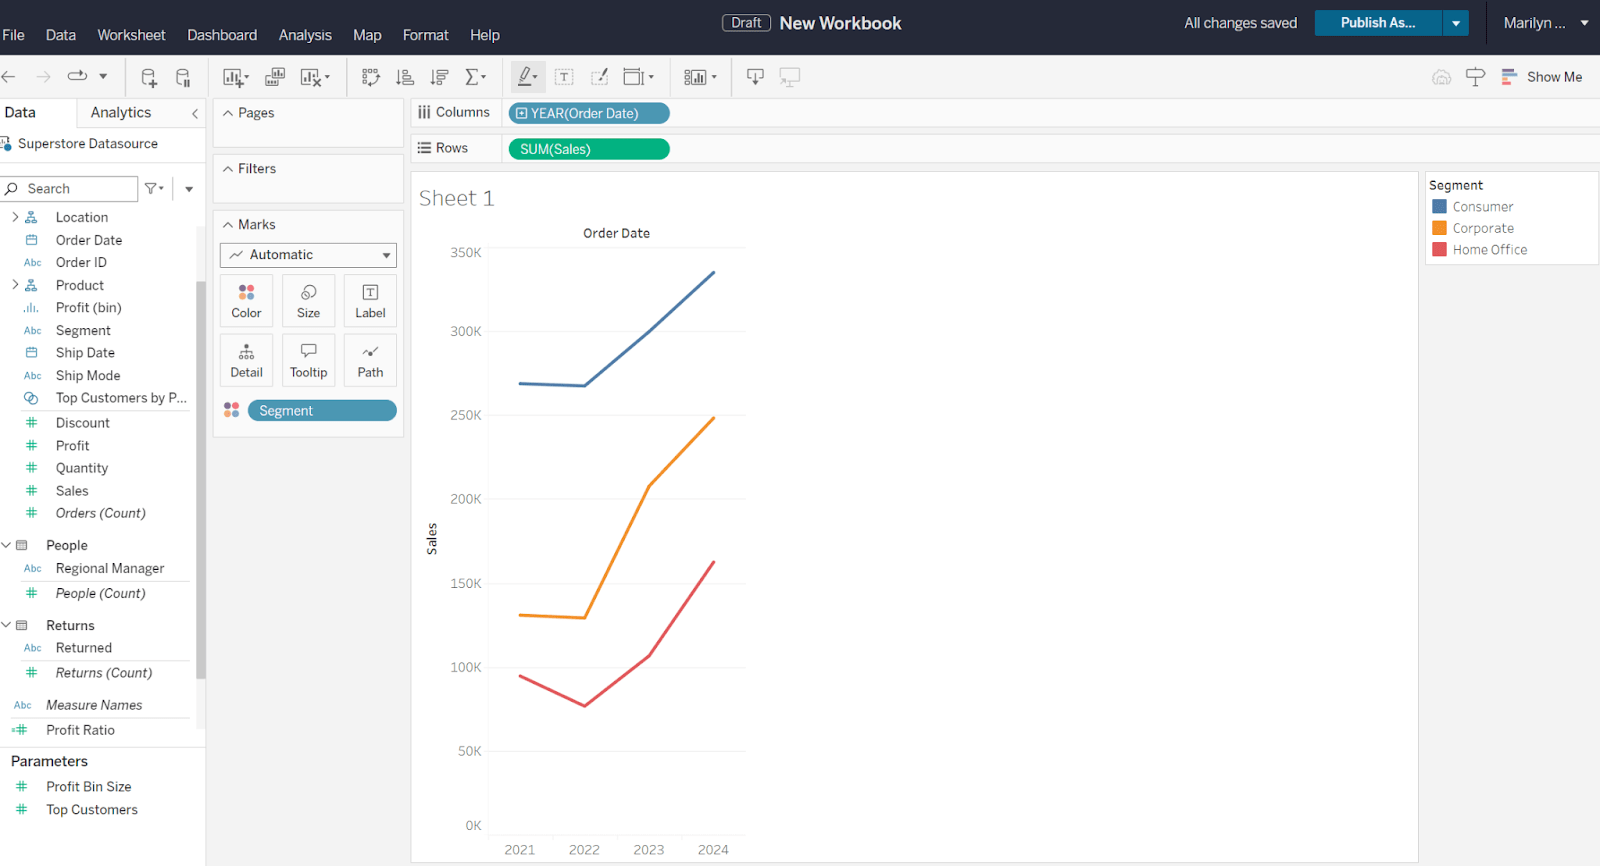
It’s fairly straightforward to sign up, create a new workbook (what Tableau calls dashboards), and connect your data. Just drag and drop the metrics you want to add.
- Intuitive interface: Moderate—requires familiarity with data analysis concepts
- Modern design: Moderate—it’s a business-oriented layout with advanced visualization options
- Customization options: High—extensive options for data visualization and analysis
- Learning curve: Steep—best suited for users with a solid background in analytics
Integrations
Tableau offers over 80 “supported connectors” (integrations), including:
- Microsoft Excel
- Salesforce
- Microsoft SQL Server
- QuickBooks
- Google Analytics
- SAP HANA
- Marketo
- Azure SQL Database
- LinkedIn Sales Navigator
Pros & cons
| Pros | Cons |
|---|---|
| Advanced data visualization capabilities | Steep learning curve for non-technical users |
| AI-powered analytics with Einstein | Requires significant training to use fully |
| Enterprise-grade security features | Higher price point than simpler alternatives |
| Extensive customization options | Complex setup and implementation process |
| Large community with online and in-person support, resources, and events | A license is required to view the dashboard |
| Comprehensive training materials |
Use cases and ideal users
- Data analysts and business intelligence professionals needing advanced visualization tools
- Enterprise organizations requiring robust data governance and security options
- Large organizations looking to support diverse analytics needs across departments—from marketing and sales to finance and operations
What others say about Tableau
“Tableau is an extremely strong and adaptable data visualization tool.”
—Disha, G2
“What I like best about Tableau is its ability to turn complex data into visually engaging and easily understandable dashboards, allowing for quick insights through interactive filtering and real-time updates.”
—VJ, G2
Pricing
Tableau offers seven pricing plans:
- Tableau Creator: $75 per user per month, billed annually
- Tableau Explorer: $42 per user per month, billed annually
- Tableau Viewer: $15 per user per month, billed annually
- Enterprise Creator: $115 per user per month, billed annually
- Enterprise Explorer: $70 per user per month, billed annually
- Enterprise Viewer: $35 per user per month, billed annually
- Tableau+: Pricing available on request
Start with a free trial or contact the sales team for enterprise options.
4. Microsoft Power BI
Founded in: 2015
Average customer ratings: G2: 4.5 (1,163 reviews); Capterra: 4.6 (1,1721 reviews)
Ideal for: Business users across finance, sales, and marketing teams who need collaborative analytics; data analysts requiring advanced data exploration.
Overview
Power BI is Microsoft’s business intelligence platform that helps you visualize and analyze data from any source.
In particular, it integrates seamlessly with Microsoft 365 apps like Teams, Excel, PowerPoint, and SharePoint. So, you can build on familiar tools.
A key highlight is Power BI’s AI capabilities. The platform automatically suggests the best visualizations for your data, like charts and tables. And it responds to questions you enter with instant data insights.
Key features you’ll love
- OneLake data hub that combines data from multiple sources
- AI-powered analysis tools that act as helpful partners
- Real-time data refreshes to keep everything updated
- Enterprise-grade security controls to protect sensitive data
- A mobile app for accessing reports on any device
- Custom developer tools for extending Power BI’s capabilities
- Multiple ways to present data, including dashboards, reports, scorecards, and data stories (interactive dashboards)
Ease of use
Power BI strikes a balance between powerful analytics and accessibility. Whether you’re a beginner using drag-and-drop tools or an expert diving into advanced analytics, there’s options for everyone based on their skill levels.
- Intuitive interface: Yes—it has the familiar Microsoft design and navigation
- Modern design: Yes—it has a clean, professional look with interactive charts and dashboards
- Customization options: High—extensive options for both basic and advanced users
- Learning curve: Moderate—easy for basic tasks, steeper for advanced features
Integrations
Microsoft Power BI plugs into over 100 other tools, including:
- Google Analytics
- Google Ads via Winddor.ai
- Snowflake
- Amazon via windsor.ai
- LinkedIn via windsor.ai
- Salesforce Insight app
To see a full list of integrations, set up an account and check out the “Apps” section. Here’s a quick overview of how it works.
Pros & cons
| Pros | Cons |
|---|---|
| Easily plugs into other Microsoft tools like Excel and Teams | Mobile app has limited functionality |
| Strong security and governance features | Complex features require technical expertise |
| Extensive integration options | Performance can slow with large datasets |
| Strong online community with forums and resources |
Use cases and ideal users
- Organizations who use Microsoft 365 and want integrated analytics that people and teams can easily collaborate on
- Business users across finance, sales, and marketing teams creating reports to track KPIs and performance metrics
- Data analysts requiring advanced analytics capabilities
What others say about Microsoft Power BI
“For anyone already used to the Microsoft ecosystem, PowerBI delivers a combination of a user-friendly interface and powerful analytics.”
—Nathiele, G2
“PowerBI is applicably named as it is a powerful analytics tool, this program is great for taking mountains of unparsable data and turning it into meaningful information.
Cameron, G2
Pricing
There are four plans available:
- Free account
- Power BI Pro: $10 per user per month
- Power BI Premium Per User: $20 per user per month
- Power BI in Microsoft Fabric: Variable pricing
Try the free account or take a free trial to test the paid plans.
5. Klipfolio
Founded in: 2001
Average customer ratings: G2: 4.5 (253 reviews); Capterra: 4.1 (193 reviews)
Ideal for: Data teams that want to enable self-service analytics with PowerMetrics, or advanced users needing highly customizable dashboards with Klips.
Overview
Klipfolio offers two solutions: PowerMetrics for beginner-friendly analytics and simple dashboards, and Klips for more complex, custom dashboards.
PowerMetrics helps business users analyze data without relying on IT teams, using pre-built metrics and AI-powered answers. And Klips lets you create real-time visualizations with custom formulas and layouts.
Key features you’ll love
- A pre-built metric catalog for easy dashboard building
- Automated metric syncing with data warehouses
- A PowerMetrics AI chat interface that creates visualizations from your questions
- Centralized metrics for consistent reporting (PowerMetrics)
- Excel-like formulas for custom data results (Klips)
- Custom themes and advanced HTML/CSS/JS options (Klips)
Ease of use
PowerMetrics and Klips each offer distinct experiences tailored to different user needs:
PowerMetrics:
- Intuitive interface: Yes—it’s a drag-and-drop, no-code experience
- Modern design: Yes—it has a clean interface with essential visualizations
- Customization options: Low—pre-built metrics and templates
- Learning curve: Low—designed for quick setup and analysis
Klips:
- Intuitive interface: No—it requires technical skills to navigate successfully
- Modern design: Yes—there’s flexible visualization options
- Customization options: High—it supports custom code and formulas
- Learning curve: Moderate to high—it’s meant for advanced users
Integrations
PowerMetrics has over 60 integrations with business intelligence and data tools, including:
- Google Analytics
- HubSpot
- Salesforce
- QuickBooks
- Microsoft Excel
- MySQL
- Xero
- Shopify
- Facebook Ads
- Stripe
And Klips offers an even wider range of integrations, plugging into over 100 tools like:
- Amazon Redshift
- Dropbox
- GitHub
- LinkedIn Ads
- Marketo
- Mailchimp
- Intercom
- Smartsheet
- Trello
- Zapier
Pros & cons
| Pros | Cons |
|---|---|
| Flexible options for different users | Two separate products may cause confusion or even cause data silos |
| Extensive customization capabilities with Klips | Klips requires technical knowledge and coding skills for full utilization |
| Real-time data syncing | PowerMetrics may be too basic |
| Strong data control features | |
| Pre-built metric templates | |
| Lots of integration options |
Use cases and ideal users
- PowerMetrics: Data teams wanting to enable business users to do their own analytics
- Klips: Organizations with complex data needs seeking highly customizable dashboards
What others say about Klipfolio
“I love the full range of capabilities that are possible when building a Klipfolio dashboard (specifically with their Klips product). Unlike the majority of BI platforms, building with Klipfolio feels more like designing a web page than configuring a single chart at a time. HTML and Javascript can be written directly into the Klips and utilize the same data sources as the out of the box components, powering even more creative solutions.”
—Graham, G2
“Best dashboarding tool in the market. Easy to set up, great support, very good pricing system, countless integrations, beautiful design and highly customizable.”
—Hurmet, G2
Pricing
There are three plans available:
- Free
- Professional: $56 per month, billed annually
- Business: Custom pricing (Contact for details)
Sign up to get started for free.
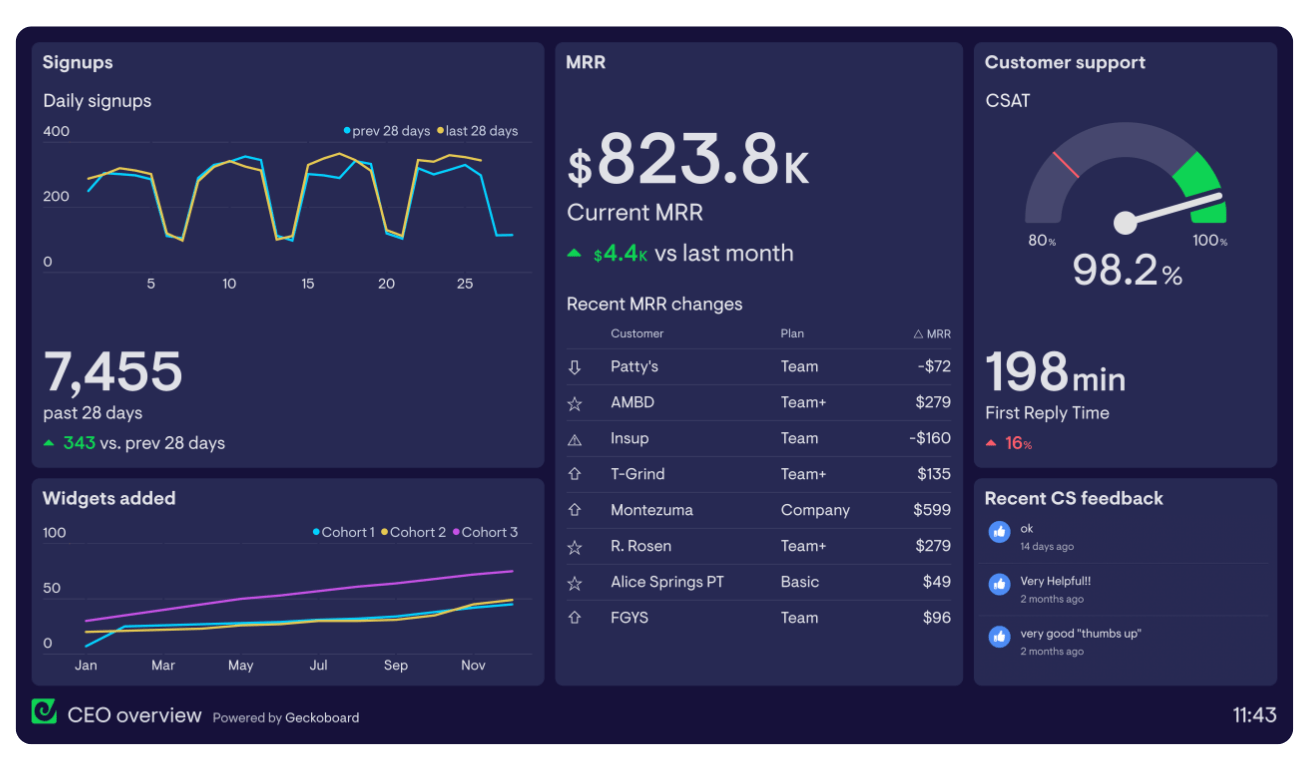
6. Geckoboard
Founded in: 2010
Average customer ratings: G2: 4.3 (48 reviews); Capterra: 4.6 (1,1721 reviews)
Ideal for: Business leaders who need straightforward, accessible KPI visibility and want to share dashboards across various channels
Overview
Geckoboard is a straightforward KPI platform designed for business leaders. It connects with over 90 data sources to help you visualize your key metrics in one place, in real time. Plus, you can share these dashboards in whichever ways work best for your team—even on TV displays in the office.
Here’s a quick guide to setting up a TV dashboard with Geckoboard:
Key features you’ll love
- A simple drag-and-drop dashboard builder for fast setup
- Dashboards optimized for TV screens so teams can easily view metrics from anywhere in an office
- Automated metric snapshots for quick email and Slack updates
- Real-time data refreshes
- Custom alerts for important KPI changes
- Mobile-friendly dashboard access
- Multiple dashboard templates for different departments
Ease of use
Geckoboard prioritizes simplicity over complexity, making it a great choice for beginners. You can connect data sources and build dashboards in minutes—without any special training.
- Intuitive interface: Yes—it’s straightforward and user-friendly
- Modern design: Yes—it has a clean and uncluttered look
- Customization options: Moderate—it’s mostly focused on basic visualizations
- Learning curve: Low—it’s designed for quick adoption
Integrations
Geckoboard has over 90 integrations, including:
- Google Analytics
- Google Sheets
- HubSpot
- Salesforce
- QuickBooks Online
- Shopify
- Stripe for SaaS
- Facebook Ads
- Zendesk Support
- PayPal
Pros & cons
| Pros | Cons |
|---|---|
| Simple, intuitive interface | Limited data combination capabilities |
| Quick setup with pre-built integrations | Can’t create custom calculations |
| Real-time data updates | Fewer visualization options than BI tools |
| Can be easily presented on TV displays | Requires workarounds for unsupported data sources |
| Unlimited dashboard viewers (add users with view-only rights at no extra cost) | |
| No technical expertise required to build dashboards |
Use cases and ideal users
- Business leaders who need clear, real-time KPI visibility
- Hybrid and in-office teams who want to share dashboards in different channels, including on TV screens
- Companies without dedicated data analysts who need a simple way to build dashboards
What others say about Geckoboard
“It is possible to create dashboards that automatically refresh. The people in the office love it because they don’t have to look for a report in our CRM.”
—Mizanur, Capterra
“Dashboards are easy to create and deploy, there are some very pretty pre-built ones. Another positive thing is how the Geckoboard Team constantly adds new data sources to increase compatibility.”
—Eliel, Capterra
Pricing
There are three plans available for Geckoboard:
- Essential: $44 per month, billed annually
- Pro: $175 per month, billed annually
- Scale: $615 per month, billed annually
Sign up for a 14-day free trial to check Geckoboard out.
7. Looker
Founded in: 2016
Average customer ratings: G2: 4.4 (776 reviews); Capterra: 4.6 (259 reviews)
Ideal for: Marketing teams tracking digital performance, small businesses looking for a budget-friendly solution, and companies that rely heavily on Google services
Overview
Looker Studio (formerly Google Data Studio) is a free data visualization platform that helps you turn data into dashboards and reports.
It connects seamlessly with Google products like Google Analytics and Google Sheets, as well as many other data sources. This makes it easy to import and visualize your data, especially if you’re already using Google’s tools.
Here’s a quick demo of how to build a dashboard with Looker:
Key features you’ll love
- Over 1,000+ data source connections, from Google Analytics to BigQuery
- Real-time data processing gives you the most up-to-date information
- Templates to get started quickly (mainly for marketing and sales)
- Layout editor makes it easy to edit dashboards
- Ability to embed reports on a webpage or presentation to show live data
Ease of use
- Intuitive interface: Yes—drag-and-drop functionality with familiar Google design
- Modern design: Yes—clean interface with interactive charts
- Customization options: High—extensive options for visualizing your data
- Learning curve: Medium—there are basic templates available, which are easy to edit, but learning to build dashboards from scratch takes time
Integrations
Looker Studio has over 1,000 integrations, including:
- Google Analytics 4
- Google Ads
- Google Sheets
- BigQuery
- MySQL
- PostgreSQL
- Microsoft Excel
- Salesforce
- Facebook Ads
- HubSpot
Use cases and ideal users
- Marketing teams who need to visualize campaign performance and website analytics
- Organizations using Google tools like Google Sheets, Google Analytics, Google Ads etc. who want a straightforward connection to their dashboard software
- Small to medium businesses looking for a free, powerful reporting solution
Pros & cons
| Pros | Cons |
|---|---|
| Completely free to use | Can be slow with large datasets according to some G2 users |
| Easy to create dashboards and reports, without code | Customization is complex according to one G2 user |
| Seamless integration with Google products | Basic design templates compared to paid tools |
| Active online community | Limited customer support according to a G2 user |
What others say about Looker
“Looker Studio is a great reporting dashboard. It makes it easier to display, analyze, and share data.”
Megan, G2
“I love the way you can present data from multiple sources in one report. I also love the ability to blend different tables and show the information in one chart. It is easy to use and the clients love how interactive the online report is.”
Anne, G2
Pricing
Looker Studio is free. Sign up to use it for free.
Why Scoro could be the right dashboard software for you
Every business wants different things from their KPI tools. But if you’re looking for a KPI tracker that grows with your company, brings all your data into one place, and gives every team real-time visibility into what matters, Scoro might be your perfect match.
Take it from professional services company Significans Automation.
Its teams struggled with scattered data and lack of visibility into key business areas. But after switching to Scoro and using our real-time dashboards and reports, the company improved its team efficiency by 70% and its business processes by 80%.
See how you can boost your own business with Scoro’s 14-day free trial.