
Many execs at professional services firms forecast revenue based on specific project data.
While this granularity might seem like the best option, there’s actually a better (and easier) way to predict income:
Top-down forecasting.
A top-down approach gives you the speed and flexibility you need to make strategic decisions without getting lost in the details.
Keep reading to learn the basics and how to implement it at your company.
Top-down vs. bottom-up forecasting
Both approaches have their place. But they serve different purposes—and different employees.
Bottom-up forecasting is great for project managers because it relies on task-level details.
This helps them allocate resources, track timelines, and make sure nothing falls through the cracks.
It’s the right framework when they need to know exactly who’s doing what next Tuesday.
Top-down forecasting is built specifically for executive leaders. With less detail required, it helps you model revenue scenarios, plan hiring, and make strategic decisions faster.
Here’s the breakdown on how they compare:
| Bottom-up | Top-down | |
|---|---|---|
| Purpose | Delivery management and resource allocation | Executive strategy and scenario planning |
| Time to update | Hours or days | Minutes |
| Level of detail | Task-level granularity | Project and client-level views |
| Best for | Project managers planning weekly schedules | Leadership making fast decisions |
| When scope changes | Must update hundreds of line items | Update a few high-level assumptions |
Why top-down forecasting is better for executives
As Parakeeto CEO Marcel Petitpas recently said on the Scoro podcast: “Its simplicity is the feature, not the bug.”
A top-down approach delivers three key advantages that matter to leadership teams:
- It’s fast: Update assumptions and generate new forecasts in minutes, not hours
- It’s flexible: Test “what-if” scenarios and answer business questions like, “What happens to our revenue if this deal closes next quarter instead of this one?”
- It’s good enough: You’re aiming for directional accuracy—enough to understand if you have design capacity for Q3 or if that new contract will push you over your revenue target
It helps you answer the questions that keep you up at night, like:
- Will we hit this quarter’s revenue target?
- Can we afford to hire now?
- What’s the revenue impact if we lose this deal?
- How much runway do we have if the market stays tough?
Ultimately, you don’t need to know which consultant is doing what on day 87 of a project.
You just need to know how much strategy, design, or development work is required—and whether you have the resources to deliver it profitably.
Marcel puts it perfectly:
The problem that I see most agencies face is they’re trying to use what their project managers are doing each week—deciding who’s working on what task—to have these fluid conversations. And it does not work.
Execs need a forecasting system that’s “really quick, needs to be really fluid, and often needs to be abstracted away from detail.”
High-level strategic decisions shouldn’t get stalled while waiting for project managers to update every task assignment.
You need immediate, reliable answers based on the big picture—and that’s exactly what top-down forecasting delivers.
Want to dive deeper?
In this Scoro podcast episode, Marcel shares the biggest mistakes agencies make with forecasting—and how a top-down model helps leaders scale with clarity and confidence.
Top-down revenue forecasting best practices
Creating an effective top-down forecasting system starts with shifting how you think about revenue prediction. Instead of tracking every detail, focus on high-level trends that influence your business.
For the best results, follow these best practices:
Start forecasting at the sales stage
Many firms wait until after project kickoff to begin revenue forecasting. But this is backwards.
Forecasting should start the moment you scope a deal, not when delivery begins.
This way, you get immediate visibility into potential revenue and can flag cash flow gaps before they hit.
And you’ll avoid nasty surprises—like quarterly targets suddenly becoming unreachable because you miscalculated timing.
Here’s a simple approach:
Take your estimated deal value and project duration and spread that revenue across the upcoming months.
You don’t need a detailed scope of work—a ballpark estimate of the project costs is enough for forecasting purposes.
You can stick with an equal split or apply a custom schedule that reflects your typical delivery phases.
For example, you might break down a $60,000 project running from September to November into $20,000 per month.
Or you might split it as $30,000, $20,000, then $10,000 if you typically do more work upfront. The key is adjusting the start month so your forecasted revenue lands in the correct reporting period.
How to do this in Scoro
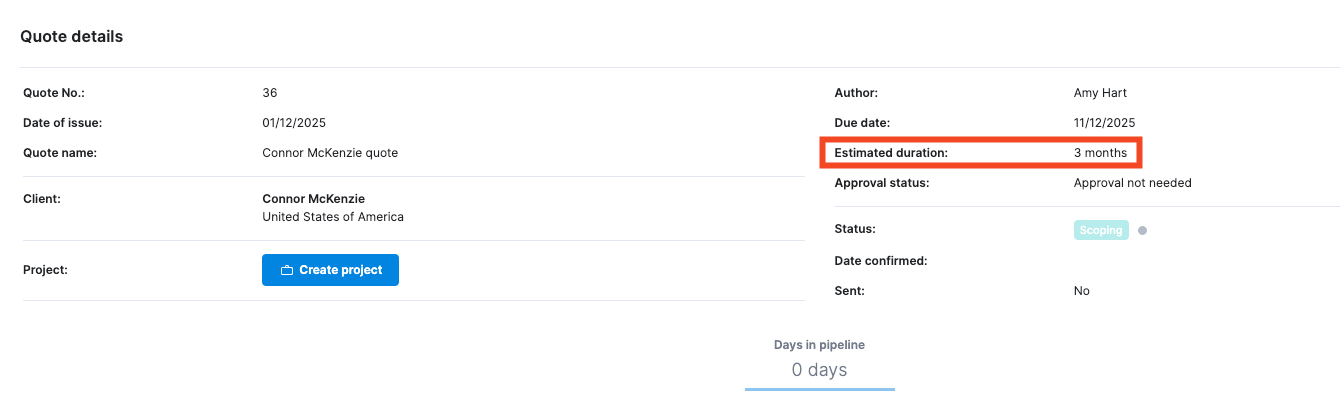
Revenue forecasting automatically begins when you create a quote. Enter the project details, including pricing, and select an “Estimated duration” for your project.
By default, this is set to one month, but you can adjust it to reflect your actual project timeline. As soon as you change the duration, Scoro automatically redistributes the quoted amount equally across those months.
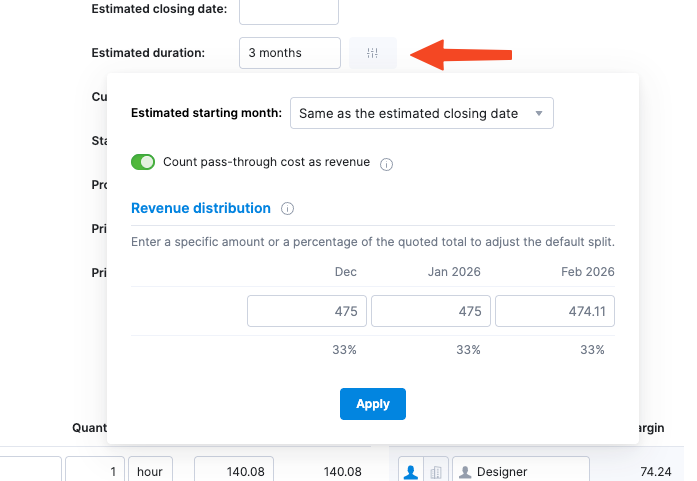
For more control over your revenue distribution, click the graph icon next to the estimated duration field.
Here, you can:
- Adjust the start month to align with your project timeline
- Manually override specific months with custom values or percentages
- Toggle whether pass-through costs from subcontractors count as full revenue or just your margin
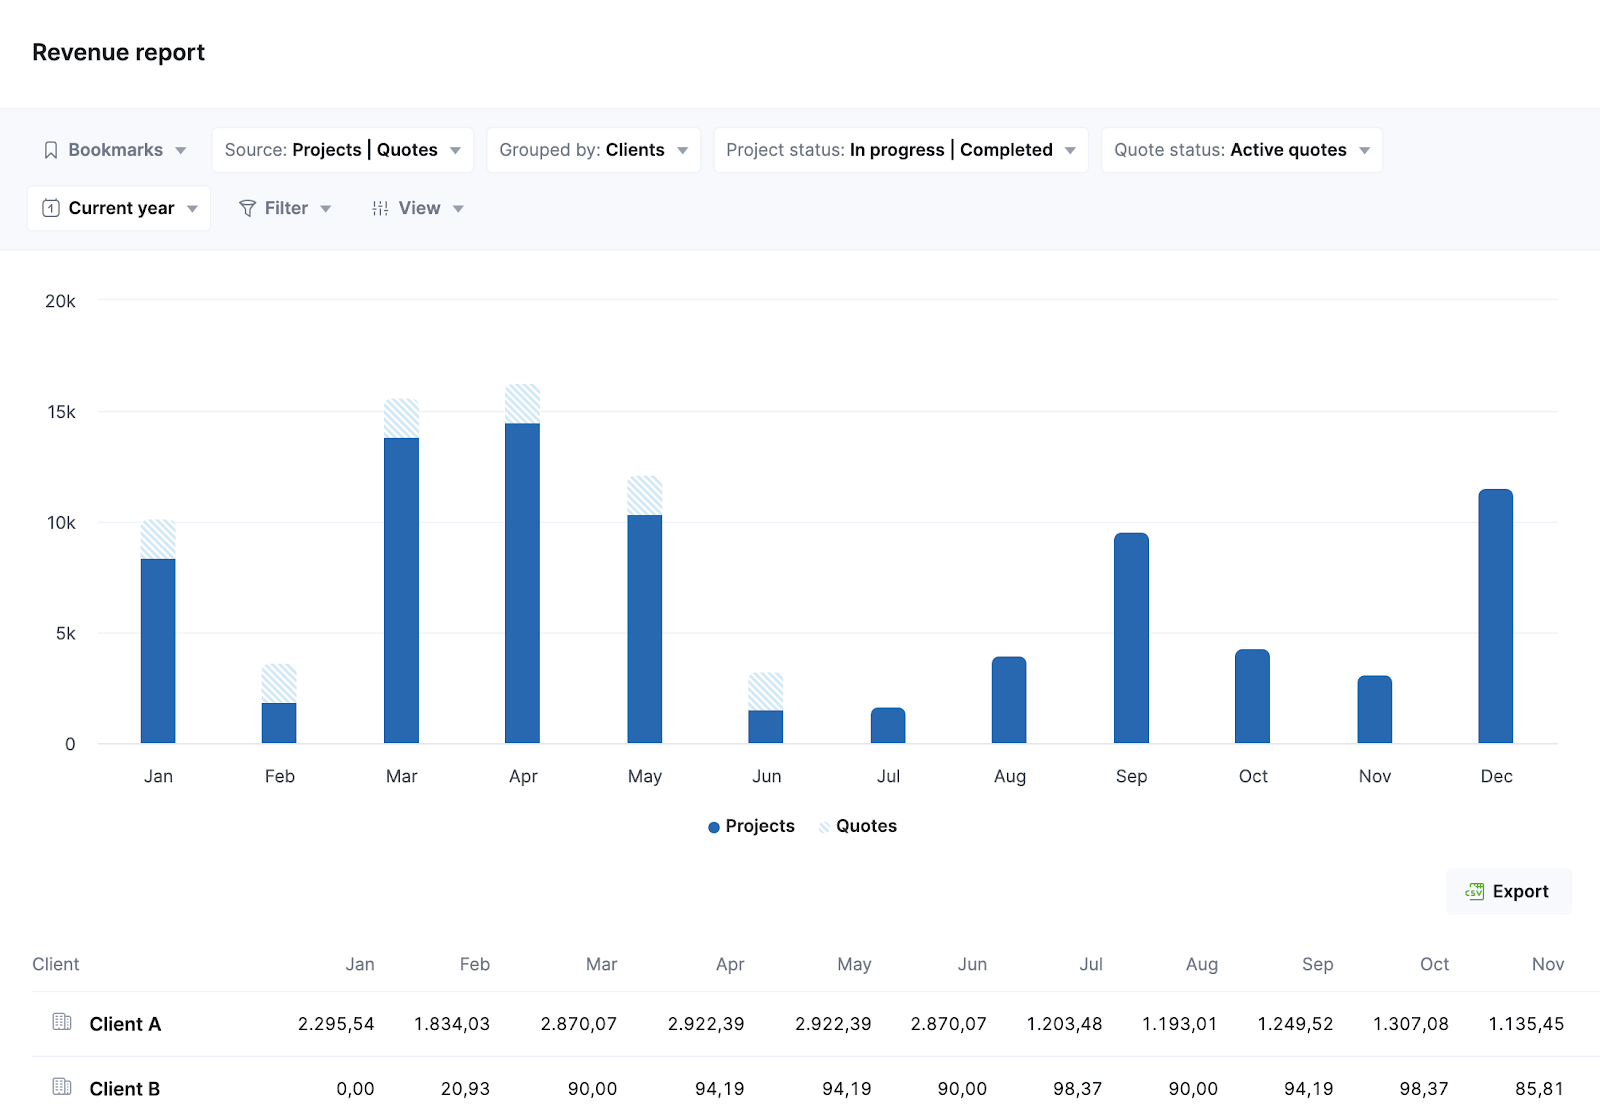
Once you click “Save,” your forecasted pipeline revenue will show up in Scoro’s “Revenue” report—giving you forward-looking financial visibility even before contracts are signed.
In the Revenue Report, you’ll see both pipeline revenue from quotes and confirmed revenue from projects in one place.
You can break this down by client or timeframe and apply probability weighting to quotes for a more realistic forecast. That way, it’s easy to see how much income is already secured versus what’s still in play.
Simplify your service categories
Standardizing your service offerings is more efficient and makes forecasting easier.
When every project is scoped from scratch with unique deliverables, custom pricing, and one-off timelines, forecasting becomes a constant guessing game.
And you lose time because you have to keep evaluating different resource needs and margins.
Instead, create clear services with fixed pricing models, standard delivery assumptions (e.g., hours per unit, team size, typical timelines), and roles.
Repeatable offers mean predictable patterns, which make forecasting and scenario planning faster and more reliable.
For example, instead of “custom web development,” use:
- Strategy (40 hours, senior consultant, $150/hr, 2 weeks)
- Design (80 hours, designer + art director, $120/hr, 4 weeks)
- Development (120 hours, developer team, $100/hr, 6 weeks)
- Testing (20 hours, QA specialist, $90/hr, 1 week)
- Implementation (40 hours, technical lead, $130/hr, 2 weeks)
Or instead of “marketing consulting,” consider:
- Audit (20 hours, senior strategist, $180/hr, 1 week)
- Strategy (60 hours, strategist + analyst, $150/hr, 3 weeks)
- Execution (100 hours, mixed team, $110/hr, 8 weeks)
- Optimization (30 hours, analyst, $120/hr, 2 weeks)
How to do this in Scoro
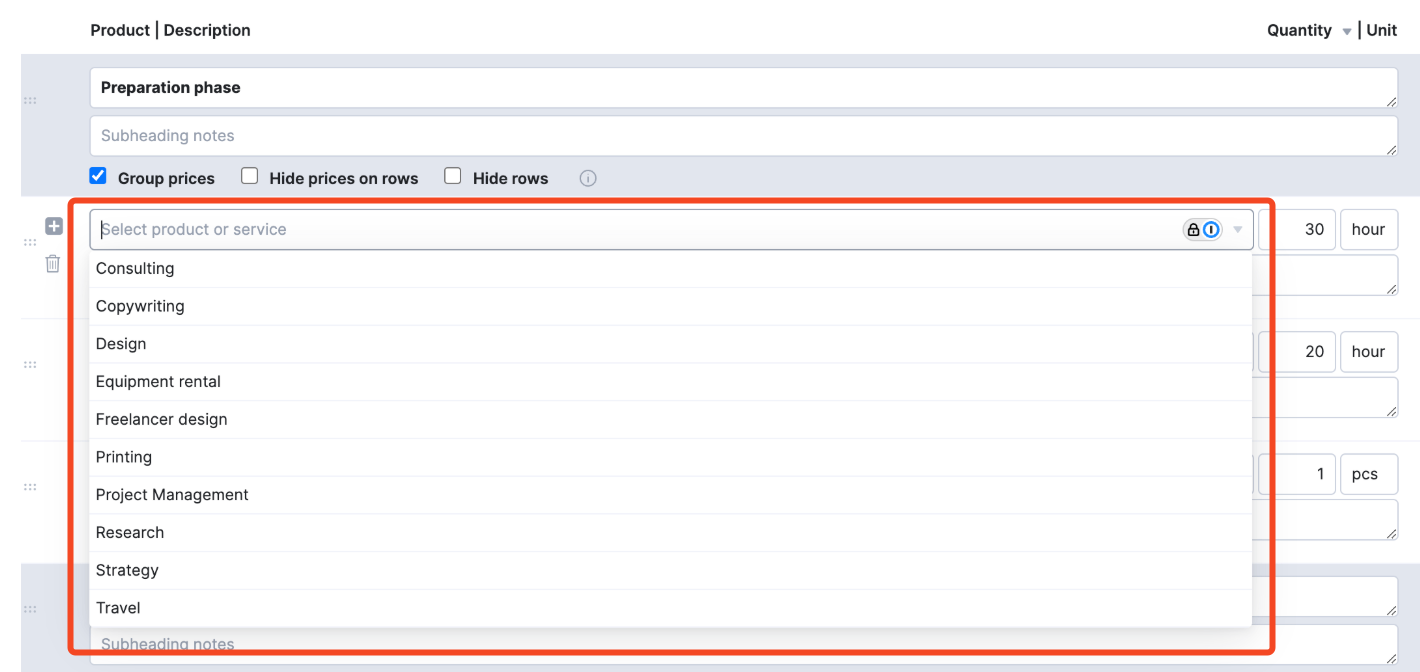
Add your standardized services to Scoro’s product database.
Then, when you create a quote, you can just choose from your predefined services rather than building everything from scratch. This saves you time and keeps revenue predictions accurate.
This information then feeds into reports that you can organize by each service. So you can see exactly where you’re making the most revenue—and where you’re losing the most.
You can also view metrics like billable utilization by role and delivery margin by category, giving you further visibility into which parts of your business drive the best results.
For example, the Pipeline report shows you expected revenue by deal stage:

Monitor revenue in real time
Without live project data, forecasting is useless. You’ll end up with inaccurate numbers that don’t reflect the latest changes. And things change all the time in professional services.
For example, scope creep, delays, overservicing, and staff swaps can all impact revenue predictions. If you don’t catch them in real time, they’ll eat into your income and project profitability.
This is why you need three distinct, connected views of revenue:
- Earned revenue: Work completed (time logged × rates)
- Recognized revenue: What you’re ready to invoice
- Forecasted revenue: Future expected revenue based on remaining project scope
Each type of revenue serves a different purpose. But together, they give you complete, real-time visibility into project financial health.
Further reading: Revenue Recognition: A Guide for Service Firms
How to do this in Scoro
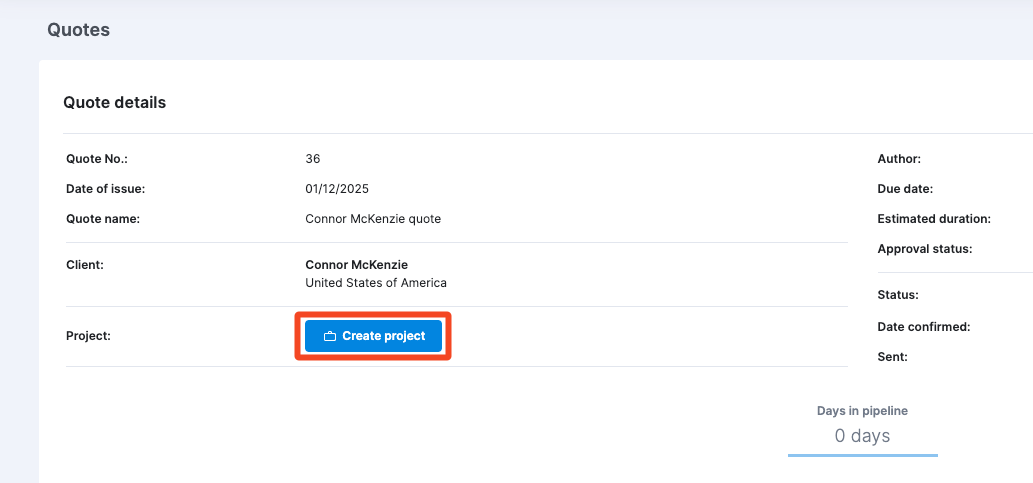
Open your project, navigate to “Budget,” and click the “Revenue” tab. (If you need to turn your quote into a project first, just click “Create project.”)
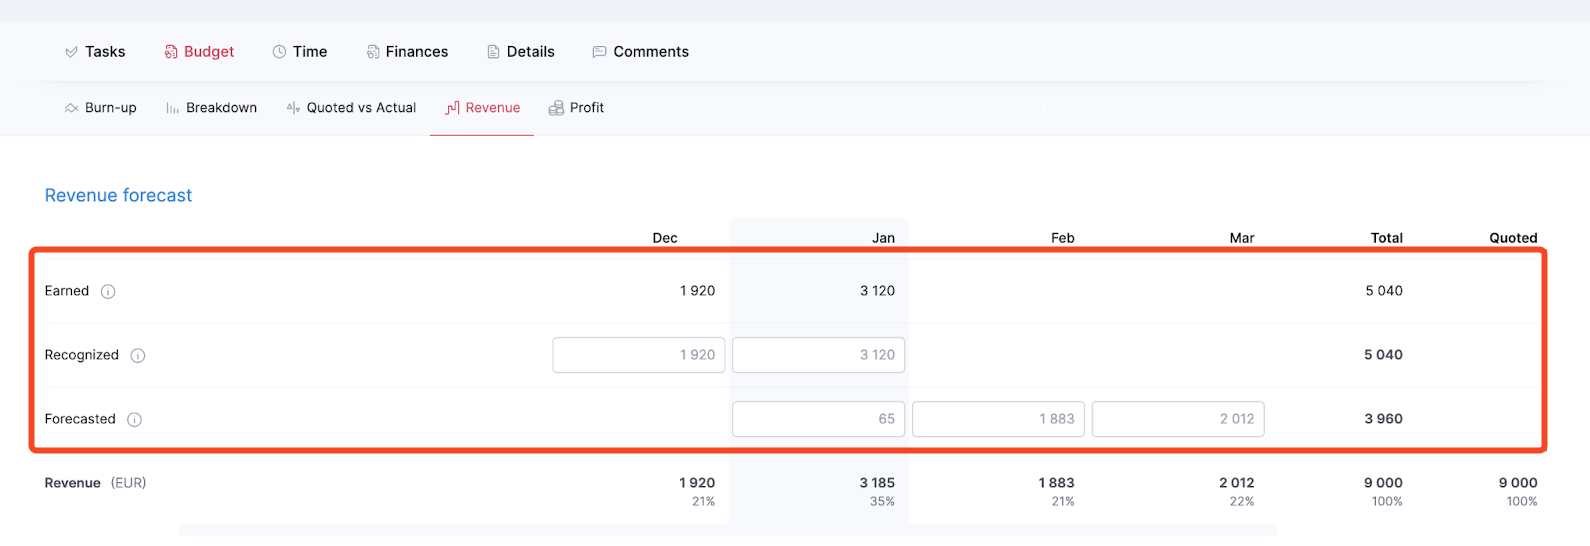
Here, you’ll see three rows:
- Earned revenue: Auto-calculated from logged time
- Recognized revenue: Starts as a copy of “Earned,” but you can manually adjust it for milestone billing or fixed-fee arrangements
- Forecasted revenue: Remaining budget spread across your project timeline
Use these real-time financial insights to better understand your business and inform your decisions.
For example, compare earned vs. forecasted to figure out whether your team is working faster or slower than expected.
Or look at recognized vs. earned to see whether billing schedules align with delivery.
Handle subcontractor work strategically
When you outsource portions of client work (e.g., to creative freelancers, specialized engineering partners, or white-label vendors), you face a critical question:
Should you track the full client-facing revenue or just your retained margin?
- A full revenue basis shows the total project value, which is useful for client-facing reports and portfolio management
- A margin-only basis focuses on what you actually retain, which is better for internal profitability analysis
Your choice directly shapes how you measure profitability—and what story your executive dashboards tell.
Here’s how this plays out in practice:
Say you invoice $50,000 for a video production project but outsource $30,000 of that work. With a full revenue basis, your forecast would show $50,000 in revenue. With a margin-only basis, it would show $20,000.
Whichever approach you choose, the key is to use it consistently across all projects. Otherwise, mixed approaches will make your top-down revenue forecasts unreliable.
How to do this in Scoro
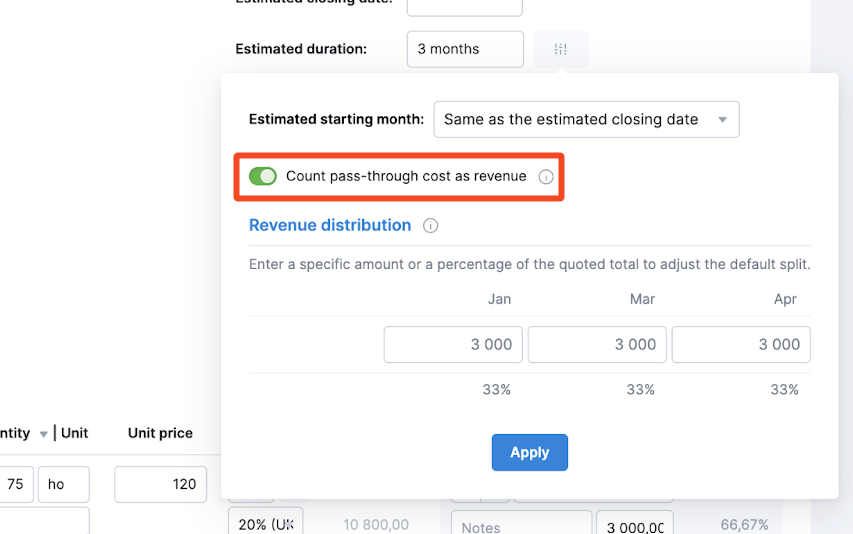
When creating quotes or managing projects that involve outsourced work, you’ll find a toggle option called “Count pass-through cost as revenue.”
Click to use the full revenue basis, or disable it to use the margin-only basis.
Master revenue forecasting
Top-down forecasting gives you a fast, flexible way to model growth, stress-test assumptions about clients and services, and keep the business profitable.
If you’re still buried in bottom-up spreadsheets, it’s time for a change.
Scoro makes top-down forecasting easy for professional services firms. No manual calculations needed.
Take Saentys, a global creative agency who saves two days a month on forecasting with Scoro. Live dashboards help guide executive decision-making. And automated revenue tracking makes it easy to see where they stand.
Want your own accurate revenue predictions?
Try Scoro for free today and get the forecasting capabilities you need to scale your business.