kpi-dashboard-software

What Is a KPI Tracking Dashboard? [Complete Guide]

Business managers often use KPI tracking dashboards that provide a quick overview of their company’s performance and well-being. But What is a KPI dashboard, and how are the right metrics chosen? Read this guide to learn everything you need to know.

Before diving in, let’s start with the basics. What is a KPI? KPI or a key performance indicator is a numeric value that shows whether your team/company is reaching its targets. Monitoring metrics help you to evaluate your business performance and make data-driven decisions to grow faster. If you’d like to find out more and learn how to best use it then this KPI guide will answer all your questions and more.

What is a KPI dashboard?

Let’s start with a quick thought exercise. Imagine a living organism. There are about 37.2 trillion cells in the human body, all of them working in perfect coordination, enabling us to live. Our bodies’ performance is constantly influenced by countless inside and outside forces. To manage all the processes, our brains need to be constantly aware of every process and its performance inside our body.

Now think about your business. Similar to a living organism, its performance is regularly affected by hundreds of activities and processes. To be aware of how your business is doing, you need real-time reporting and a quick overview of every department’s performance.

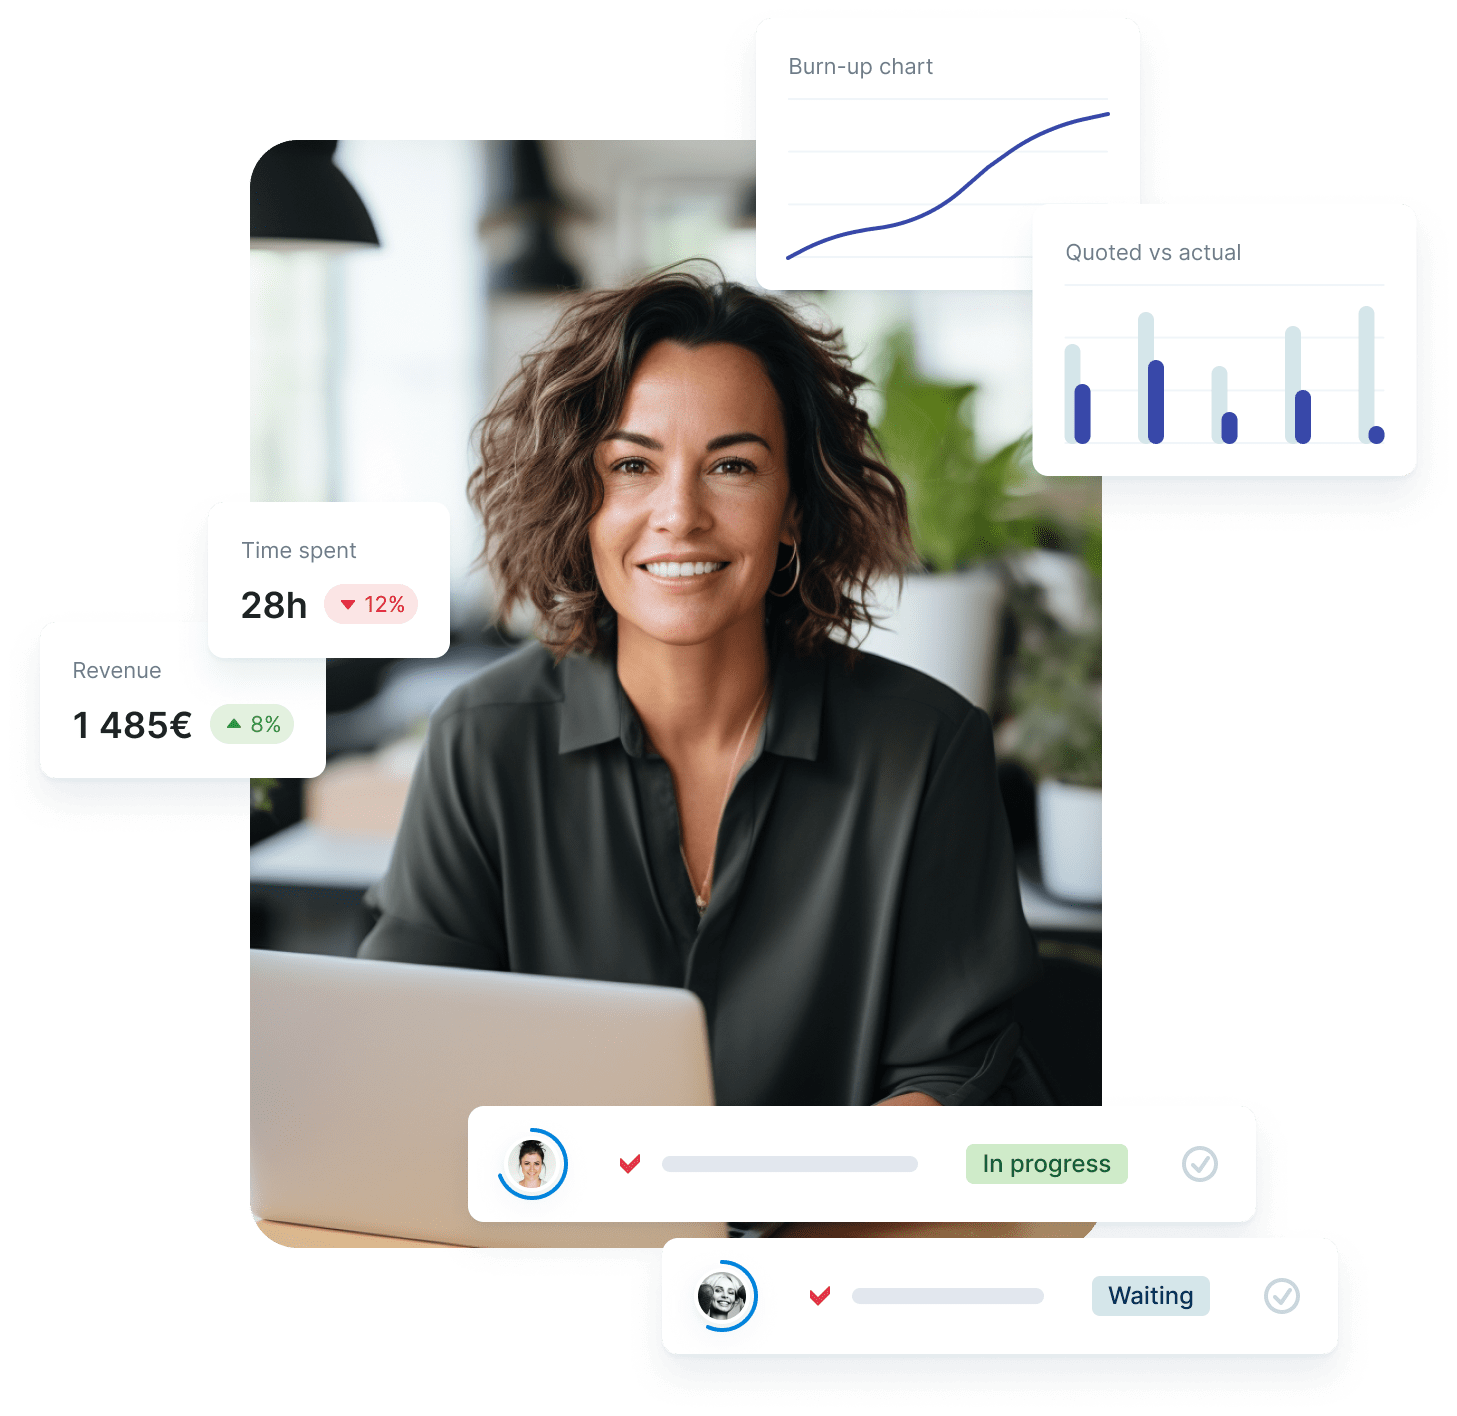
A KPI tracking dashboard collects, groups, organizes, and visualizes the company’s important metrics, providing a quick overview of business performance and expected growth.

By using KPI dashboards, organizations can access their success indicators in real-time and make informed decisions that bring closer to achieving long-term goals.

Let’s have a look at the different KPIs, and explore how they can be applied to the business analysis.

Different types of KPIs

Business KPIs are measurable metrics that evaluate factors crucial to achieving the company’s goals and maintaining growth. A well-framed KPI helps managers to navigate between important business processes and shows whether an organization is achieving its key objectives.

High-level KPIs demonstrate the company’s overall performance while low-level KPIs focus on more narrow goals, for example, sales or project KPIs indicate the performance of particular business departments.

Frequently monitored key performance indicators:

  • Revenue growth rate
  • Net profit
  • Project schedule variance (PSV) (are projects completed in time)
  • Churn rate (how many people stop using the product or service)
  • Average revenue for each customer
  • Customer lifetime value (CLV/LTV)

See examples of highly informative sales metrics, financial KPIs, and universal KPI examples.

Benefits of KPI dashboards

KPI tracking dashboard displays an organization’s key performance indicators and is beneficial in many ways.

The greatest value of a modern business dashboard lies in its ability to provide real-time information about a company’s performance. As a result, business leaders, as well as project teams, can make informed and goal-oriented decisions, acting on actual data instead of a gut feeling.

Moreover, a timely and well-framed KPI dashboard helps to instantly notice problem areas and tackle the problems. Managers that use KPI dashboards daily for getting a quick overview know where to focus their energy and realize if there’s a need to improve any poorly performing process.

The KPIs on a dashboard are chosen and organized according to the user’s needs.

CEO KPI dashboard

CEO dashboard gives an at-a-glance holistic overview of a company’s performance and profitability. As it has a lot of sensitive data on it, it is only used by the company’s CEO and high-level executives. Moreover, the executive dashboard is used to keep track of whether the business reaches its goals and where its problem areas lie.

The KPIs on CEO dashboard include

  • company’s monthly revenue
  • net income
  • revenue growth
  • departments’ performance
  • quarterly goals
  • ROI of large business deals
  • comparison with competitors

CEO dashboard is very similar to the company dashboard as both include KPIs that reflect on the company’s well-being. Company dashboards can be used at management meetings for a quick overview of business performance.

Find out more about CEO dashboard

Project management KPI dashboard

Project team dashboard reflects on the performance of the people working on the same project and gives a quick overview of how the project is doing. It’s a great asset to keep everyone aware of the latest achievements and project goals. Project managers can use their dashboard to notice shortcomings in reaching the goals and keep their eye on the project budget.

The KPIs on a project dashboard include planned budget, time spent on specific tasks, ROI of projects and tasks, team members’ performance, activities completed and time left until the end of the project.

See the complete list of 16 essential project KPIs that every team should monitor.

Sales KPI dashboard

Sales tracking dashboard gives a complete visual overview of the company’s sales performance, including the number of new leads and the value of deals. Sales managers can instantly see which salespeople perform the best and how much income is to be expected from the new deals.

Moreover, a sales dashboard helps to notice when sales start slowing down and allow to act in time by creating a marketing campaign or motivating salespeople.

The KPIs on sales dashboard include the number of new customers and leads, churn rate, the value of new deals, revenue goals, comparison to previous periods and salespeople’s performance.

Learn more about sales KPI dashboard

You can also use your dashboard for benchmarking. When setting up a KPI dashboard, add benchmarks with concrete dates and numeric values so that you get a clear overview of how far you are from achieving a certain goal. Add deadlines for projects and tasks that you wish to finish on time and get reminded to take action when the time’s running short.

Example:

You’ve decided that your company should acquire 150 new customers this month. You add a 150 units benchmark to this month’s customer acquisition KPI. When you check the KPI dashboard on, say, the 15th day of the month, you can see that you’ve acquired 40 customers or 27% of your monthly goal. Meaning that you should speed up your marketing endeavors and search for the source of underperforming sales.

Marketing KPI dashboard

The marketing dashboard displays digital marketing metrics such as the number of monthly new leads (distributed by the lead source, countries, etc.), the budgets spent on various marketing channels, and the performance of email campaigns. A well-defined marketing dashboard gives an instant overview of the marketing team’s performance.

Other metrics on marketing dashboard include cost-per-lead, cost-per-customer, lead-to-customer conversion rate, SEO metrics, website traffic, and much more.

For a quick lesson on marketing metrics, see the list of top 10 marketing KPIs that every small business should measure.

How to create a KPI dashboard?

Business dashboards can be created with specific software that automatically collects and updates data in real time. Excel graphs are not a solution if you want a well-performing and actionable KPI dashboard. Experiment with software like Scoro that lets you bookmark important business metrics and exhibit them on multiple dashboards.

Here’s a list of popular KPI monitoring tools:

An informative business dashboard is described by well-chosen metrics. Before you start creating a KPI tracking dashboard, it is necessary to have a clear vision of your goals and requirements.

Before creating a business dashboard, you need to determine:

1. What is the purpose of your dashboard?

What are the goals that you want to achieve and which problems are you trying to notice with the help of KPIs on the dashboard? In this phase, figure out what performance indicators will be added to your dashboard.

For further tips and information, see the guide to creating a KPI report.

2. Who’s your audience?

Who is going to use the dashboard, and how frequently will they check it? What data is important to those people and what type of visualizations do they prefer?

3. Are your KPIs actionable?

Only monitor key performance indicators that can be acted upon. You should link each KPI with a clear goal and processes that impact the metric. Avoid adding vanity metrics that aren’t relevant to achieving your business goals.

4. What types of charts to use?

There are multiple chart types that look great on a KPI dashboard, each perfect for a different type of metrics: pie charts, tables, bar charts, line charts. Define the metrics you want to visualize and find the best chart type to report on the data.

Once you have answered these four questions, it’s time to start compiling your first KPI dashboard. Place closely related metrics next to each other, creating a linear flow that’s easy to follow. Use colors to bring life to your performance dashboard and add benchmarks to make the data easy to evaluate.


By now, you should have a brief overview of the purpose and possibilities of a KPI tracking dashboard. By creating multiple dashboards with relevant information, companies can start to benefit from comprehensive and actionable reporting.

Remember to frequently check whether all the metrics on your dashboards are still relevant and if the data is updated in real-time.

Everything about your business, one click away

Read on: