

Growth doesn’t fall apart because you don’t have enough leads. It falls apart when no one agrees on what your business data actually means.
Marcel Petitpas, CEO of Parakeeto, talked with us about the true cost of misaligned metrics and how to build a shared, consistent system for tracking what matters.
The cost of misalignment: How it kills clarity, efficiency, and profit
Ask a CEO, CFO, and project manager what ‘utilization rate’ means. You’ll get three different answers.
You might think you’re all talking about the same thing. But new hires can have varying definitions of certain metrics. And team members might look at different KPIs from slightly different angles.
Without clear, standardized definitions, you’re left operating on a messy patchwork of assumptions. And the results aren’t pretty:
- Lack of clarity. Disagreements over utilization, cost rates, or profitability can stem from different formulas—not different results.
- Lack of direction. Leaders aren’t interpreting the data the same way or with the same benchmarks in mind. It gets difficult to decide what to do next or how to improve results.
- Lack of true profitability. Profit leaks go undetected because the data isn’t clear. No single source of truth—and vague reporting—can cause numbers to look better than they are.
- Lack of efficiency. Mismatched numbers lead to poor pricing strategies, under- (and over-)staffing, and inaccurate pipeline planning.
“Alignment matters more than ambition,” Marcel says. “You can’t scale decision-making if your team’s not speaking the same language when it comes to the numbers.”
Learn more from Marcel in the full episode of “The Handbook” here:
7 growth metrics every professional services firm must align on
More data doesn’t automatically equal better business results—especially when your team is already struggling to get on the same page.
Instead, focus on standardizing these seven foundational metrics. Calculate and track them consistently, and it’ll be much easier to make the best decisions for your company.
1. Utilization rates (resource and billable)
Utilization rates tell you how busy your team is and how much of their time is spent producing revenue.
Overutilization can signal potential burnout, scope creep, and the need to hire. Under-utilization points to (potential) lost revenue and poor resource management.
There are two types of utilization to look at:
Resource utilization measures how much time your team spends on any work-related tasks. Optimal resource utilization is generally between 80-90%.
- Formula: (Total hours spent on work activities / total available working hours) x 100
- Example: A team member who logs six hours of work in a standard eight-hour day has a 75% resource utilization rate (six logged hours / eight available hours x 100).
Billable utilization measures how much time your team members spend on work that generates revenue.
Optimal billable utilization depends on the role, but is generally around 75% for producers and ICs, and 35-40% for support roles and managers.
Track utilization with a time tracking tool that feeds into automated reports.
With professional services automation (PSA) software like Scoro, the color-coded “Utilization” report quickly shows you each team member’s resource utilization rates and logged hours. So it’s easy to flag capacity issues and rebalance workloads.
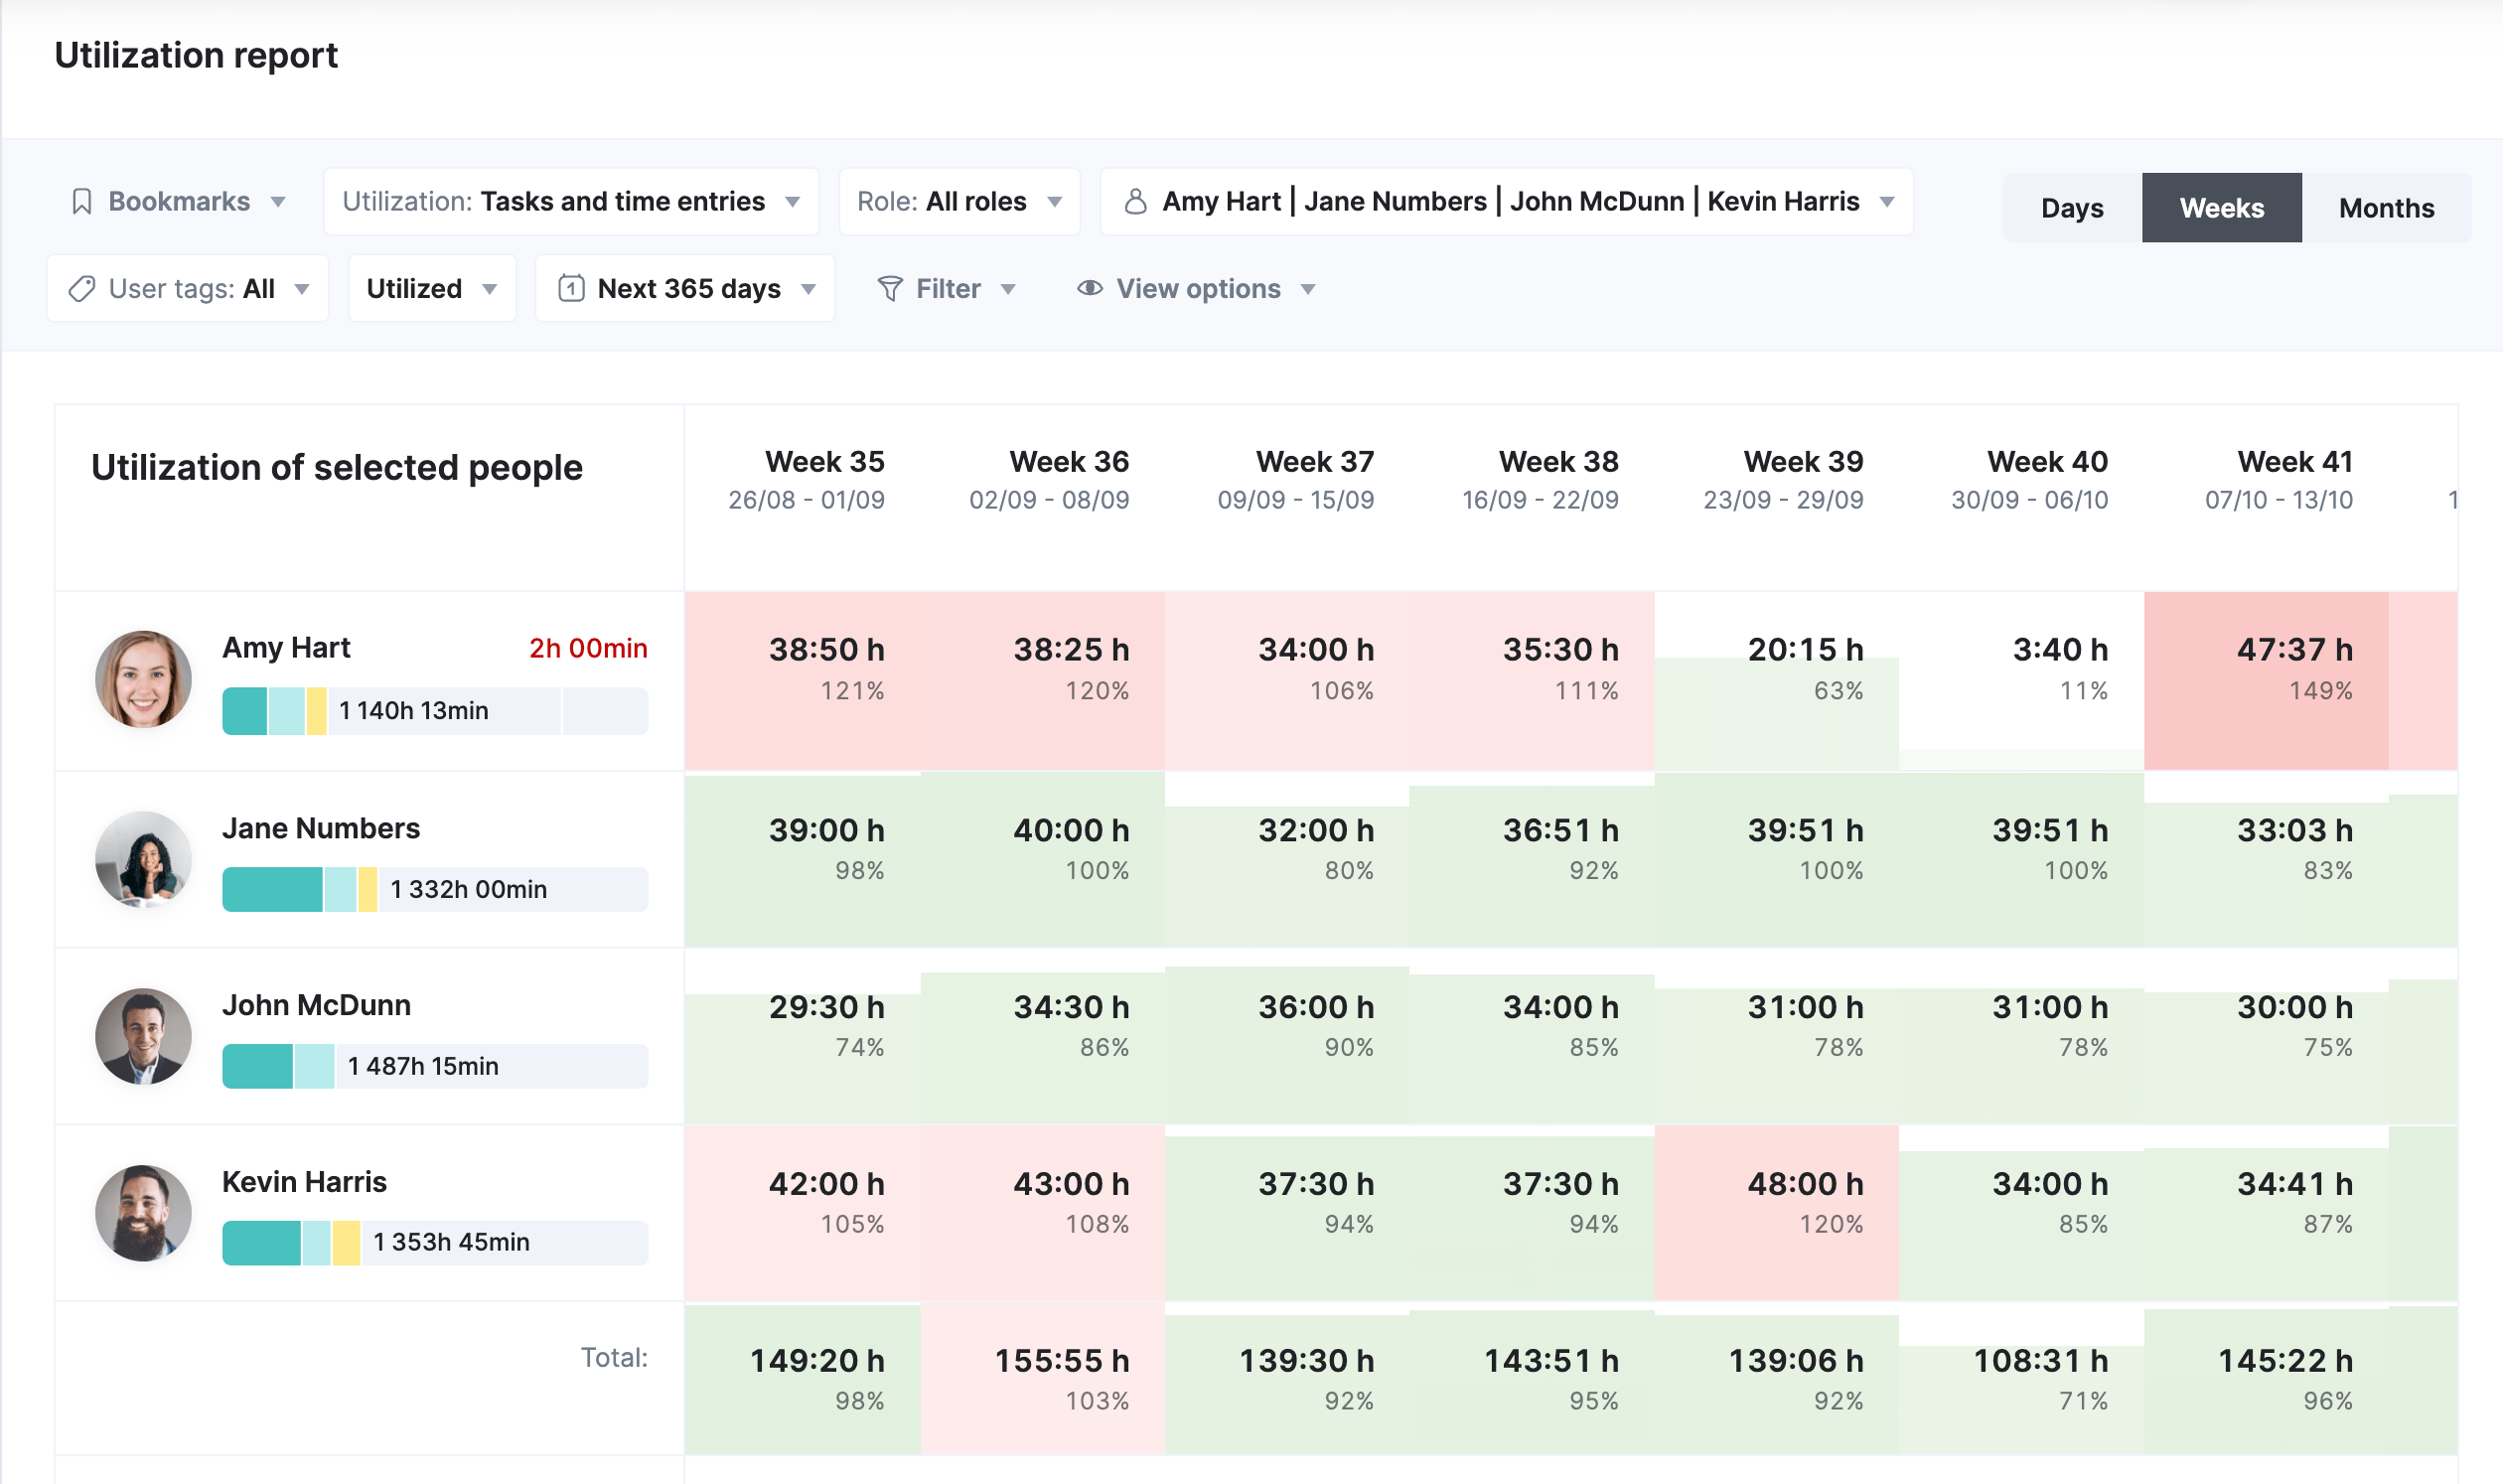
To only see billable utilization, just click “Filter” > “Activity Types” > “Billable.”
2. Average Billable Rate (ABR)
Average Billable Rate (ABR) measures how much you’re charging clients per hour, given the total amount of time spent on their work and your total revenue from them.
A lower ABR can act as an early warning sign of potential profitability issues.
If it starts to decline, your team is probably working more hours than you planned.
And even though you’re bringing in your anticipated income, profits dip because of the cost of those extra hours.
For example, a drop in ABR from $150 to $135 per hour could easily add up to over $100,000 in lost profits over a quarter for a 20-person team.
Calculate your ABR with this formula:
Total billable revenue / total billable hours = ABR
Say your business brought in $400,000 in revenue this quarter and billed 3,500 hours. Your ABR would be $114 ($400,000 / 3,500).
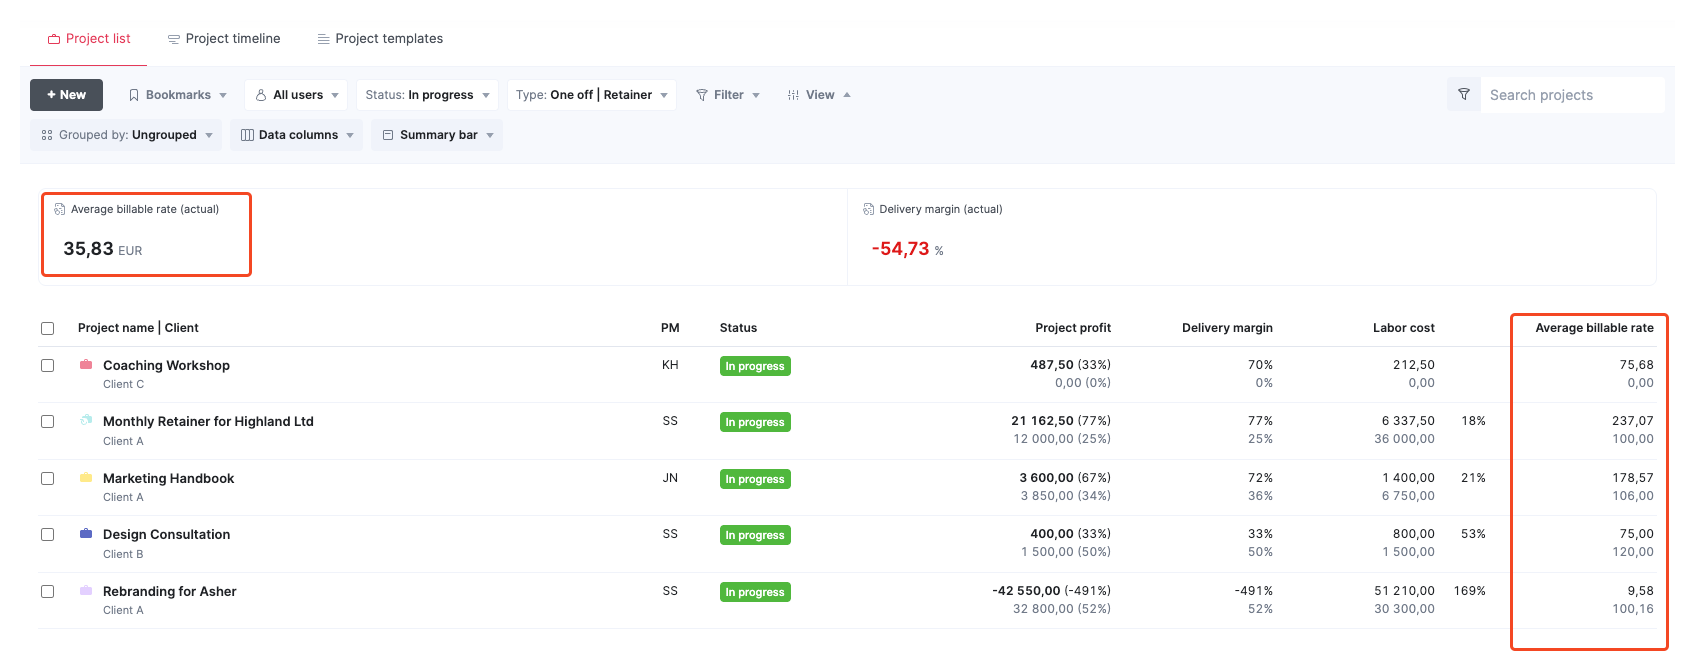
In Scoro, you can monitor your ABR directly from the Project list view:
- Open “Projects” > “Project list“
- Click the “Summary bar” dropdown and select “Average billable rate (actual)“
- In the “Data columns” dropdown, choose “Average billable rate“
Then, you’ll see your total ABR (on top) and per project (in each respective row).
Review which projects are pulling your ABR down. Low rates may point to scope creep, heavy discounting, or too much time logged on non-billable tasks.
High rates highlight where your pricing and delivery are most profitable.
3. Average Cost Per Hour
Average Cost Per Hour (ACPH) tells you how much it actually costs to deliver work to a client.
Tracking your ACPH is crucial for figuring out how to price services to cover your expenses and stay profitable.
Otherwise, it can quickly increase when expenses rise or billable hours drop. And if you don’t realize it, this higher ACPH will quickly (and quietly) eat into your profits.
So review your ACPH regularly—at least once per quarter.
Calculate it with this formula:
Total annual costs / total annual capacity = ACPH
Say the total annual cost for employing your team of five is $397,000.
If each team member has 35 billable hours available and receives an average of three weeks of annual PTO, your total annual capacity would be 8,575 hours.
So you’d calculate your ACPH as: $397,000 / 8,575 = $46/hour.
Scoro doesn’t calculate ACPH automatically, but the building blocks are already in the platform:
- “Labor cost” is tracked for each project.
- “Total done” shows the hours logged.
You’ll find both in the “Project list” view. Use them together to work out ACPH per project, or roll them up across clients.
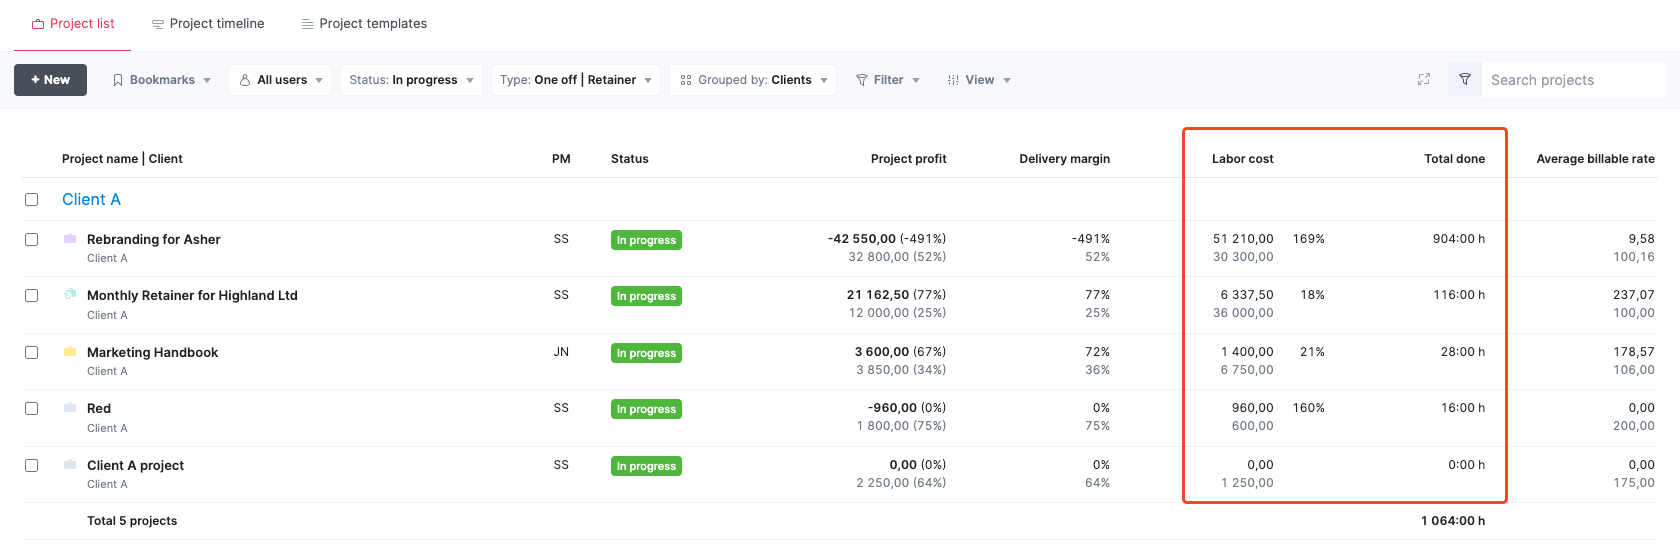
And if you want to run more detailed calculations, you can export this data from Scoro to Excel/Sheets for further analysis.
Top Tip
Make sure your labor cost inputs in Scoro include benefits, taxes, equipment, and training—not just salaries. Otherwise, your ACPH will look lower than it really is.
4. Gross Income
Gross Income measures your true top-line revenue after accounting for pass-through costs. This shows you how much you’re actually earning.
Many firms make the mistake of looking only at total revenue. But if a good chunk of that revenue is paying for pass-through costs like supplies and contractors, you’re making less than you think.
Not accounting for those pass-through costs leads to overestimating your financial health, growth, and profitability.
Calculate your gross income with this formula:
Total revenue – (bills + expenses) = Gross income
Say you have:
- $250,000 of total income
- $30,000 in bills (equipment and licenses) from those projects
- $20,000 in expenses (such as contractor costs)
Your gross income would be $200,000 ($250,000 income – ($30,000 bills + $20,000 expenses).
Which is $50,000 less than your initial total income.
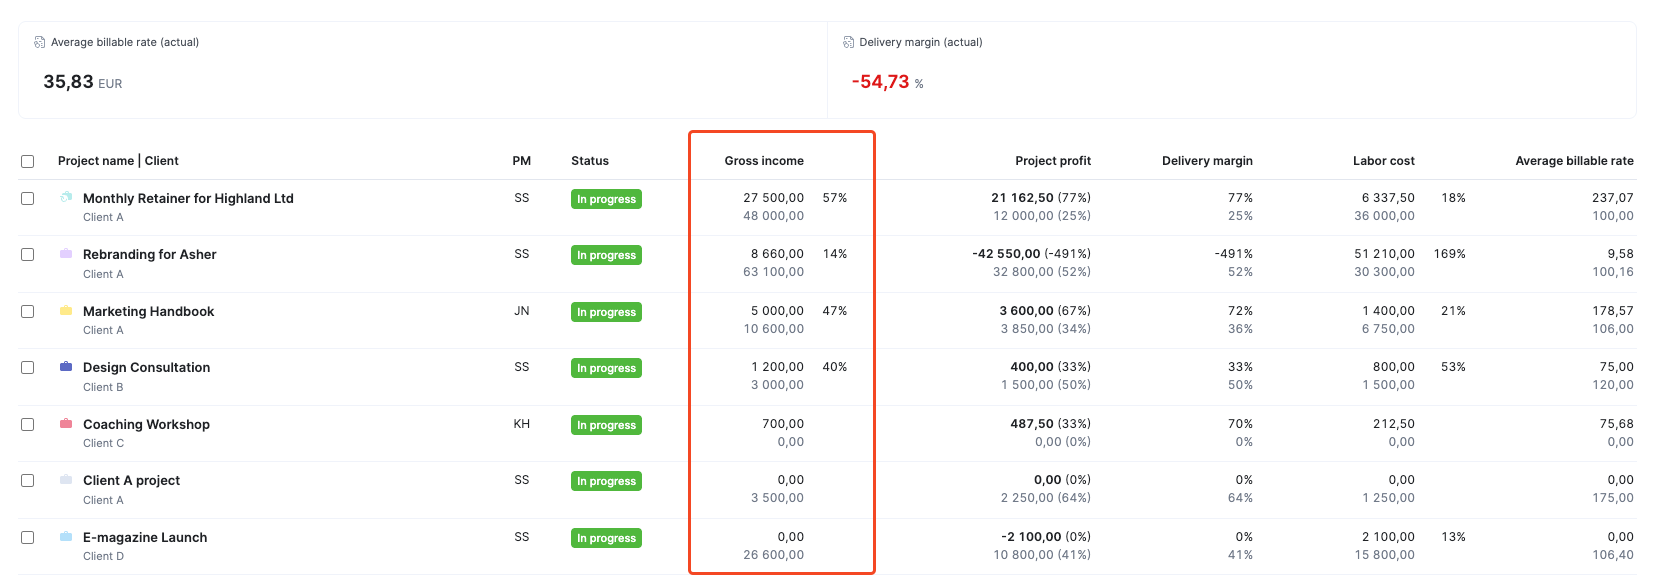
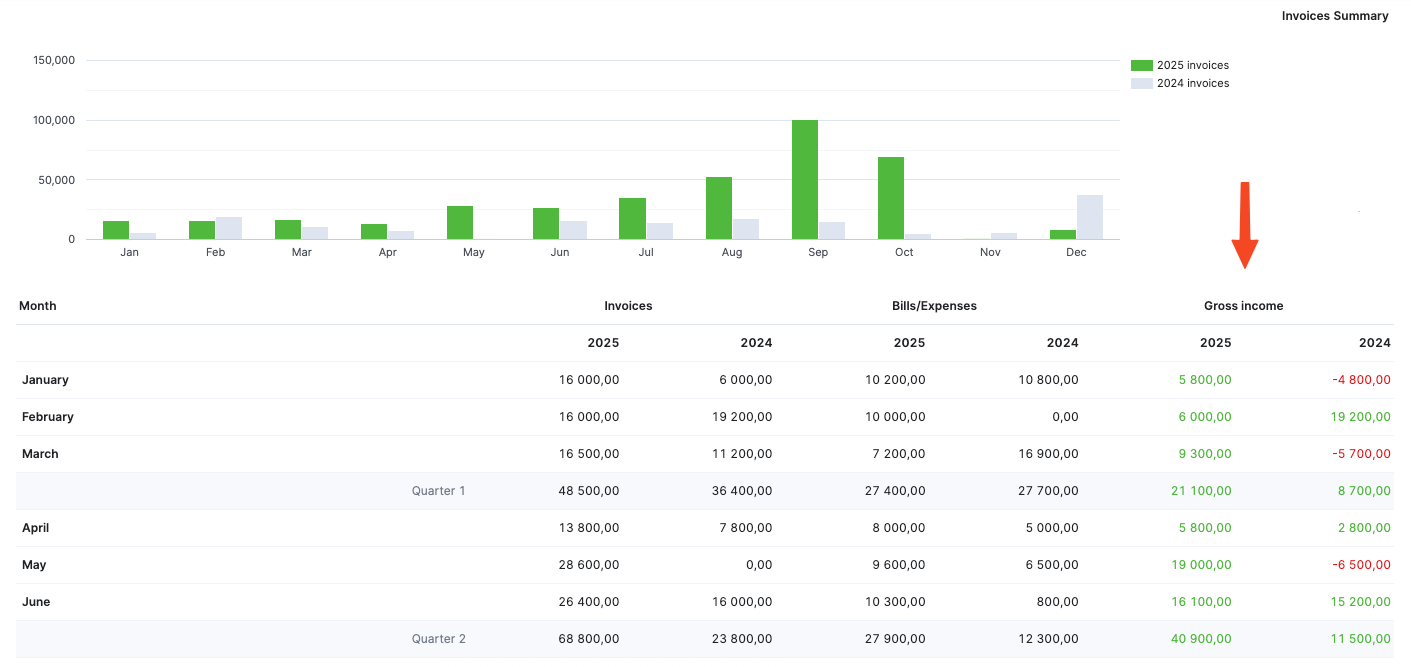
To skip manually calculating your gross, go to Scoro’s “Project list” view and click “Data columns” > “Gross income.”
Then, you’ll see both the actual gross income (in black) and the quoted gross income (in gray) per project. So you can easily figure out which ones are driving the highest revenue—and which cost more than expected.
For your overall gross income, check the “Financial” section in Scoro’s “Summary” report.
5. Delivery margin
Delivery margin tells you how much profit is left over from gross revenue (your AGI) after you cover delivery costs, aka labor costs.
Tracking delivery margins goes one step further than AGI. While AGI tells you about your overall revenue, delivery margins focus on profit. It helps you:
- Identify the most profitable projects your team is working on
- See if your business is actually profitable after accounting for all expenses
- Evaluate how efficiently you’re delivering work
You want to aim for a delivery margin between 55-75%. This signals efficient pricing and costs. And helps you stay profitable.
For example, if you only have 20% delivery margins, that means you’re spending most of the revenue from a project on getting the work done.
Here’s how you calculate it:
((AGI – Delivery Costs) / AGI) x 100 = Delivery margin
Take your gross revenue (AGI) from the previous step (in this case, it’s $200,000).
Next, calculate delivery costs (i.e., labor costs and other project-related costs).
Let’s say you had $120,000 in delivery costs.
With these numbers, you’d calculate your delivery margin as:
(($200,000 – $120,000) / $200,000) x 100 = 40% delivery margin
So that means you took home 40% of the project’s total revenue, with the remaining 60% paying for project costs.
While you can calculate your margins manually, it takes a lot of time—and opens the door for errors.
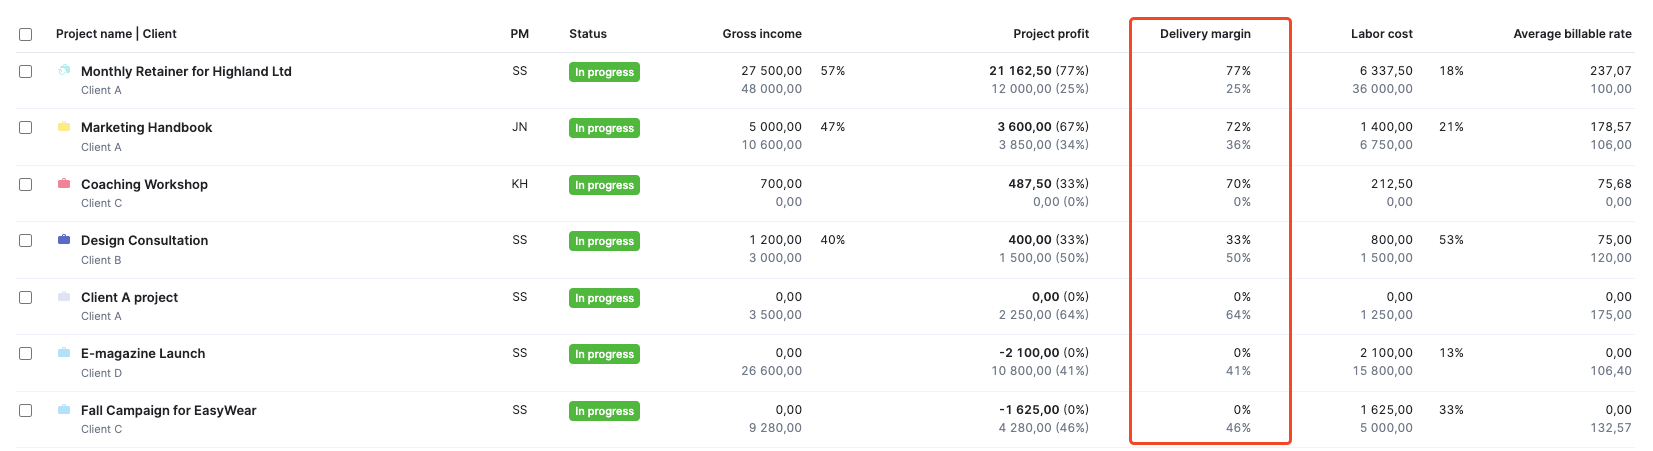
In Scoro, go to “Project list” view. Then, click the “View” > “Delivery margin” in the “Data columns.”
6. Pipeline coverage
Pipeline coverage tells you whether you have enough planned work to keep your team busy—and your business profitable.
- Too much incoming work, and you’ve got a recipe for disaster—burning out your team and risking quality issues and missed deadlines
- Too little incoming work, and you miss out on opportunities to bring in revenue and jeopardize profitability
In general, recommended pipeline coverage is 3:1. That is, the total value of your pipeline should be about three times your target sales revenue.
Here’s how to calculate it:
(Sum of weighted pipeline opportunities / Monthly revenue target) = Pipeline coverage
Say your business has a total pipeline value of $420,000 for the next quarter. You’ve categorized your deals and revenue forecasts based on the likelihood of closing:
- $175,000 in confirmed opportunities
- $90,000 in proposed deals (75%+ chance of closing)
- $50,000 in scoped deals (50% chance of closing)
- $7,500 in new opportunities (20% chance of closing)
Your total weighted value would be about $320,000.
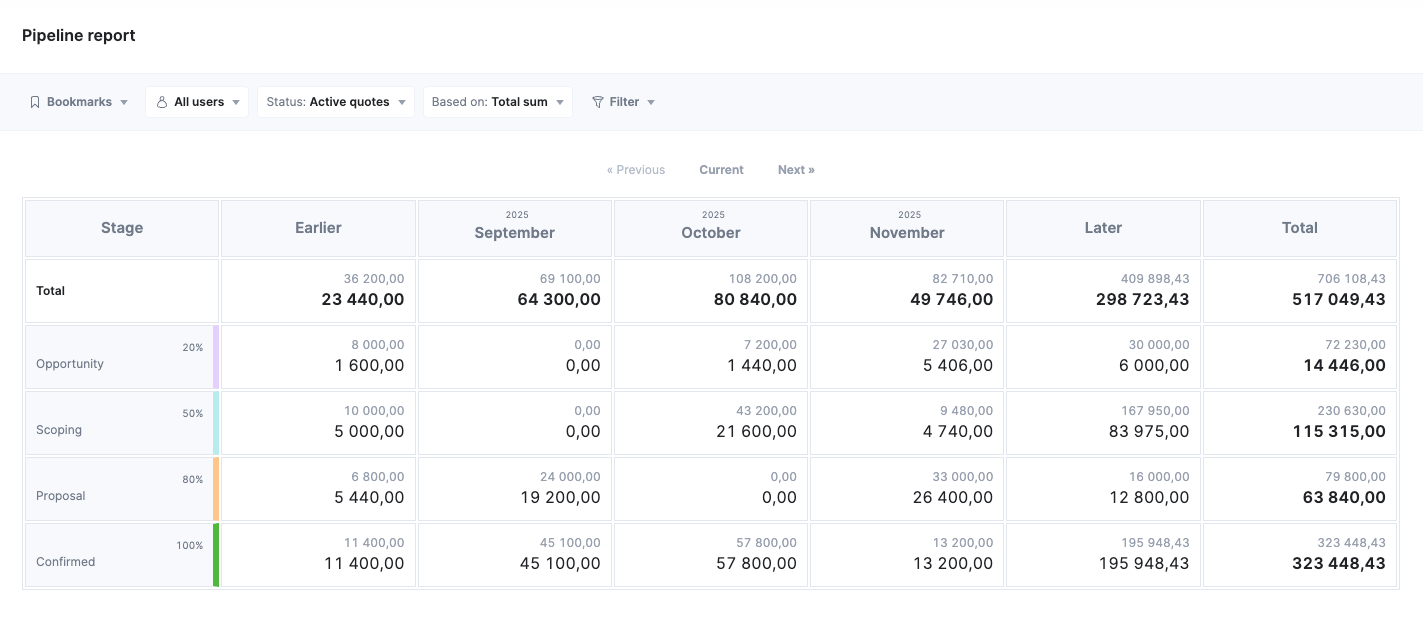
Scoro’s “Pipeline” report can automatically calculate this for you by multiplying the total value of each pipeline stage by the closing probability.
Now, let’s say your monthly revenue target is $250,000. Your pipeline coverage formula would be:
($320,000 / $250,000) x 100 = 1.28
This shows you that you need to increase your pipeline coverage to effectively use your team and stay profitable.
7. Project profitability (actual vs. expected)
Project profitability (quoted vs. actuals) tells you if your projects are actually as profitable as you planned.
It can be a tough but necessary dose of reality, making sure your estimates line up with real-world delivery costs.
If your actual project profitability is consistently lagging behind what’s quoted, you might have issues with:
- Inaccurate scoping and estimating (under-estimating, over-delivering)
- Scope creep (poor client boundaries)
- Inefficient processes (too many approvals or clunky workflows)
- Inadequate resourcing (using senior-level employees for junior-level work)
Use this formula at the start and end of each project to understand your quoted margins vs. actuals:
Total revenue – (bills and expenses + internal costs) = Project profitability
Say you quoted a project with:
- $300,000 in planned revenue
- $50,000 in planned pass-through costs
- $100,000 in planned labor and internal costs
Your quoted profit would be $150,000 ($300,000 – $150,000). But at the end of the project, you realize you spent $120,000 on labor and internal costs.
In this case, your actual profit would be $130,000 ($300,000 – $170,000).
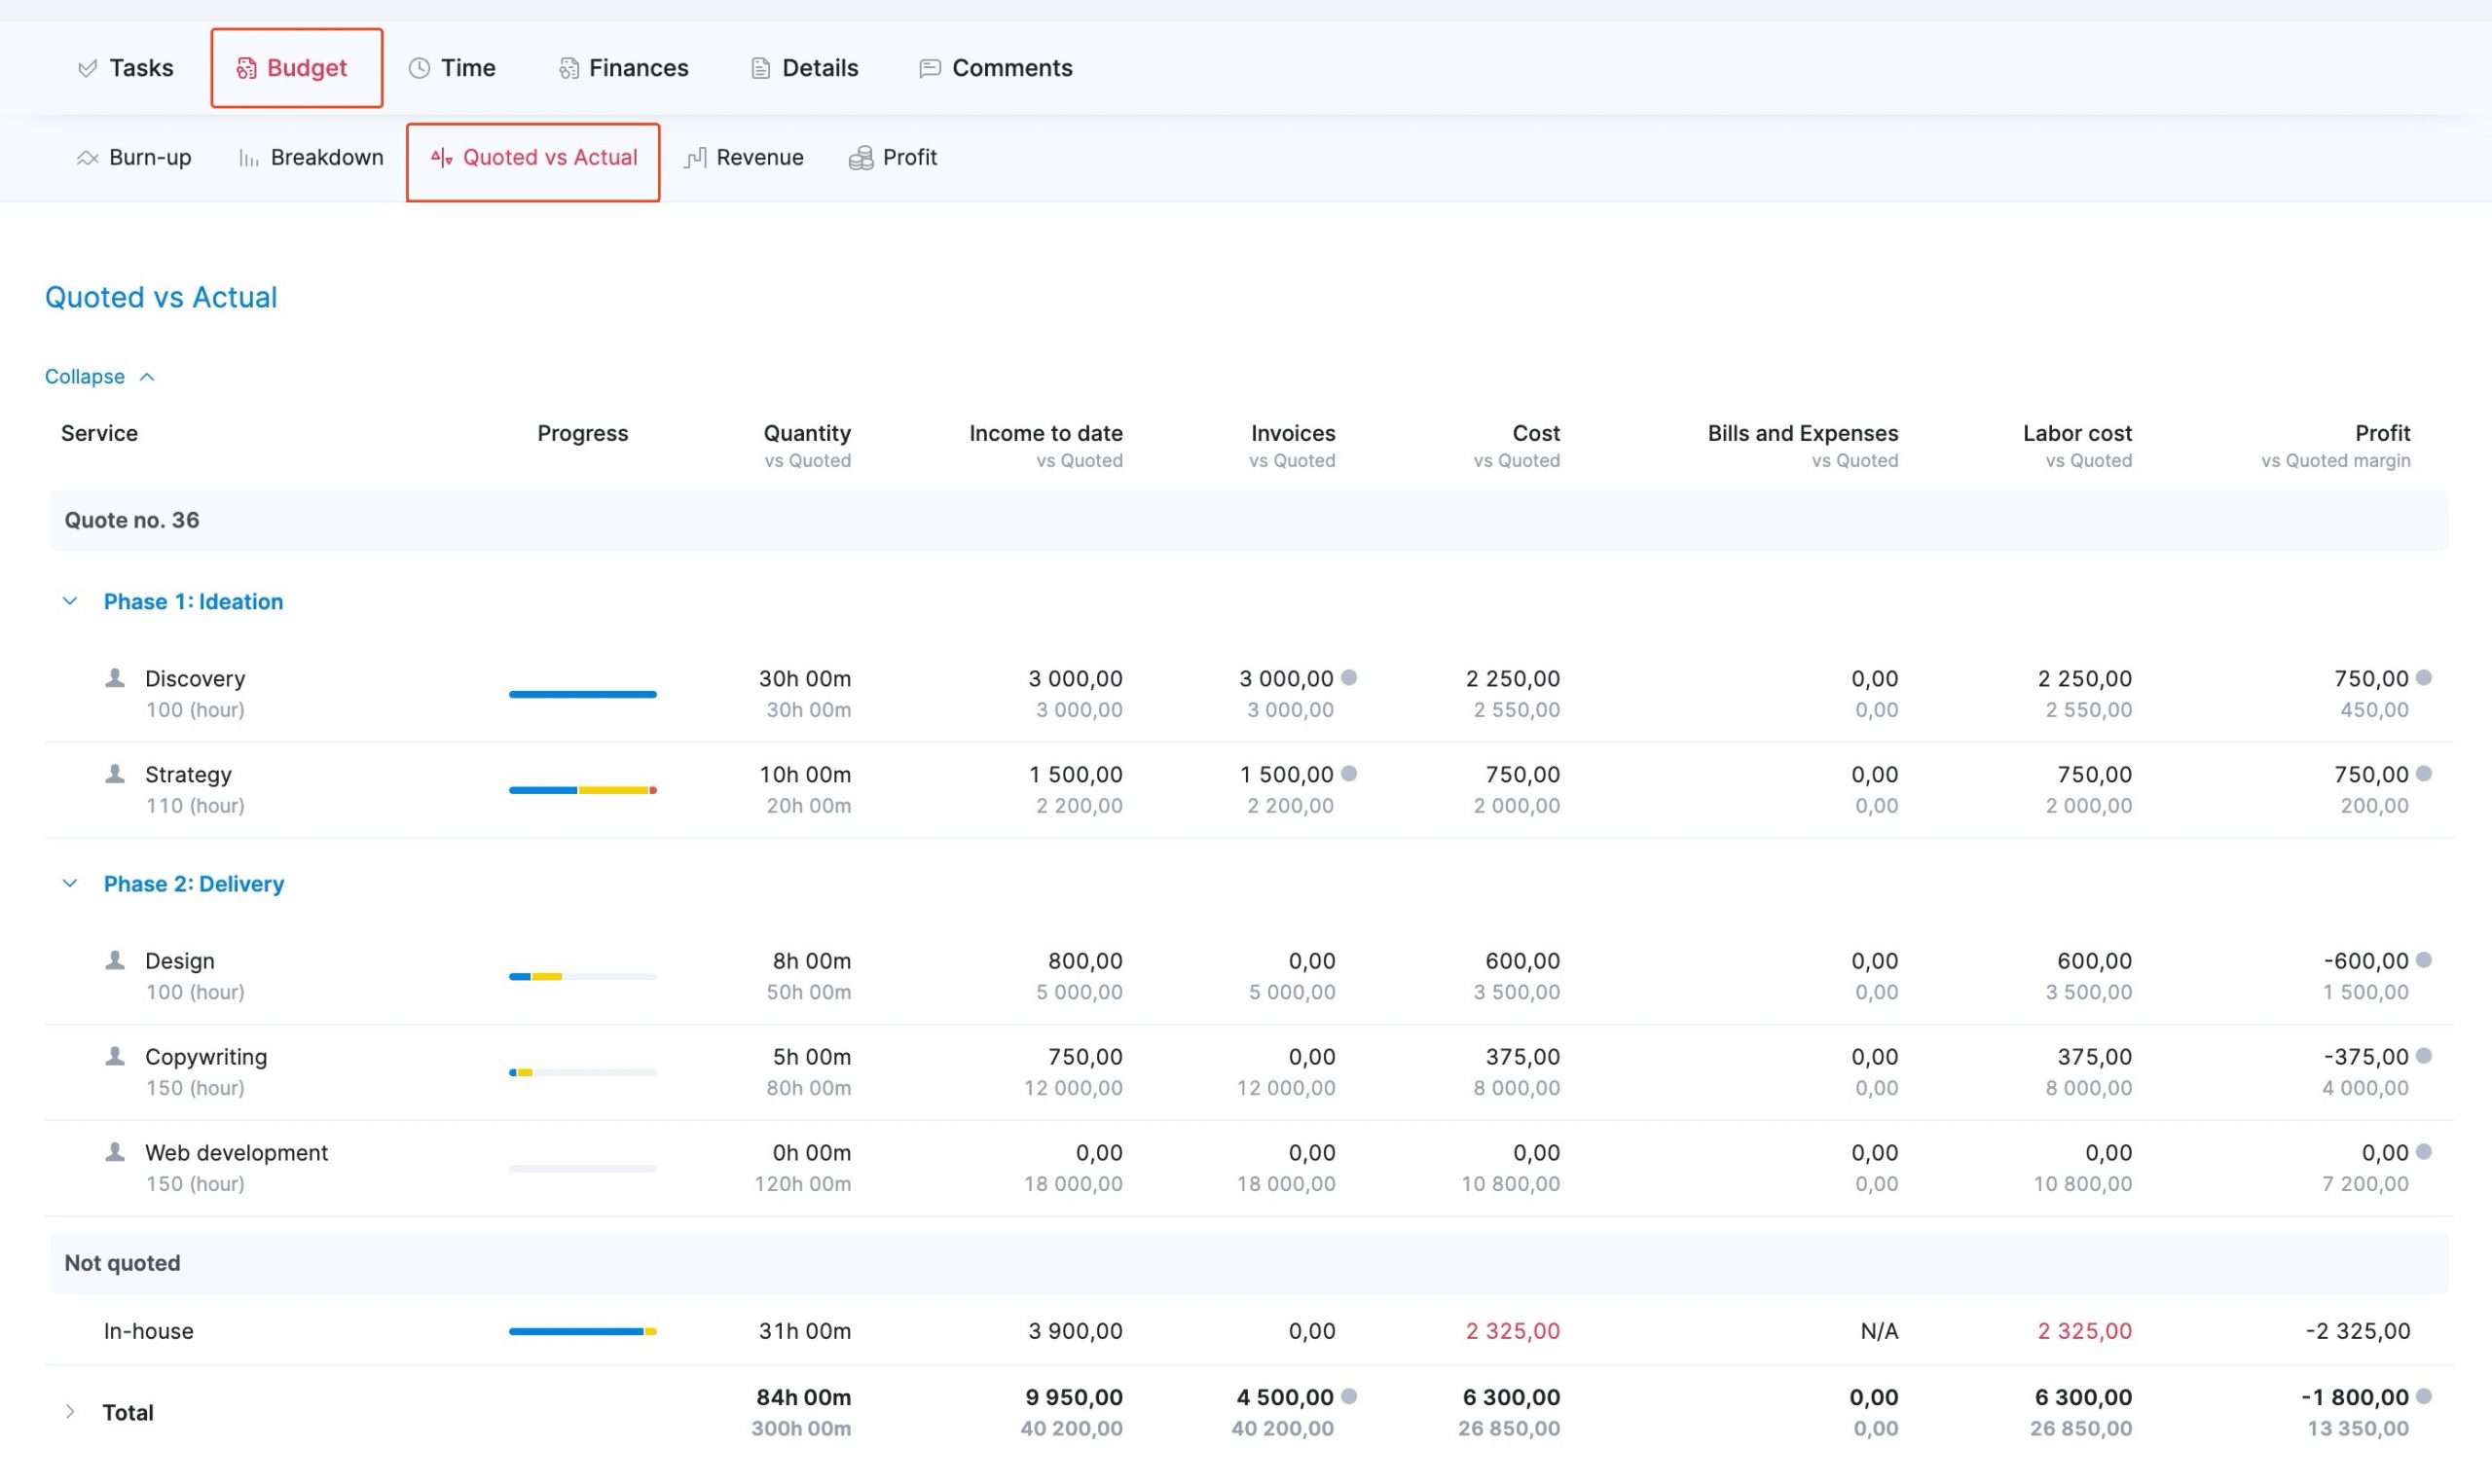
Scoro will automatically track these figures for you. Go to any project, then click “Budget” > “Quoted vs. Actual” to compare the margin from your initial quote to your actual one.
Want to see profitability across your portfolio?
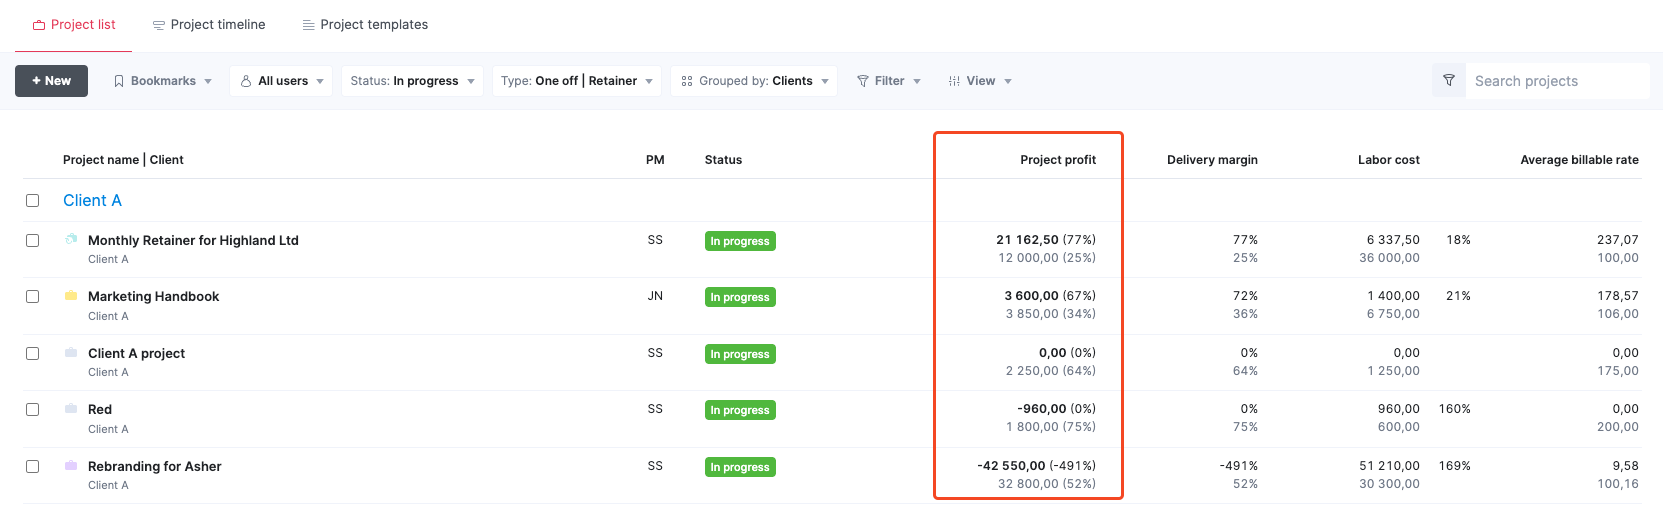
Just go to the “Project list” view. From “Data columns” drop-down menu, select “Project profit.”
This helps you quickly keep an eye on both your overall profitability and which projects are driving those financial gains.
Black figures show actuals, while gray figures show quoted amounts, so you can instantly compare planned vs. delivered performance.
The fix: Build a metrics handbook for your firm
Of course, all these metrics mean nothing if you’re not aligned on how to measure them and what your “ideal” numbers are.
As Marcel points out,
[Foundational alignment] helps you align on the best possible outcomes for the way the business is currently structured. Without it, you can’t interpret any actual measurement of data. Our utilization rate is 52% is that good or bad? Our average billable rate on this project was $178—is that good or bad? You can’t answer that unless you know what you expected it to be in the first place.
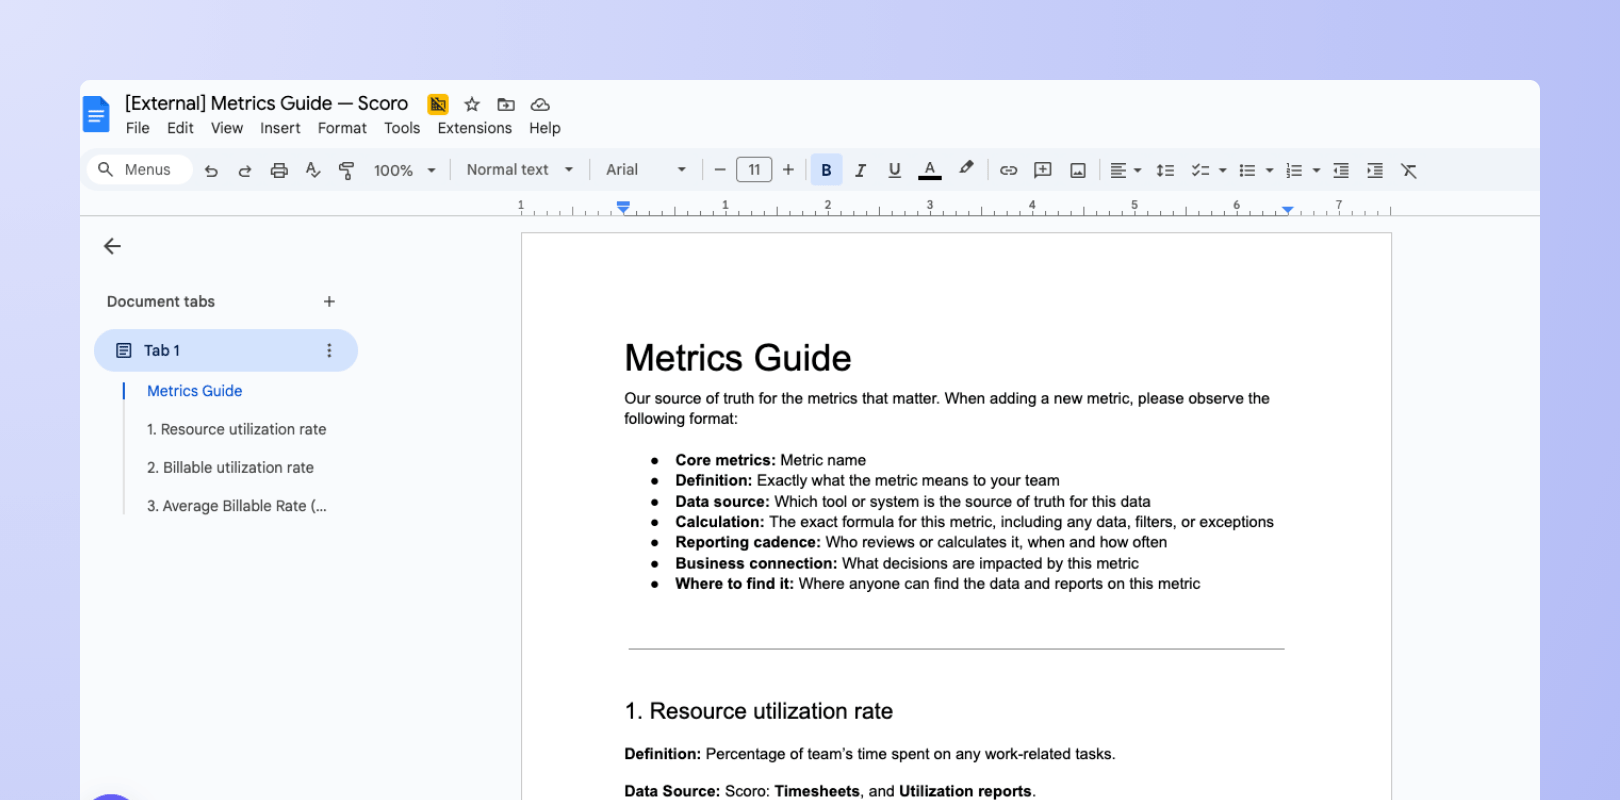
Get everyone on the same page with a clear metrics guide. This should be a living, tactical playbook that includes:
- Core metrics: Which ones you’re focusing on
- Definition: Exactly what the metric means to your team
- Data source: Which tool or system is the source of truth for this data
- Calculation: The exact formula or workflow used to track this metric, including any data, filters, or exceptions
- Reporting cadence: Who reviews or calculates it, when and how often
- Business connection: What decisions are impacted by this metric
Once you build this handbook, set a regular review every six months to update as needed.
This isn’t just more documentation—it’s the key for unified decisions and profitability.
Steal our metrics handbook template to get your team started.
Make alignment simple with Scoro
Once you agree on how to define, measure, and track core metrics, growing becomes easier.
And getting your whole team on the same page is easier than you think. A shared metrics language helps you avoid wasted time, stalled decisions, and lost profits.
Cosmonauts and Kings experienced this firsthand. They were struggling with disconnected, unclear data that led to invisible issues, inefficiencies, and low margins.
When they aligned on metrics and unified data and reporting in Scoro, KPIs became easier to track—and to improve:
Now, thanks to Scoro, we can clearly see how each external provider or additional hour affects our profitability. Another major challenge was managing numerous spreadsheets to track key business KPIs. Now, Scoro automates these reports.
Scoro lets you define and track your core metrics—from utilization to delivery margins—in one place. Try it free for 14 days to create shared dashboards, customize reports, and establish a single source of truth for your entire team.