
A Project Portfolio Management (PPM) tool is software that helps professional service companies, like agencies and consultancies, manage multiple projects simultaneously.
It gives you visibility into all projects in one central place, allowing you to track progress, meet deadlines, manage resources, and increase project profitability.
In this article, we’ll break down 7 of the best project portfolio management systems to give you the insights you need to choose the best tool for your team.
7 best project portfolio management tools shortlist
Here’s out shortlist of some of the best project portfolio management tools.
| Tool | G2 Rating | Best For |
|---|---|---|
| Scoro | 4.5/5 | Best for end-to-end project portfolio management and reporting |
| Asana | 4.3/5 | Best for task-based project management for portfolios |
| Smartsheet | 4.4/5 | Best for teams coming from a sheets-based project tracking system |
| Runn | 4.5/5 | Best for high-level portfolio management and forecasting |
| monday.com | 4.7/5 | Best for custom reporting on project and portfolio dashboards |
| Liquid Planner | 4.2/4 | Best for predictive insights to help you stay on top of your projects |
| ProofHub | 4.5/5 | Best for project management collaboration across teams |
How to choose the best project portfolio management software
This will depend on your needs. But, you may want to consider the following criteria when choosing the best PPM software:
- Project portfolio views: Roll up project data across multiple client projects to see progress, profitability, labor costs, and more
- Resource management: To track utilization across entire teams and quickly identify availability for project staffing.
- Time and expense tracking: To capture billable hours and auto-create invoices for simplified billing and revenue recognition.
- Dashboards and reporting: Provide real-time, customized views of budgets, utilization, company revenue, and more.
- Retainer management: Maintain visibility into all active client retainers and key details like amounts, billing schedules, contracted deliverables, and services covered.
- Integrations: Connect seamlessly to existing tools like accounting, document storage, calendars, etc.
Now, let’s get into some of the top-rated PPM platforms agencies and consultancies rely on.
1. Scoro
Scoro is an end-to-end project management software for professional services teams juggling multiple client projects. It acts as your command center to meet deadlines, manage resources, and increase project profitability.
For example, Scoro’s “Project list” shows you key data across your entire portfolio, including:
- The progress bar visualizes your team’s tracked time on the project vs. the estimate
- “Income” shows project revenue based on issued invoices
- “Labor cost” shows the internal delivery cost
- “Project profit” shows the total revenue from each project minus external and internal costs
- “Average billable rate” shows the project revenue divided by actual hours spent
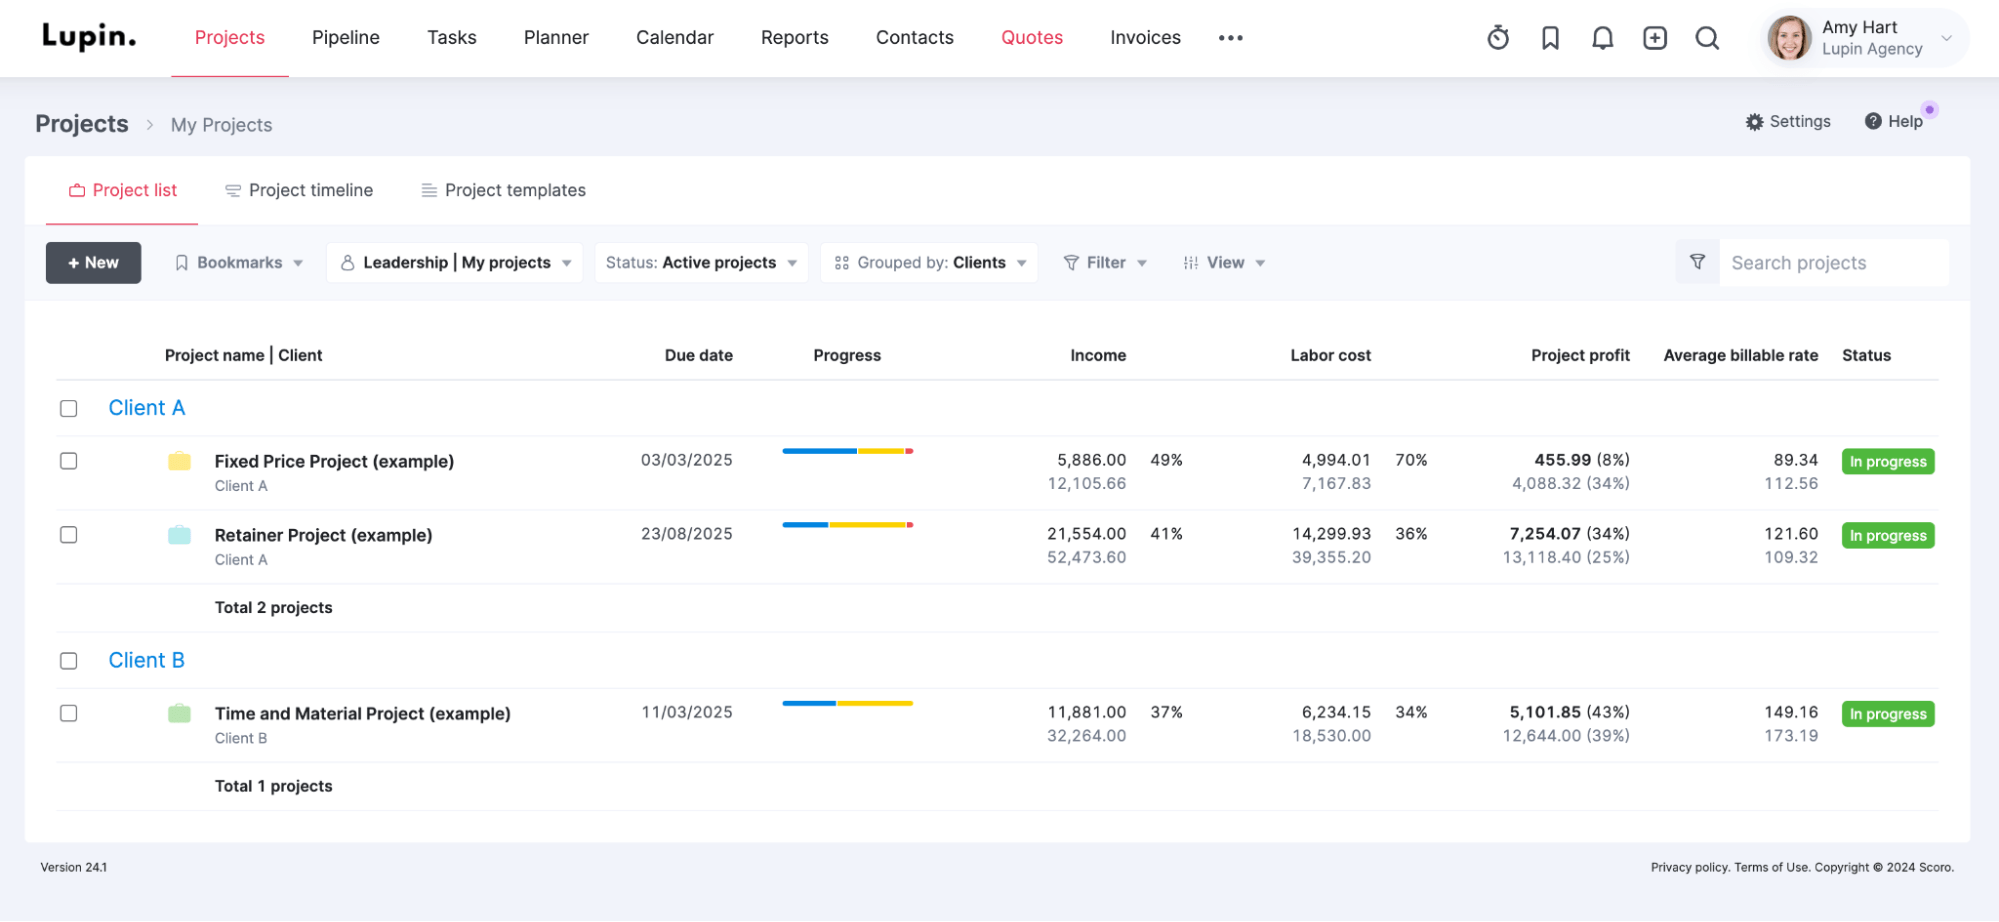
By default, the “Project list” view tracks quoted vs. actual values for all the financial metrics. Estimated financials are displayed below the actuals so you can see how your projects are progressing at a glance.
The “Project list” is also fully customizable. You can add or remove data columns to see what’s most important to you or adjust the exact data you want to monitor.
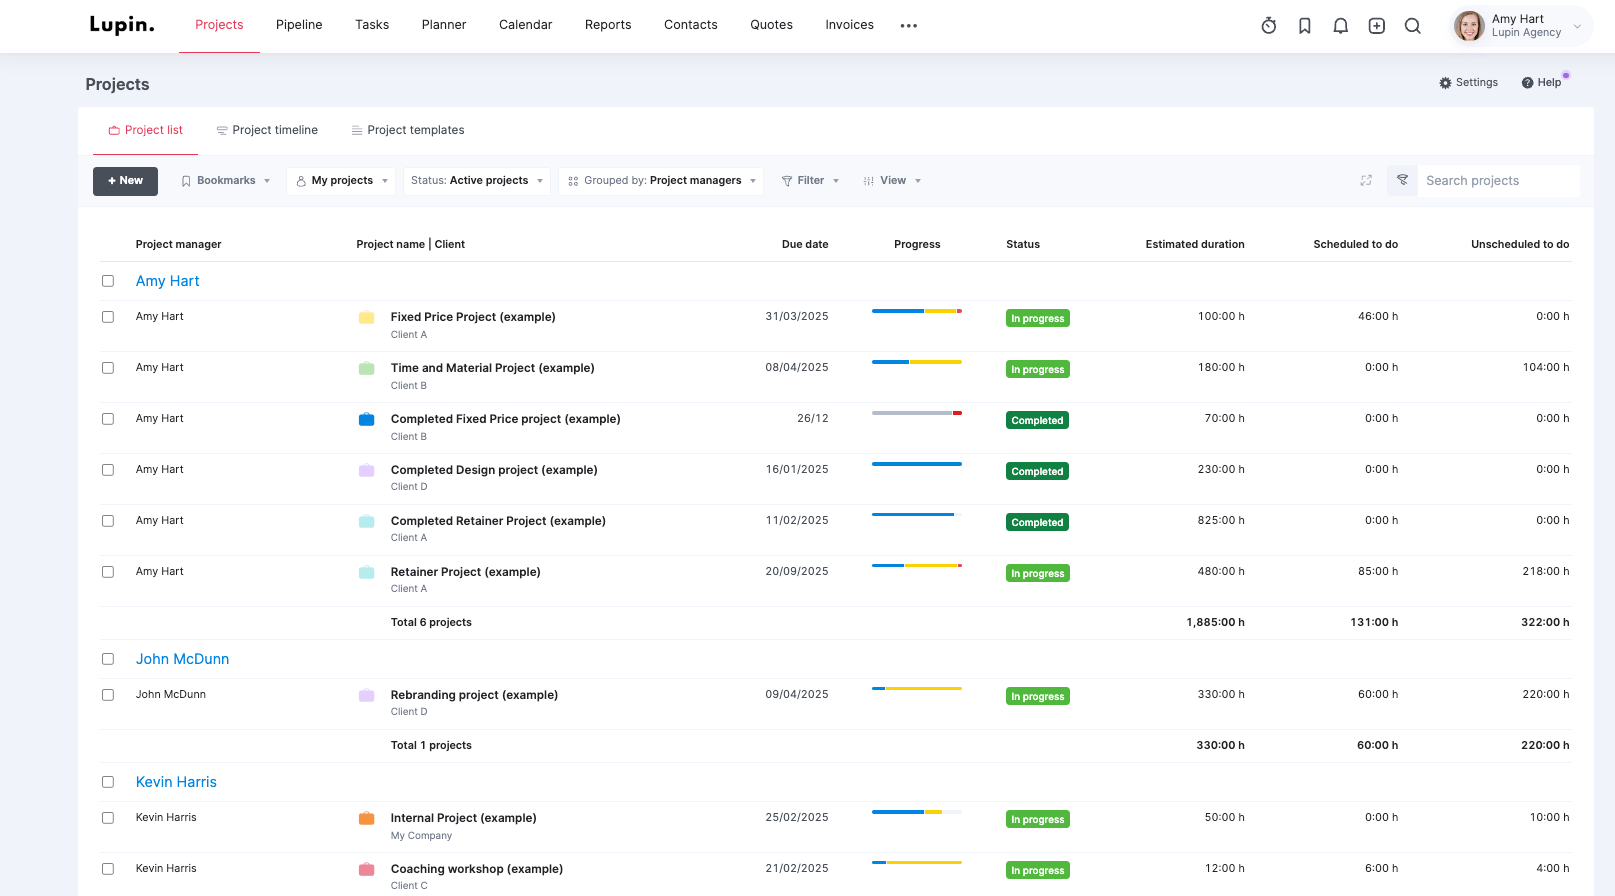
For example, you can group projects by “Project managers” instead of “Clients” to to get an at-a-glance view of each PM’s current responsibilities and workload. This lets you easily compare project metrics like budget, timeline, and scope across different PMs.
You can also filter the data columns to show different data points depending on what’s important to you.
Such as:
- Project status
- Clients
- Due dates
- Tags
- Scheduled todos
This customizable high-level view of all projects lets you compare performance side-by-side to identify your most and least profitable engagements.
Want to dive deeper into individual projects?
Click on any project to open it in a detailed view.
You’ll then see a high-level summary of the project showing you key metrics like:
- Used hours
- Remaining hours
- Remaining days
- Earned revenue
- Overdue tasks
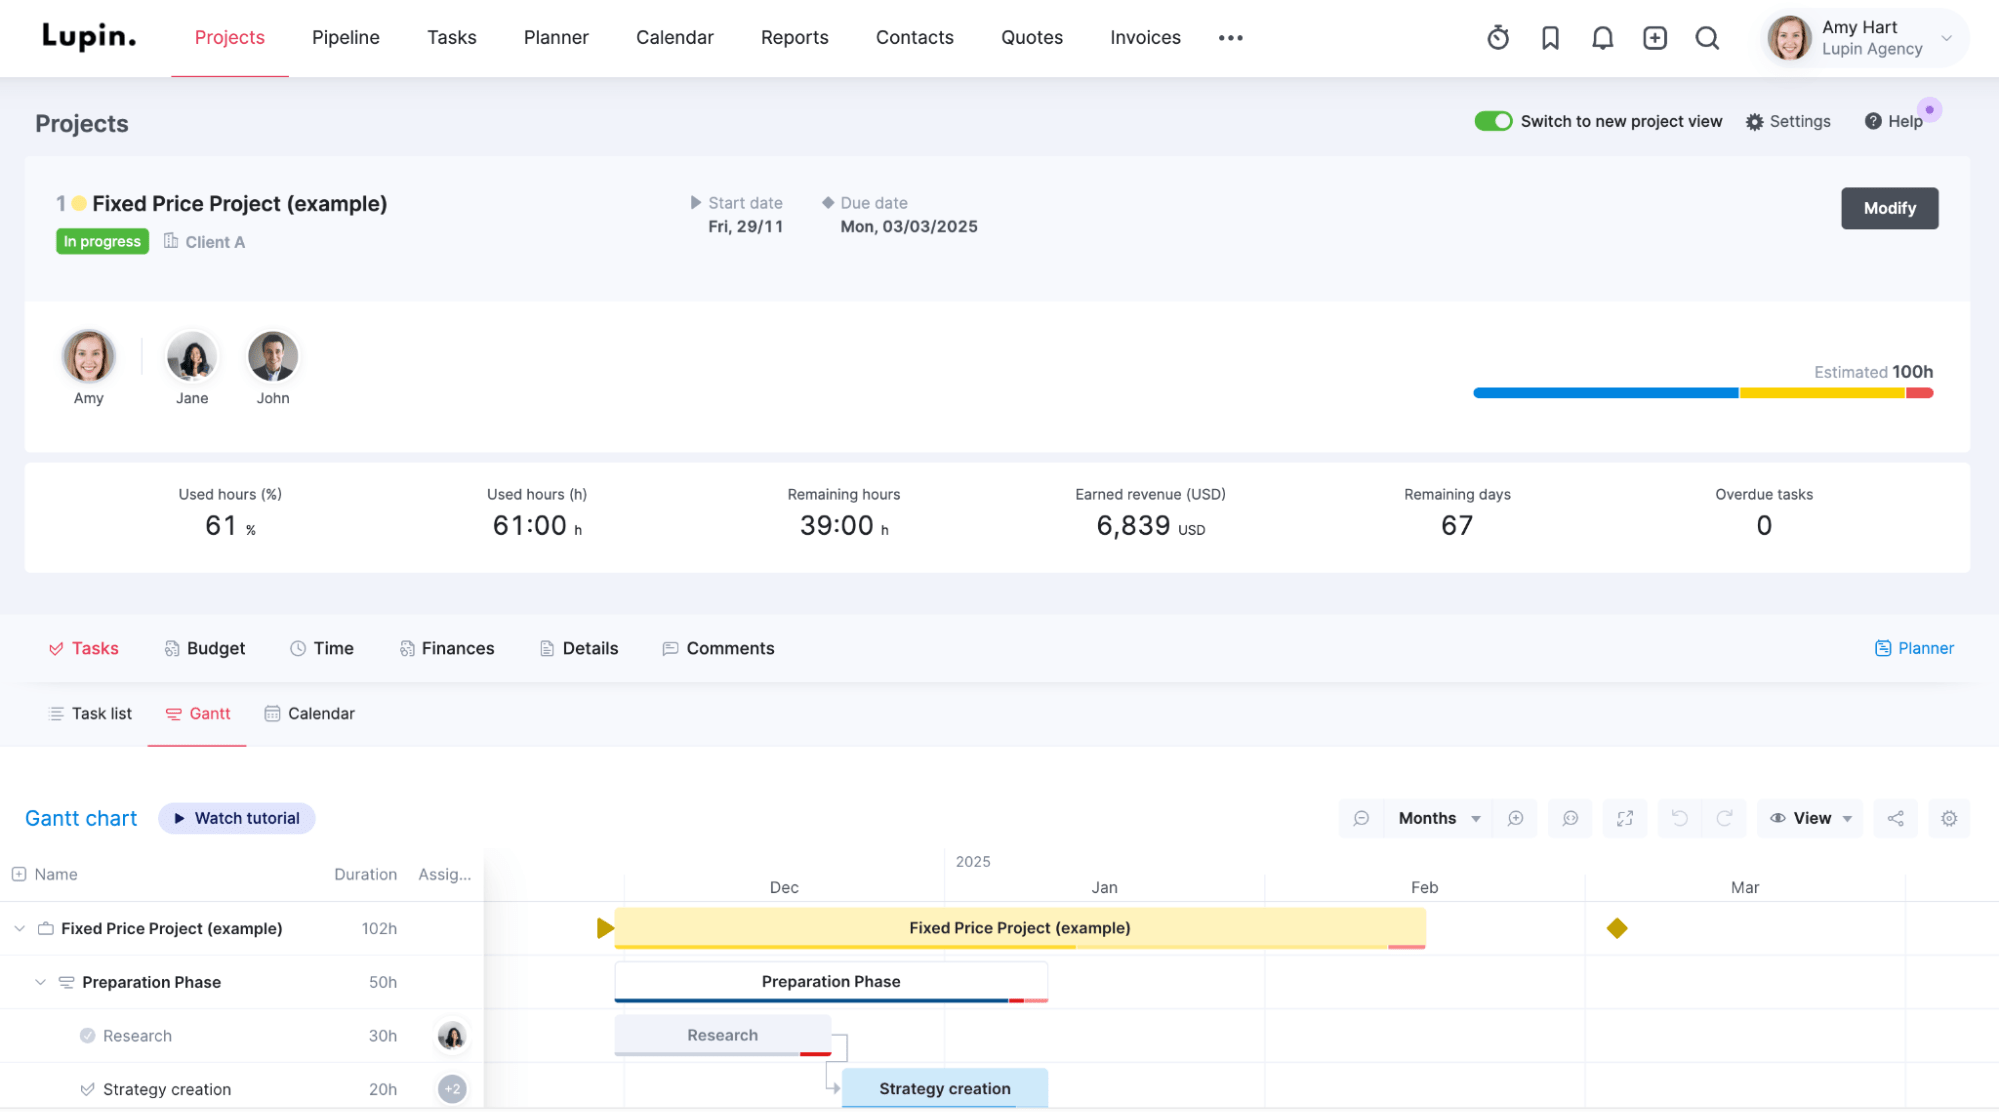
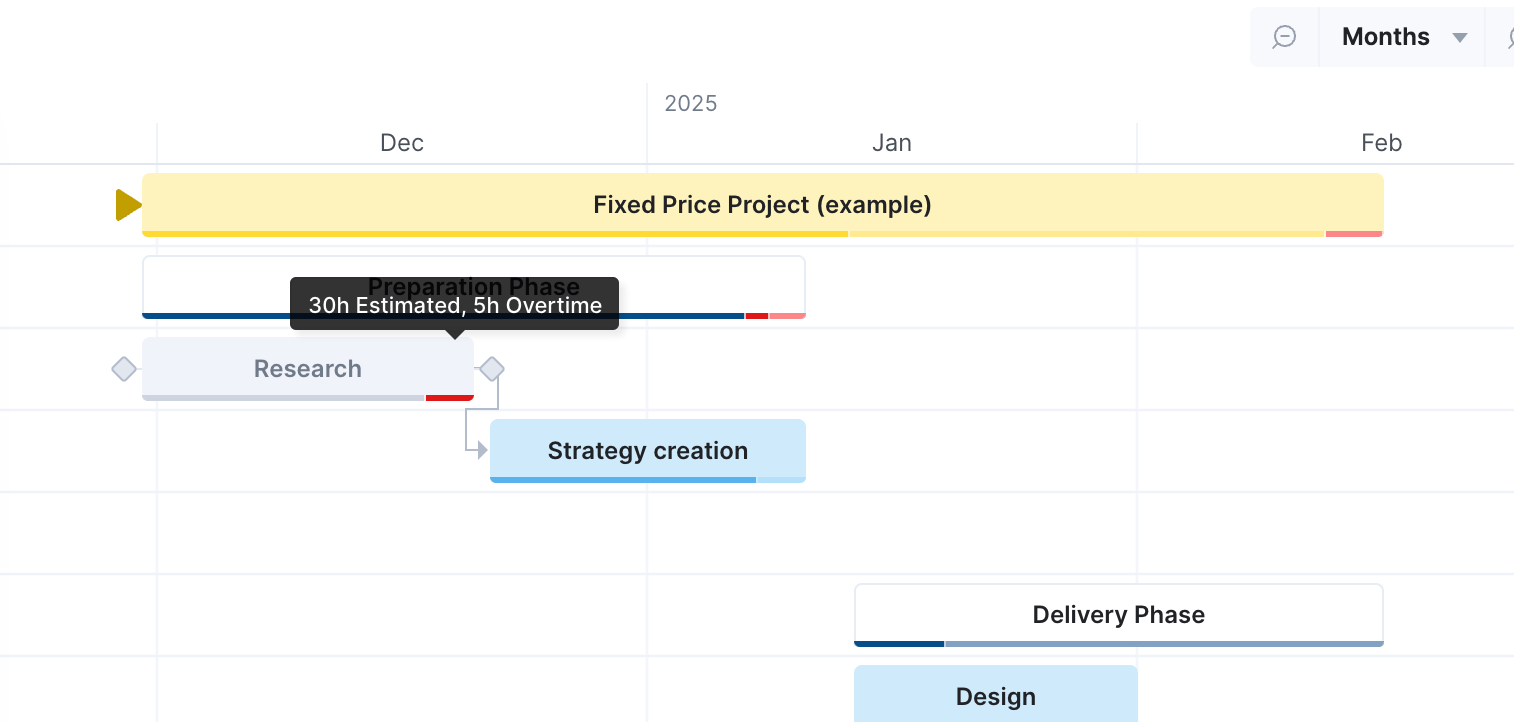
Underneath the summary, scroll down to the Gantt chart in the “Tasks” section. This will be your key source of truth for time-based progress.
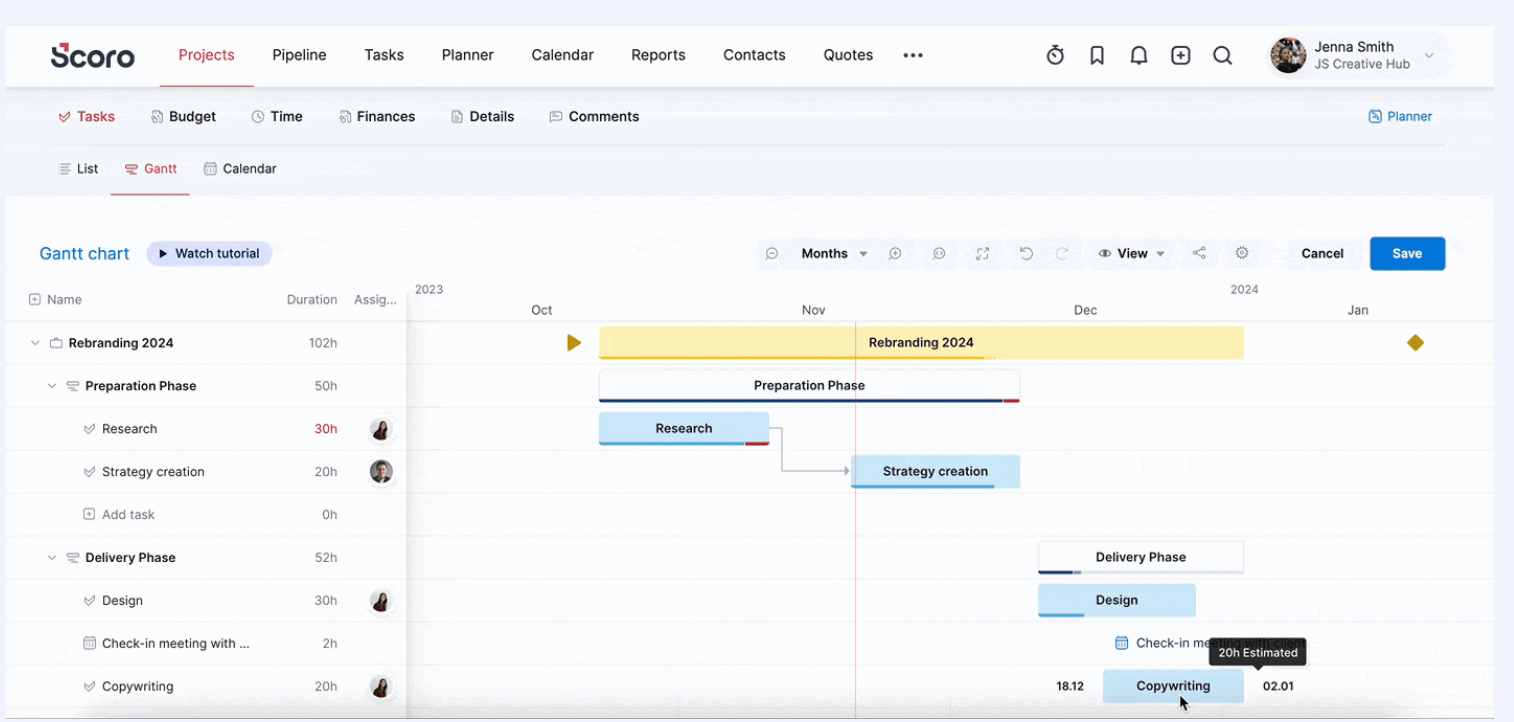
See all your tasks in the timeline view, as well as in the sidebar, along with the estimated hours for each. Then, hover over any task’s progress bar to see tracked time versus estimates.
With portfolio-wide visibility for decision-making combined with bottom-up project analysis, Scoro gives you actionable insights to increase profitability across your entire project portfolio.
What you’ll love
Scoro’s detailed project profitability insights are perfect for project managers to explore which projects and clients drive the most profitability for your business.
Scoro can measure profitability in various ways, such as by project, client, manager, or individual project.
Analyzing profitability from a client level gives you and your team a major leg up when it comes to pipeline planning and increasing profitability in the future.
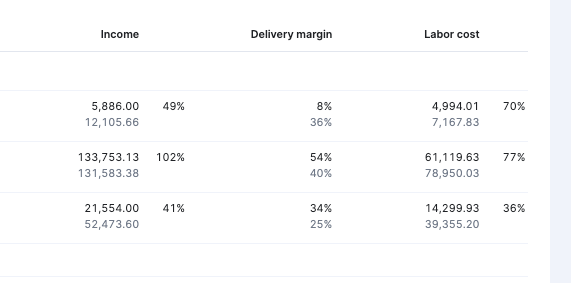
To do so, go to the “Project list” view. Click “View” and select “Grouped by: clients.” Then go to “Data columns” and include the “Project profit” column to see revenue after accounting for labor and expenses. Make sure to tick the “Summarize” box as well.
You’ll see your projects grouped by client, income, external costs, labor costs, and overall project profit from here.
The “Project profit % (actual)” metric on the summary bar shows you which clients bring in a margin higher than the average (shown at the top of the chart).
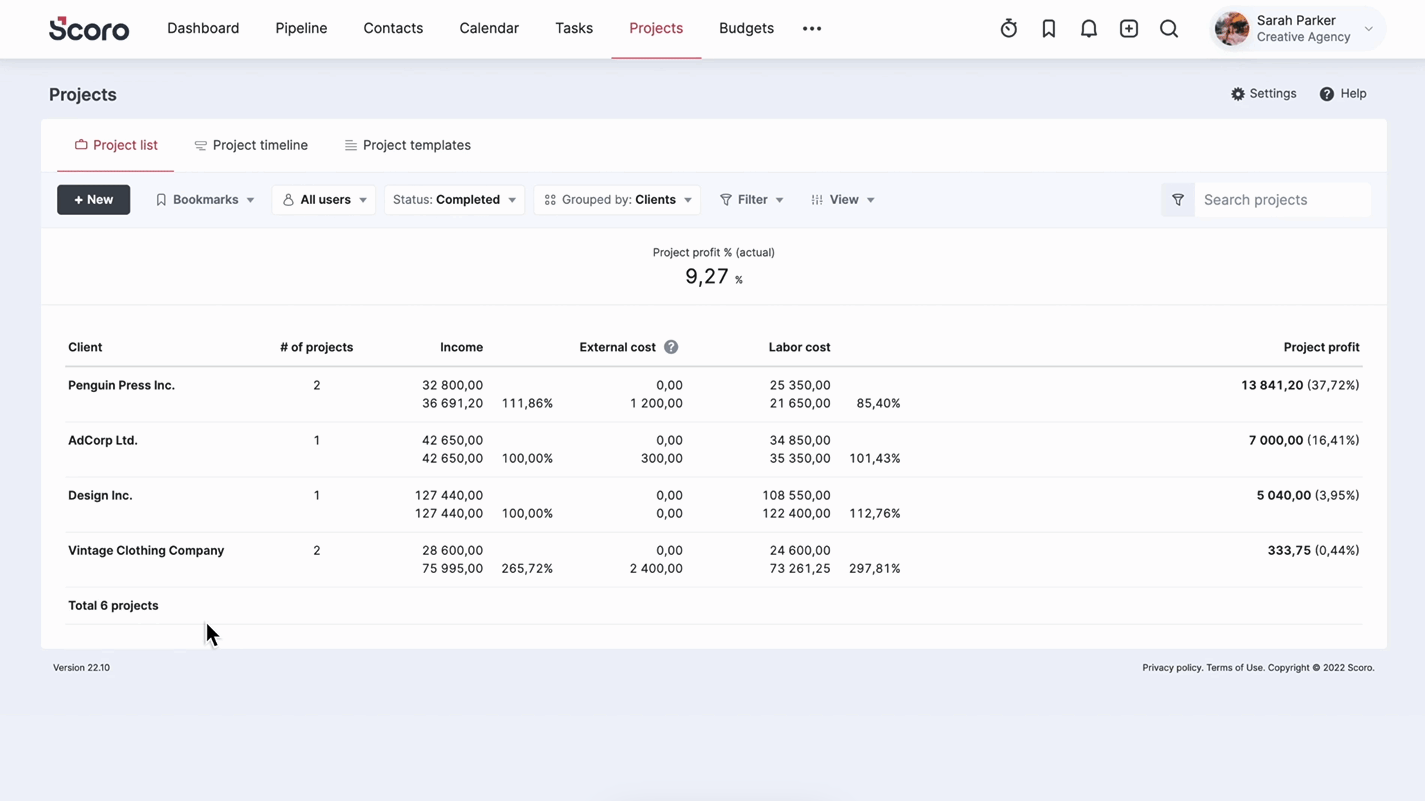
These insights will give you all the information you need to analyze and compare projects and clients at a glance, helping you make informed decisions about resource allocation and pipeline needed to support your business and profitability.
Core features
- Project portfolio overview gives you an at-a-glance of key project health, status and financial metrics to keep projects profitable
- Internal time tracking makes it easy to get accurate details on how long tasks took and how it compared to your estimates
- Granular resource management helps you find the right person for every task, optimize utilization, and ensure efficiency
- Real-time reporting allows you to drill down into the data you need, for instant visibility.
Pricing
Scoro has four plans:
- Essential: $26 per user per month
- Standard: $37 per user per month
- Pro: $63 per user per month
- Ultimate: customized enterprise pricing
You can also try Scoro free for 14 days.
2. Asana
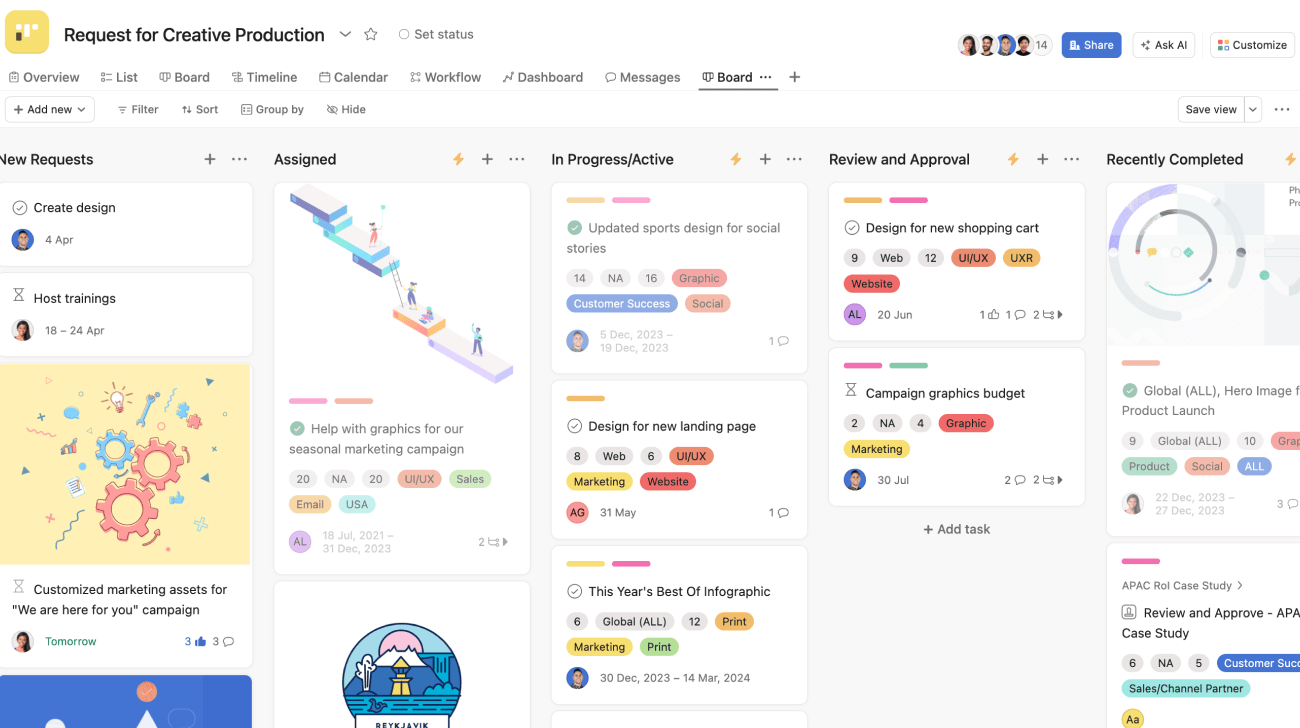
Asana is a work and project portfolio management system that helps you smoothly manage multiple projects while strengthening clarity, accountability, and scalability.
Asana’s “Portfolio” dashboard gives you a high-level overview of all your projects. You can create a portfolio dashboard with all open projects or select only certain ones to include.
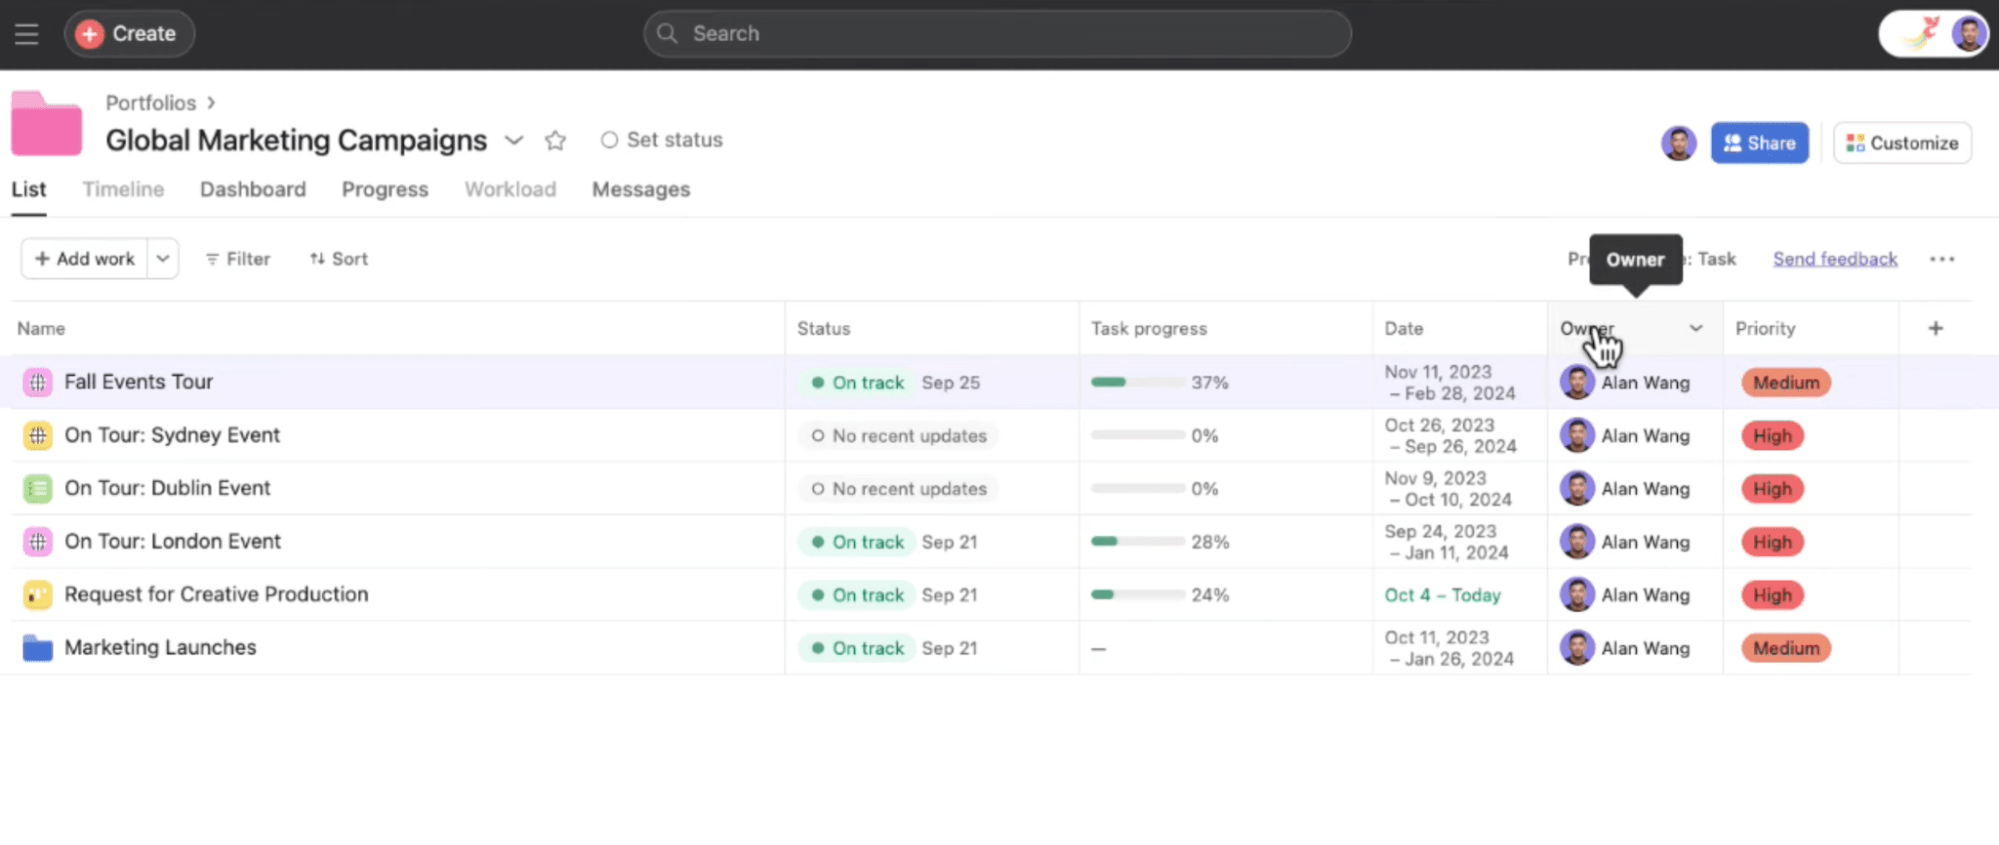
You’ll see all the projects associated with that portfolio, as well as their status, progress, dates, owner, and priority.
You can add custom fields to this view to see metrics such as estimated time, project costs, team, and more.
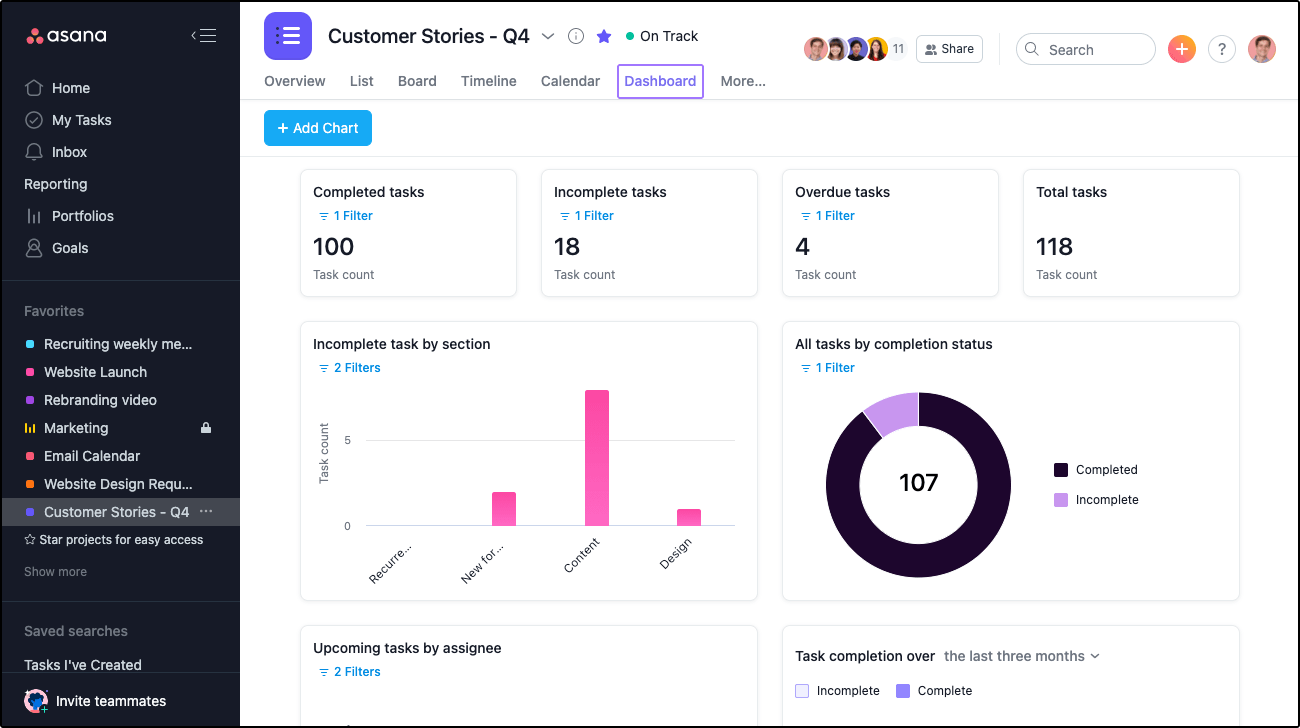
Toggle to the “Dashboard” view for a more visual representation of your team’s workload. From here, you’ll see a numerical breakdown of total, completed, and incomplete tasks across all projects, status, and other charts.
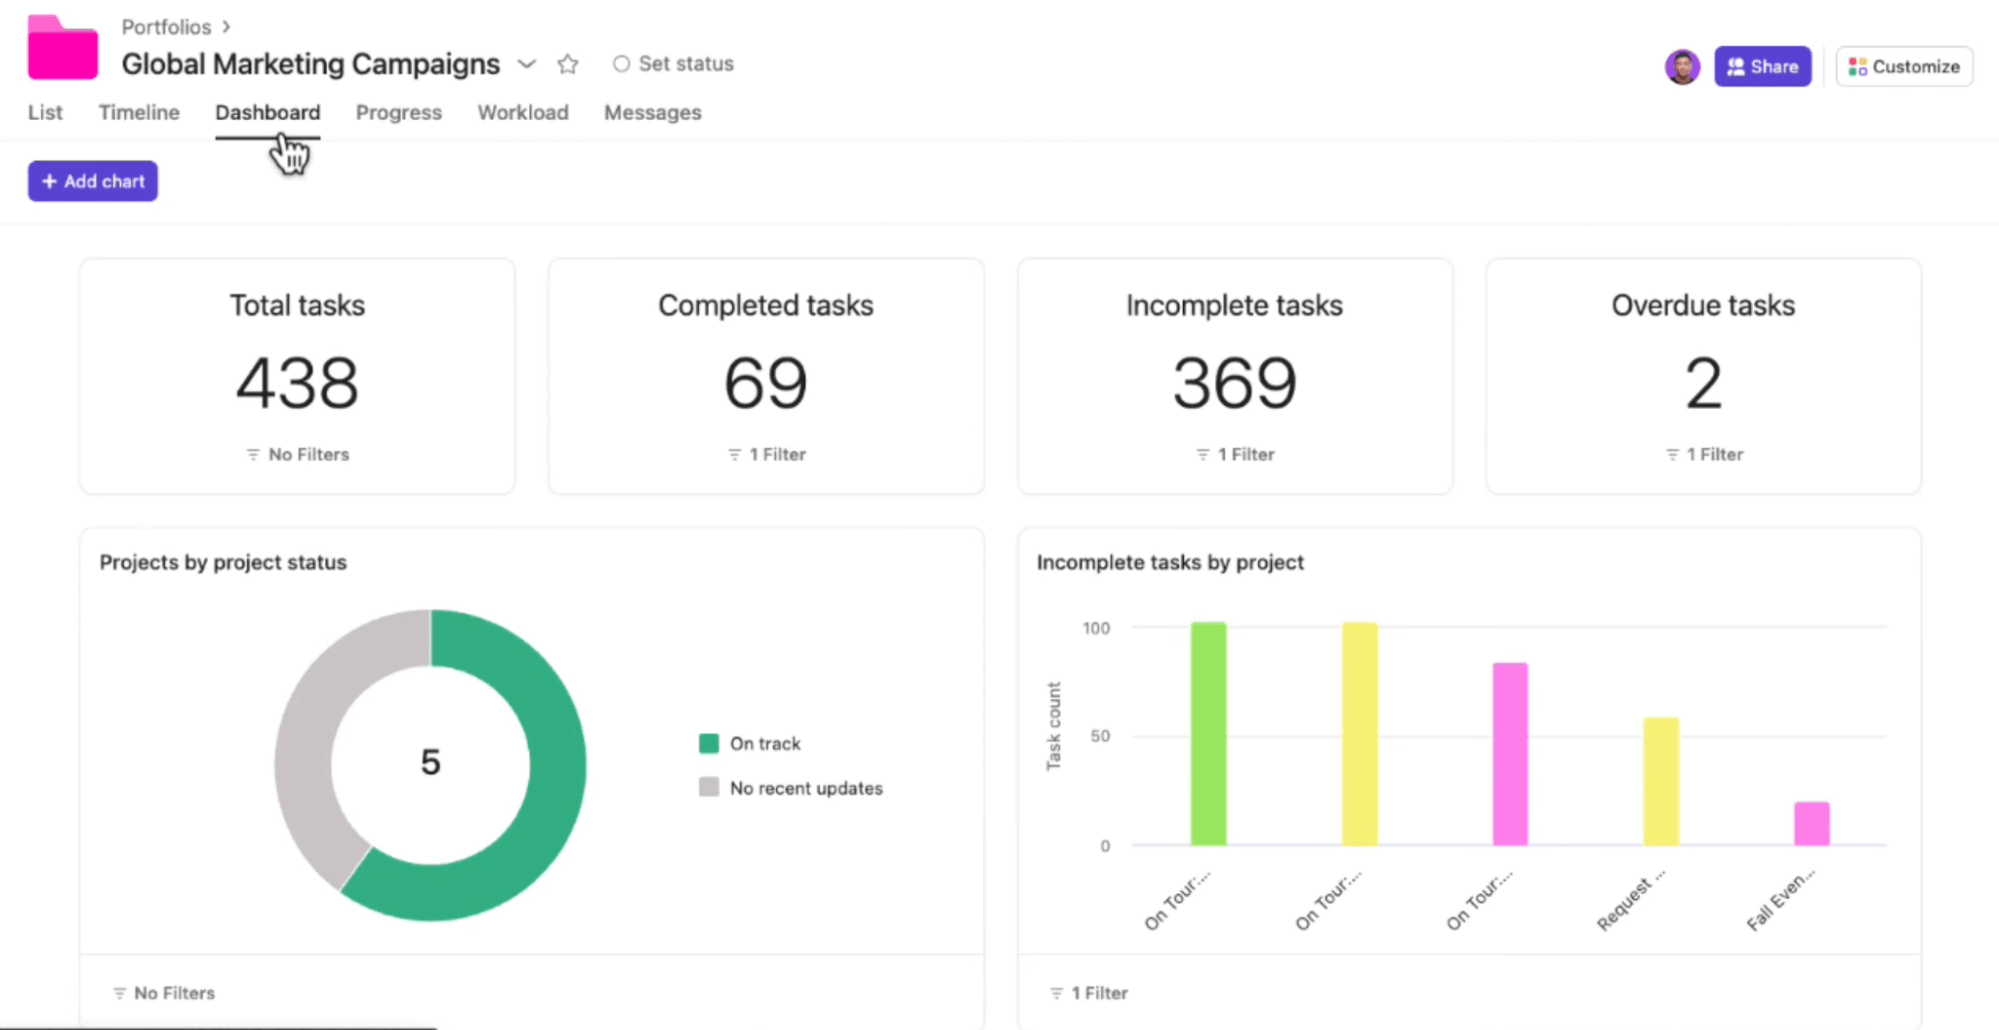
This is fully customizable, so you can easily get the necessary visibility to consolidate your project dashboards and reporting.
When you want to drill down into the project level, click on a project from your portfolio to see all the important project details in the same tab.
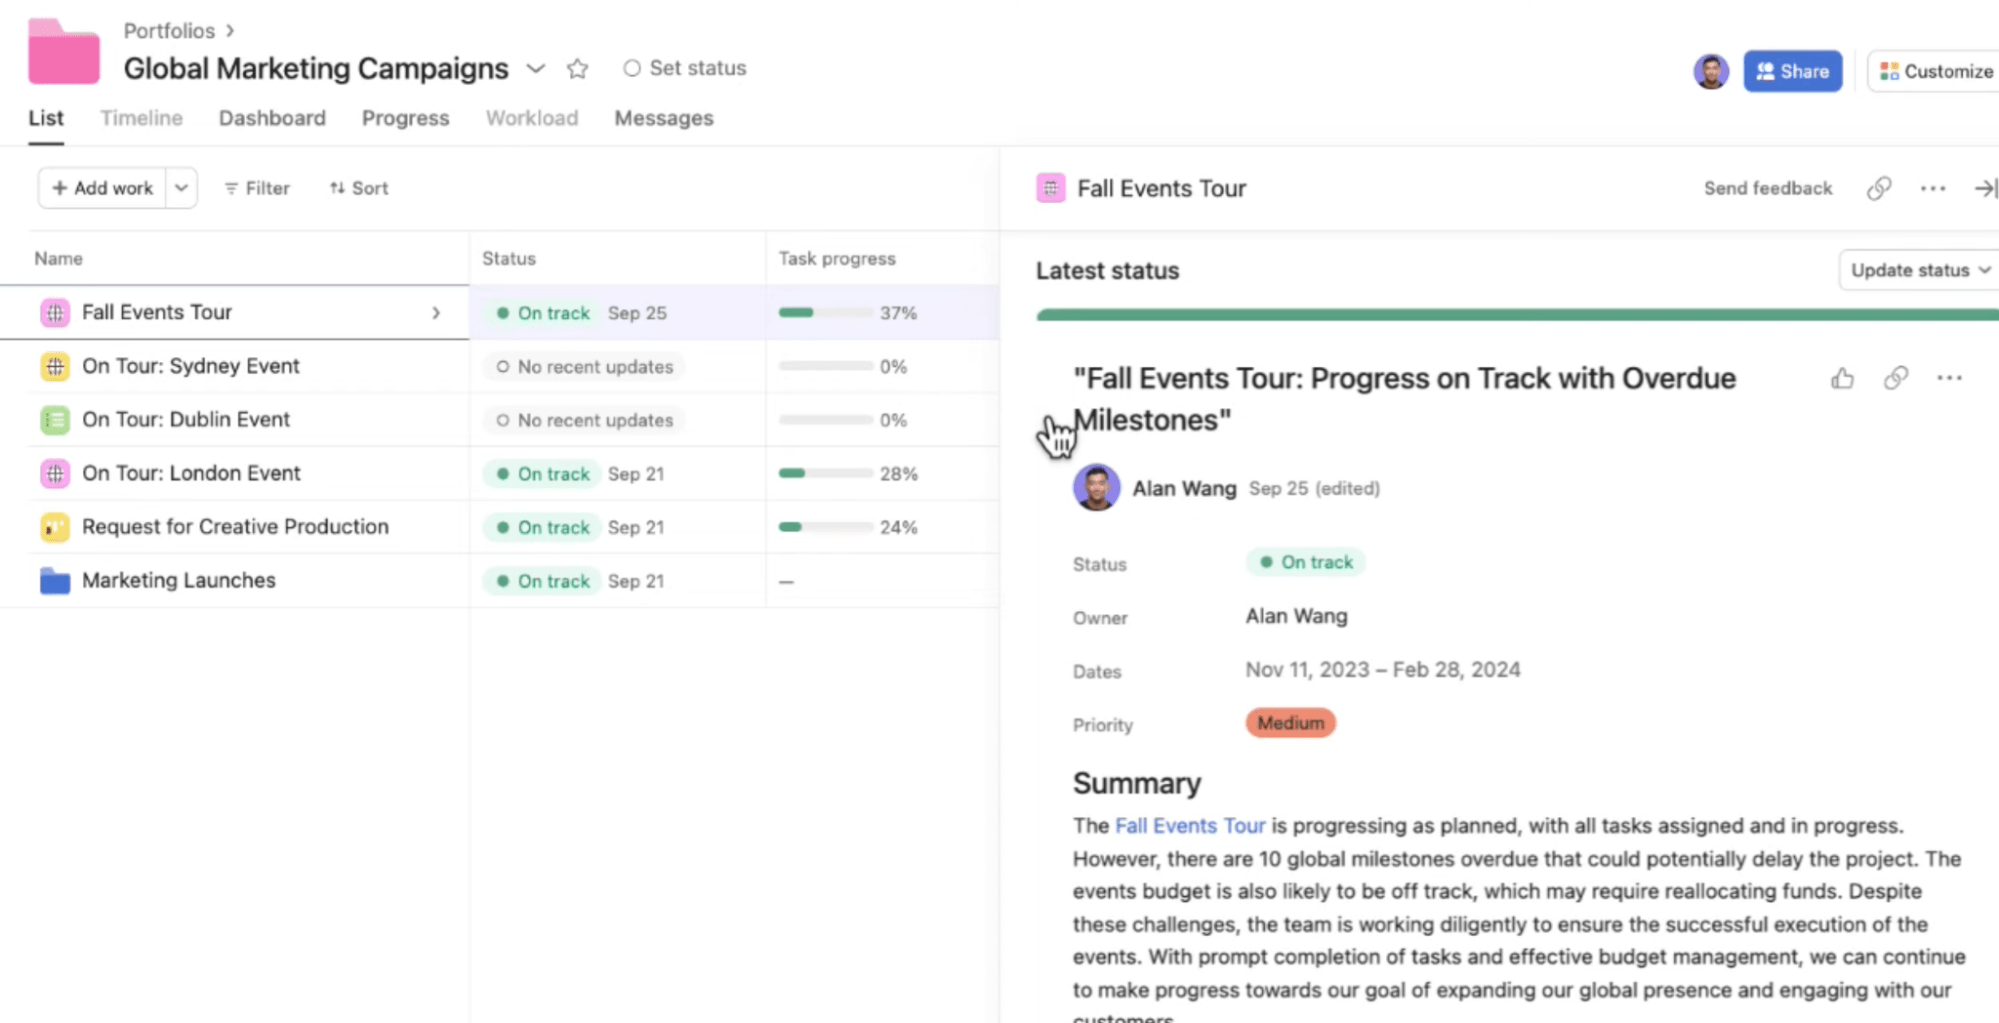
You can also go to the “Project” view to view the “Project Dashboard,” which has the same detailed project KPIs.
Within the “Project” view, you can also:
- add key milestones and dates to the project
- create a project brief
- add and view tasks assigned to the project
- assign team members to tasks
Asana’s Gannt chart, “Timeline,” “Calendar,” “Board view,” and other views help you visualize progress and upcoming work to be done, along with task requests, backlogs, resources, and deadlines all in one place.
With both high-level and more granular project and work management, you can keep all of your projects moving forward smoothly simultaneously.
What you’ll love
Busy project managers will love Asana’s “Portfolio Workload” view, which helps them understand resource conflicts, potential bottlenecks, and resource allocation.
From the “Portfolio” view, toggle to the “Workload” tab. A capacity/utilization chart showing team member’s upcoming tasks and hours.
If someone is overscheduled, you’ll see the day or dates they’re over capacity in red. Click on the caret by their name to view all the tasks they’re working on and when they’re assigned.
You can drag and drop the task to reassign it to another team member or assign it to new dates. You can also click each task to view a pop-up with task details to get more details before making a change.
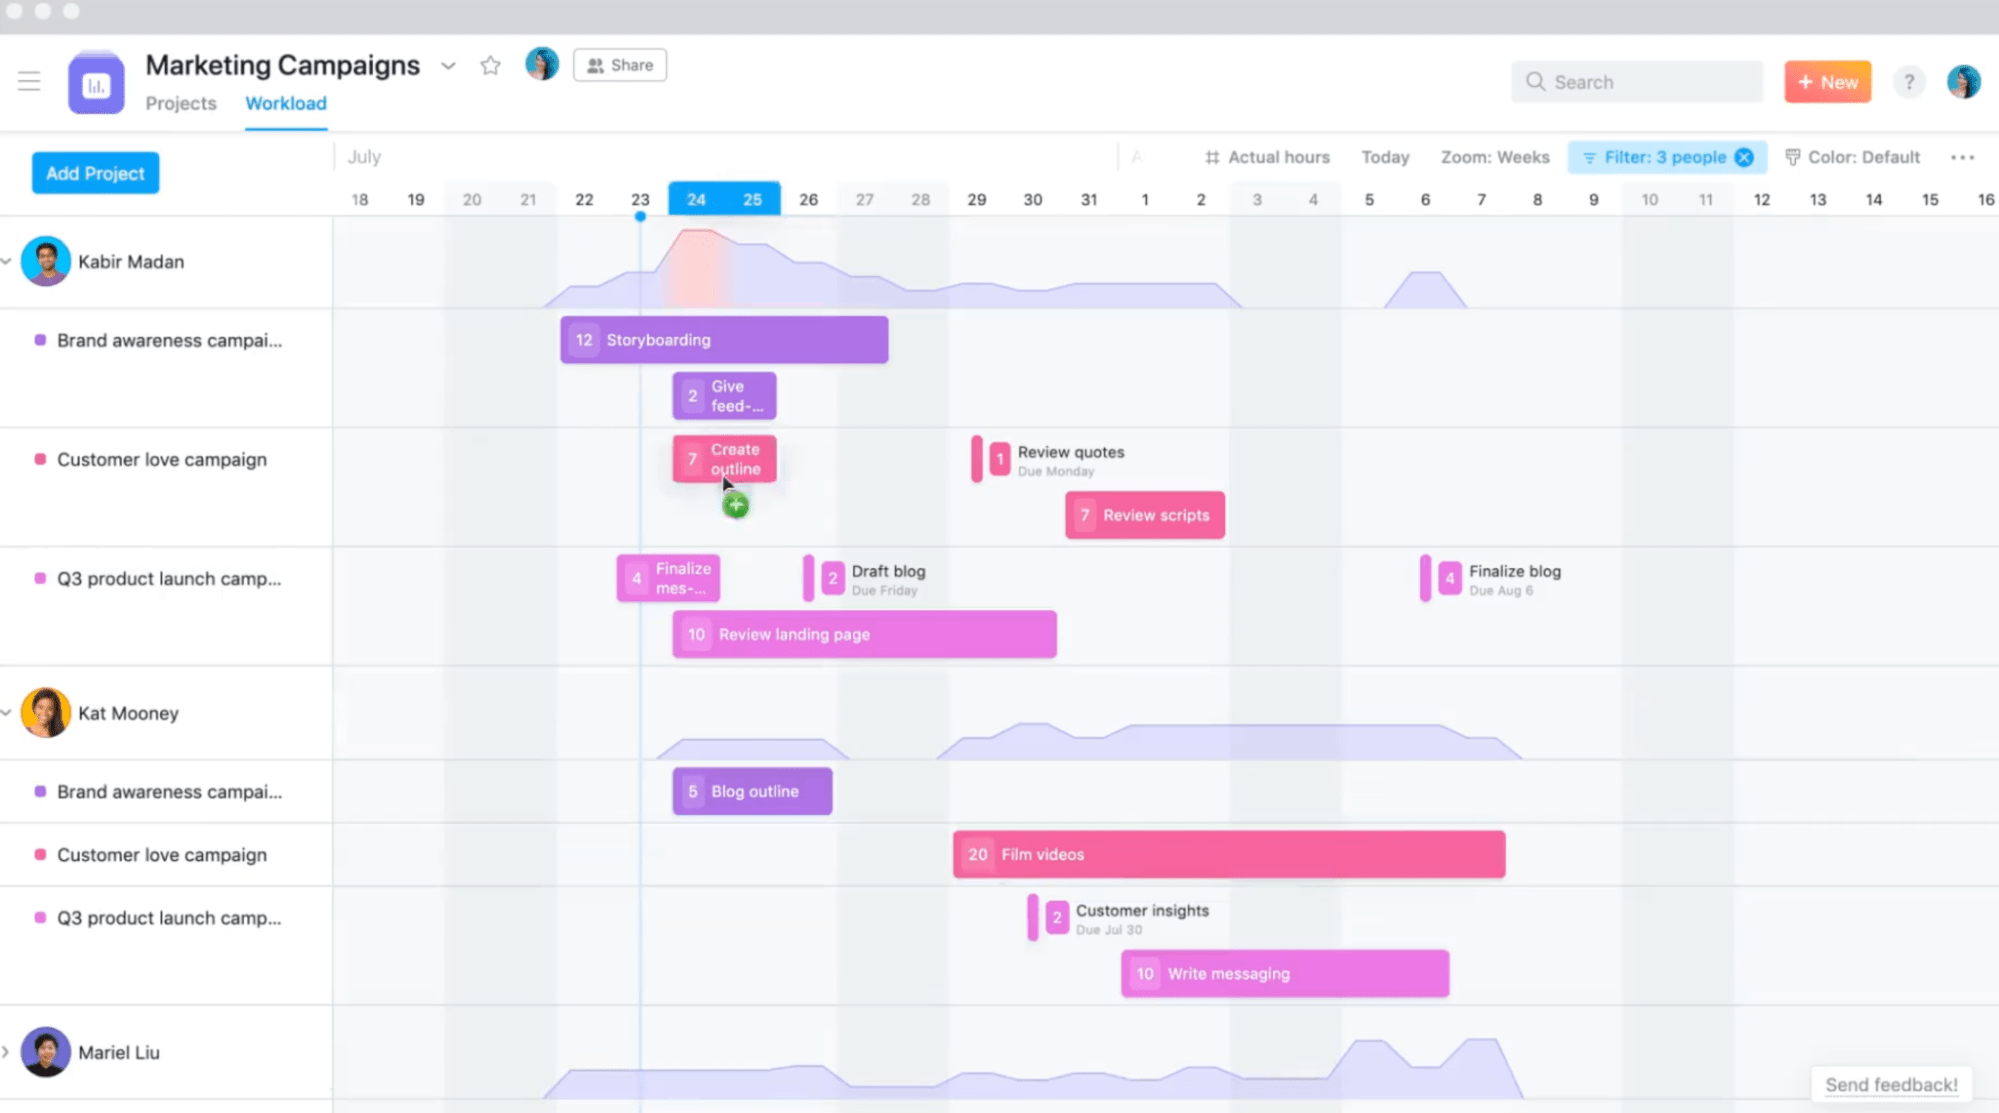
This allows you to easily track deadlines, tasks, and team capacity, managing resources effectively and avoiding conflicts while keeping projects moving forward.
Core features
- Custom portfolio views let you group related projects together for an at-a-glance view of your portfolio health and progress
- Flexible dashboards show you the data that matters most to your team
- Automatic status updates keep all stakeholders in the loop about project progress
- Workload and capacity planning views help you track utilization, forecast availability, and avoid resource conflicts
Pricing
Asana has five plans:
- Free: for individuals and small teams with basic features
- Starter: $10.99 per user per month
- Advanced: $24.99 per user per month
- Enterprise: custom pricing for enterprise-level features
- Enterprise+: custom pricing for enterprise-level features and security
3. Smartsheet
Smartsheet is a sheets-based project management platform designed to help you streamline, manage, and scale your portfolio.
Start with the “Portfolio Dashboard.” This dashboard helps busy project managers increase visibility and real-time reporting to key stakeholders through roll-up data on project status, schedules, and more.
Project-level dashboards give you more insight into real-time data on your project progress, status, milestones and health.
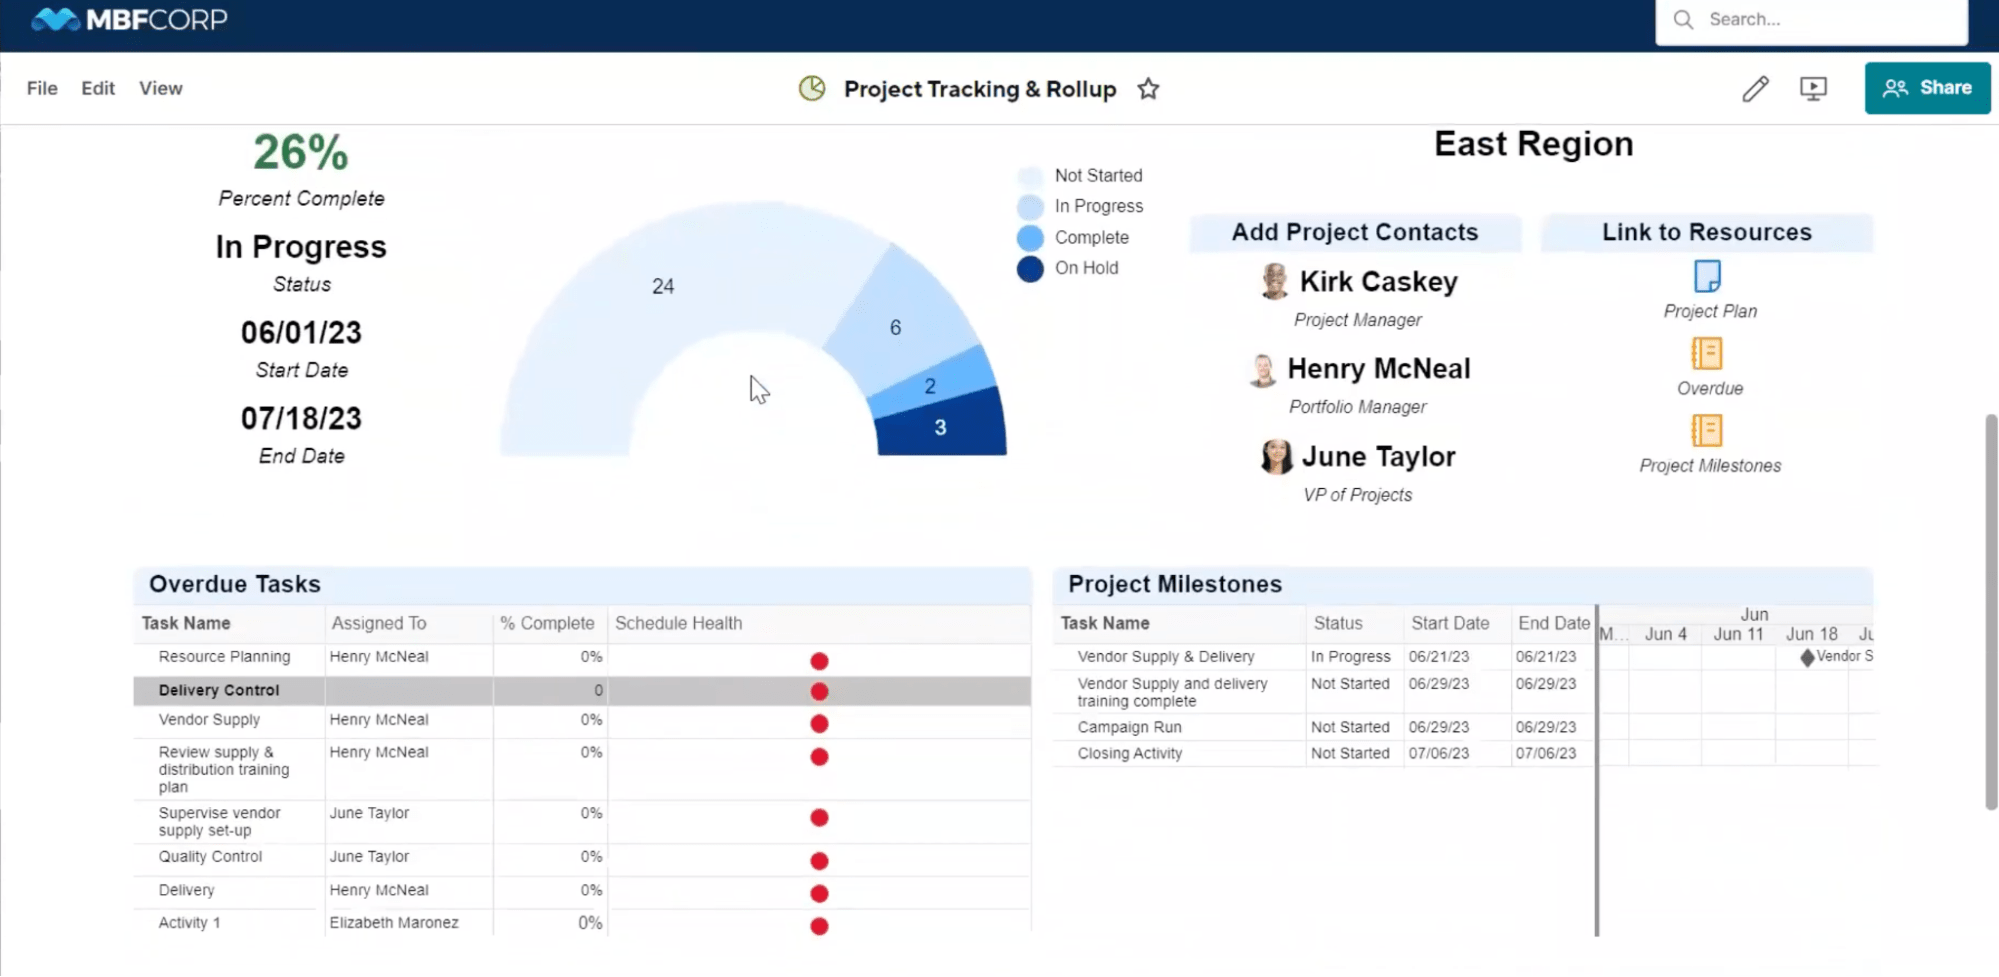
Both customizable dashboards give you real-time insight into project status and health, project budgets, and team utilization.
This helps keep projects on track and keeps key stakeholders and clients informed about the status of the projects.
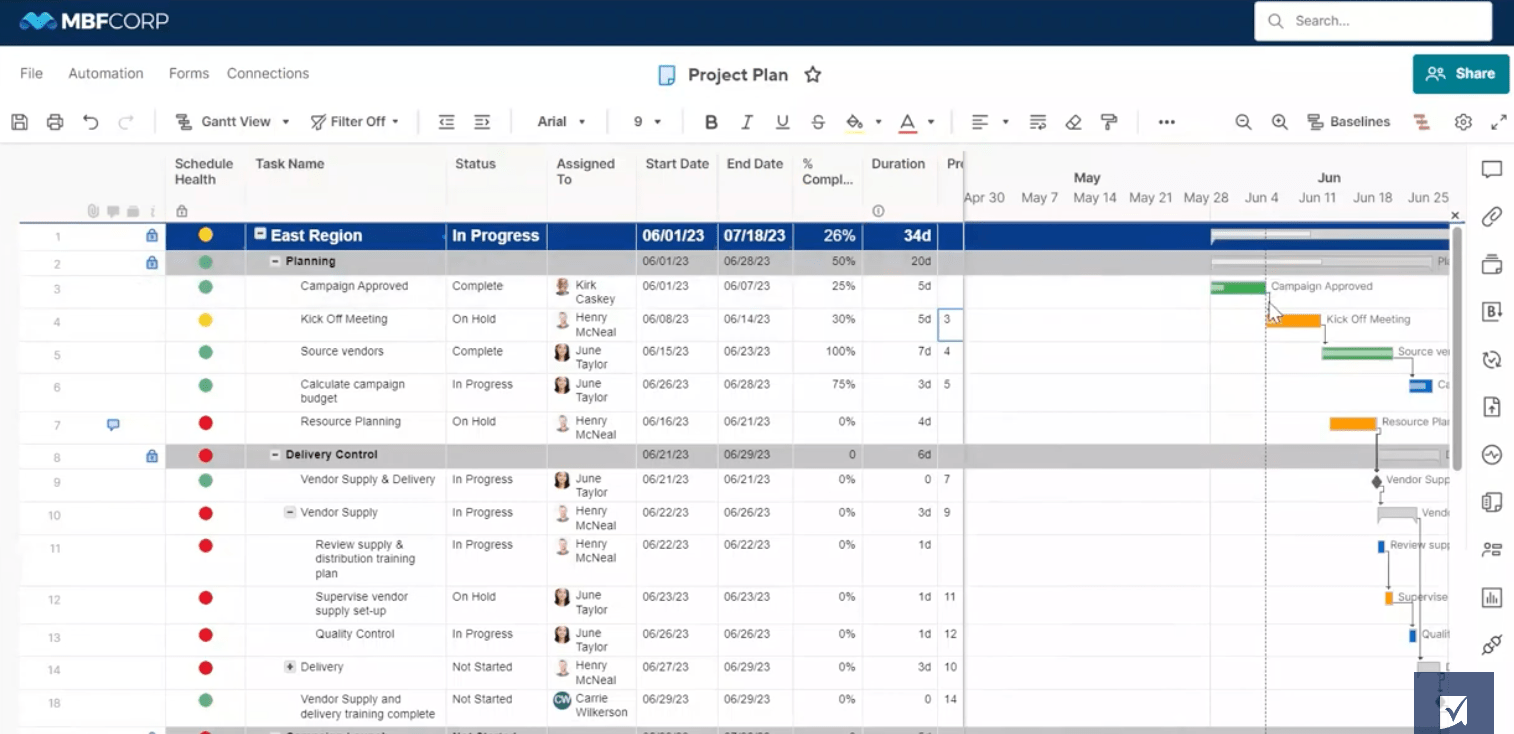
Project tracking in Smartsheet happens in a sheets-based view. You can clearly see, filter, and sort all upcoming tasks and projects by schedule health, date, assignee, completion, or another factor.
You can view your work timeline in a Gantt-based view or calendar view to get a visual depiction of your upcoming work and adjust as needed to address schedule risks or resource allocations.
If you don’t want to give up a sheets-based project tracking system, but want to increase visibility and reporting features, Smartsheet is a great option to bring your chaotic client work into one streamlined system.
What you’ll love
Smartsheet’s “Capacity” view is a great way to manage resources, improve utilization, and find the right team for upcoming projects.
Go to “Capacity,” and you’ll see the utilization and availability levels for every team in a monthly planner.
Blue blocks indicate availability, while red blocks indicate a team is over capacity. Hover over a block to see the total capacity, scheduled hours, and remaining hours.
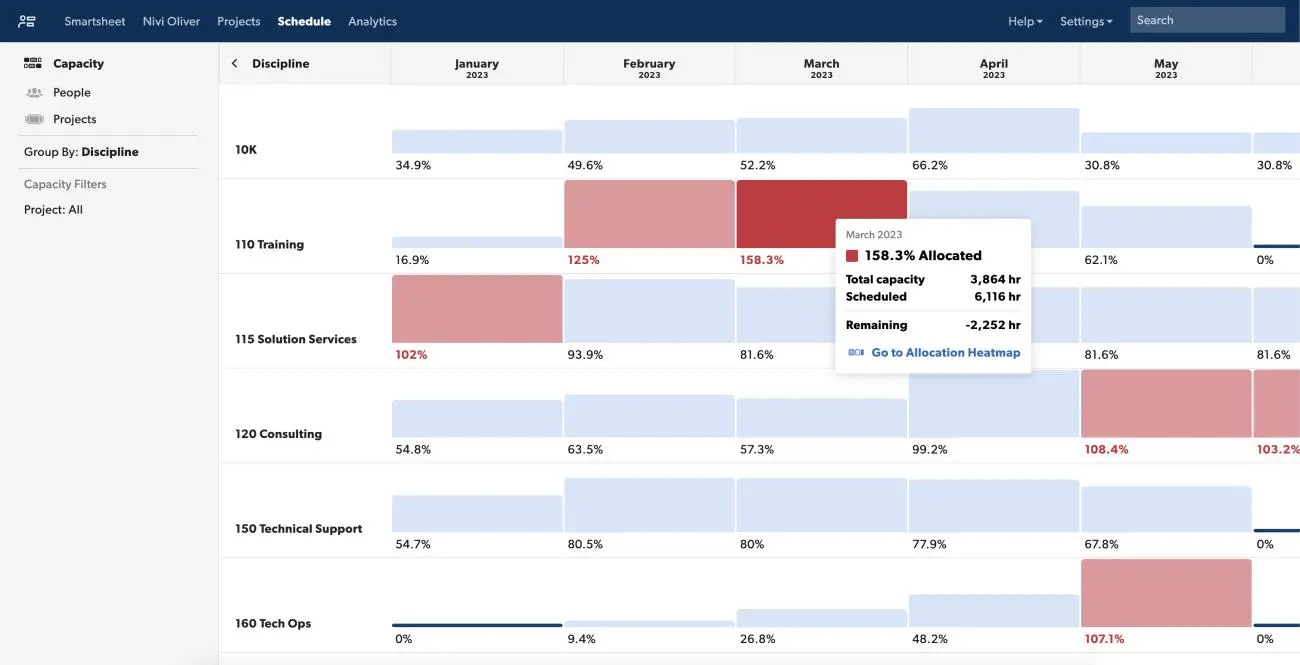
To drill down further, click “Allocation Heatmap.” You’ll see every team member in that team and their upcoming utilization.
Do you need someone to cover new work? Look for blank spaces or light blue blocks to indicate availability, and right-click to assign them a new task or project.
Or, look for team members who are over capacity, with red blocks, to drill down into what projects are assigned to them and re-assign them to other team members with more space.
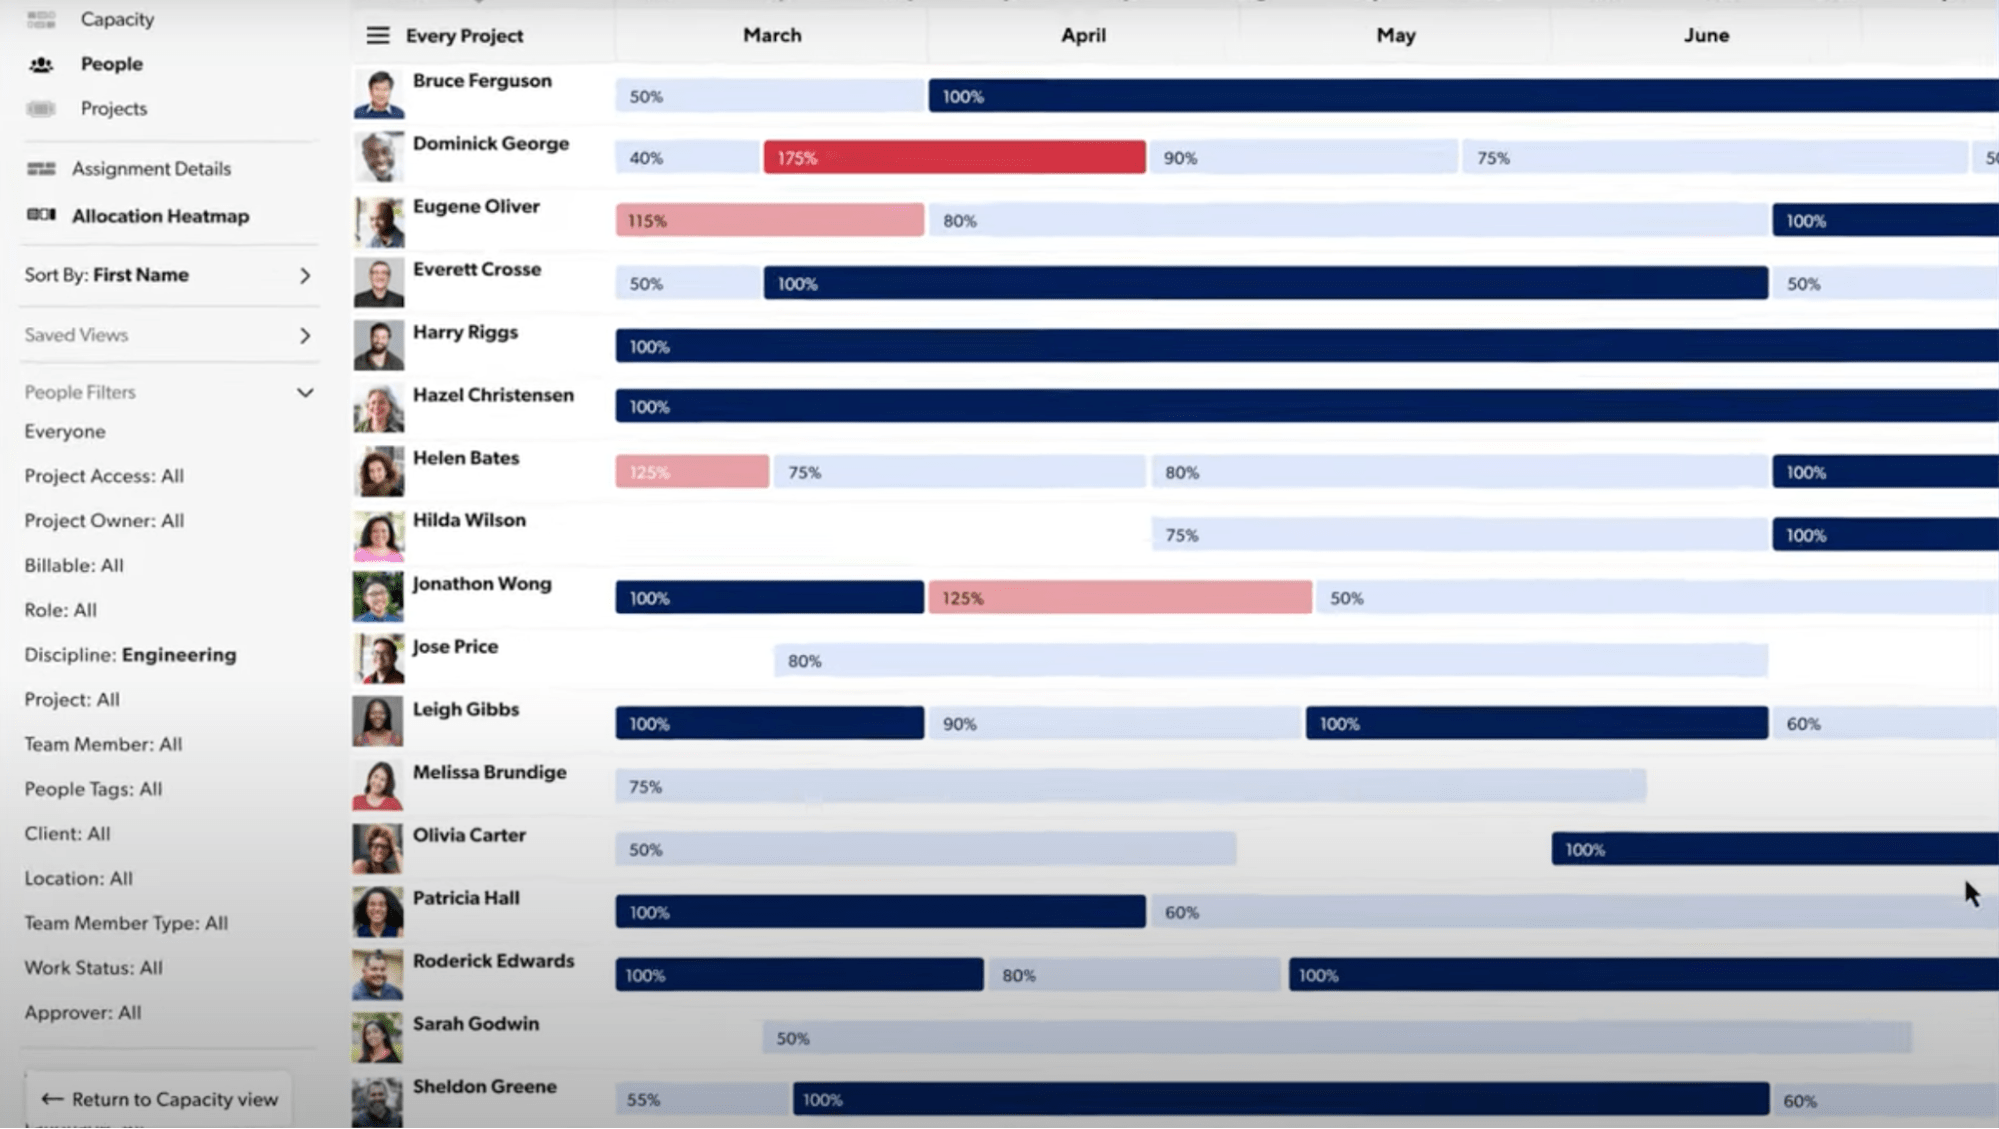
Capacity and allocation heatmaps allow you to get a bird’s eye view of your team’s work, improve utilization for more profitable projects, and ensure your team can take on new work and deliver work on time.
Core features
- Portfolio reporting dashboard gives you a high-level overview of project health and profitability
- Integrated resource planning helps you build the right team for each project or forecast hiring needs
- Time tracking tools give you essential data for invoicing, billing, and future project estimates
- Workload and capacity planning tools show you exactly who’s available, when, so you can boost utilization
Pricing
Smartsheet has a free plan and three paid plans:
- Basic: Free for up to one user and 2 editors.
- Pro: $7 per user per month
- Business: $25 per user per month
- Enterprise: custom pricing upon request
A 30-day free trial is available.
4. Runn
Runn is a resource management tool with features to make project planning and resource management exist hand-in-hand.
All projects in your portfolio are shown in the “Projects” view by default. You can see all your projects on a timeline, with key milestones on the time bar.
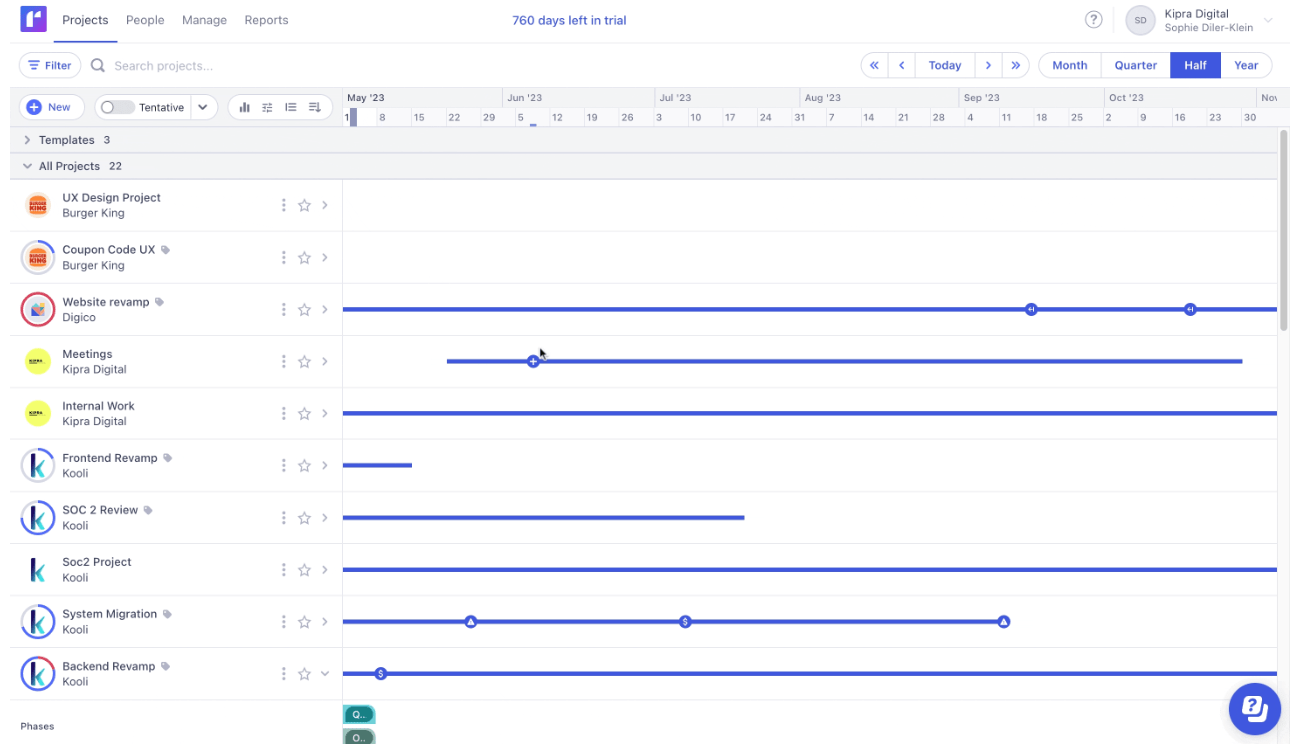
For more details, click on any project to view scheduled phases and resources. Each resource scheduled will be listed below, and you’ll be able to see their allocations along the timeline.
This is super helpful for getting a high-level overview of your entire portfolio, who’s assigned to what, and where your resource capacity, overload, and bottlenecks are.
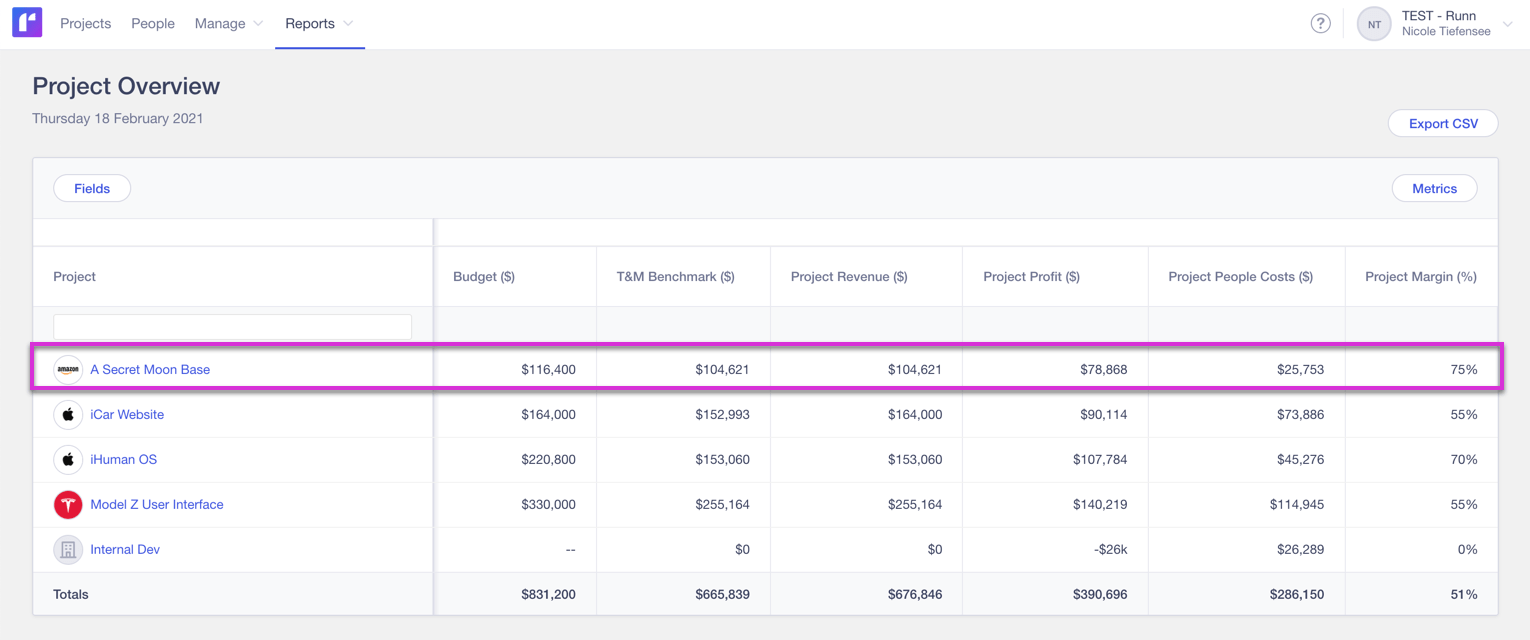
To view more data on your portfolio, head to “Reports” and then find the “Project Overview.”
Here you’ll see all your projects at-a-glance again, but this time, you’ll also see key metrics like:
- Budget
- T&M Benchmarks
- Project Revenue
- Project Profit
- Project People Costs (based on scheduled hours and set labor rates)
- Project Margin
One unique thing Runn does is keep all the project details—from resource allocations to phases and milestones—in one view.
If you don’t need granular task-planning detail, Runn makes it simple to see and manage all your projects at a glance, and focus on your more valuable resource: your people.
At the same time, high-level project reporting lets you monitor revenue, profits, and margins in one dashboard, making it easy to increase project profitability and stay on track.
What you’ll love
Runn’s group utilization charts make it so much easier to manage resources and optimization.
Find the charts under the “People” tab in Runn.
From there, you can filter by role, team, employment type, or custom tags. Within your sorting groups, you’ll see utilization levels graphed on a chart.
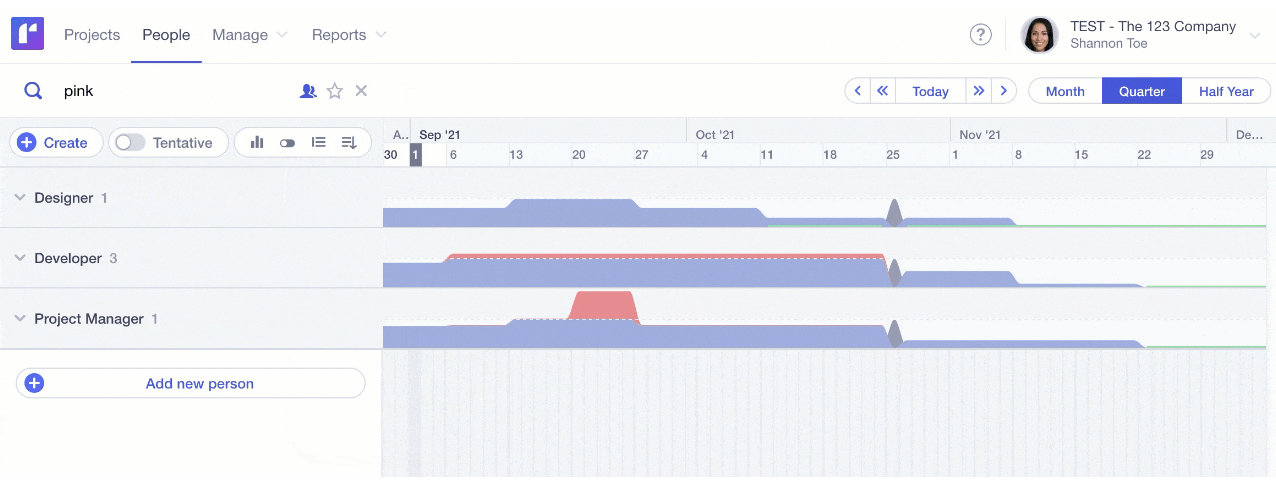
Blue indicates the current level of utilization. Red spaces indicate dates when teams or team members are overallocated.
To examine overutilization, simply click the carets by the grouped tabs to see everyone included in that group or search for a specific team member.
You’ll be able to see their exact scheduled projects and capacity, which will allow you to quickly spot gaps and reassign or move work as needed.
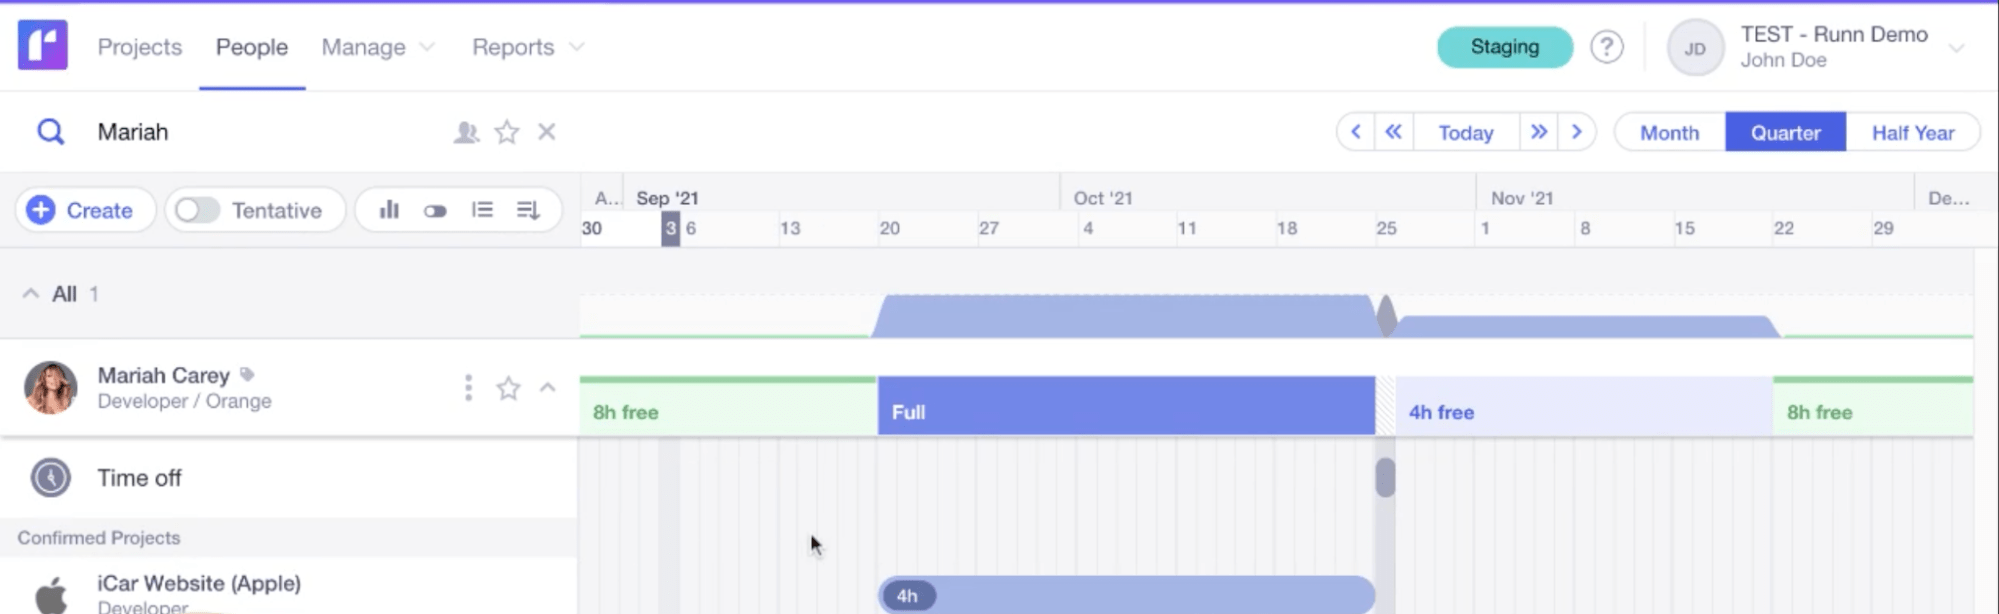
The best part:
You can toggle on the “Tentative” filter to include tentative projects to your capacity and utilization charts, making it easy to see how projects in your pipeline will impact your utilization. You can also quickly identify availability for project staffing and set realistic timelines for projects in your pipeline.
Core features
- Streamlined project portfolio view shows you high-level progress and milestones, so you know exactly where things stand
- Scheduled vs. budget planning markers let you track scheduled work against your budgets and keep projects profitable
- Scenario planning and forecasting tools show you how potential projects will impact workload, capacity, financials and more
- Resource utilization heatmaps show you who’s over and under-utilized for better resource management
Pricing
Runn has a free plan and two paid plans:
- Free: up to five users with unlimited projects
- Pro: $8 per user per month
- Enterprise: custom pricing for custom requirements
A 14-day free trial of Runn’s Pro Plan is available.
5. monday.com
Monday is a project portfolio management software that helps connect strategy to execution.
In the “Portfolio” section, you’ll get three main views: “Projects,” “Gantt,” and “Snapshot.”
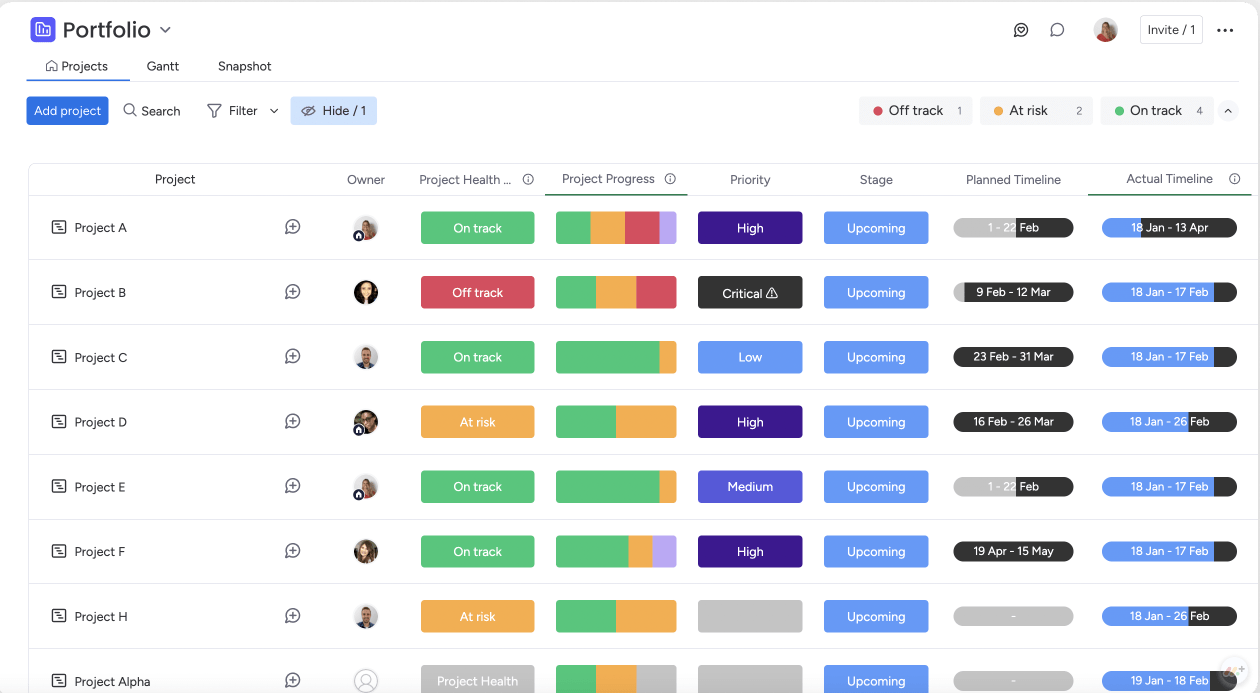
From the “Projects” view, you’ll see all of the projects included in your portfolio, along with high-level health indicators like:
- Project health
- Project progress
- Priority
- Stage
- Planned timeline
- Actual timeline
These indicators are color-coded, so you can easily monitor project status and see where bottlenecks or problems are happening.
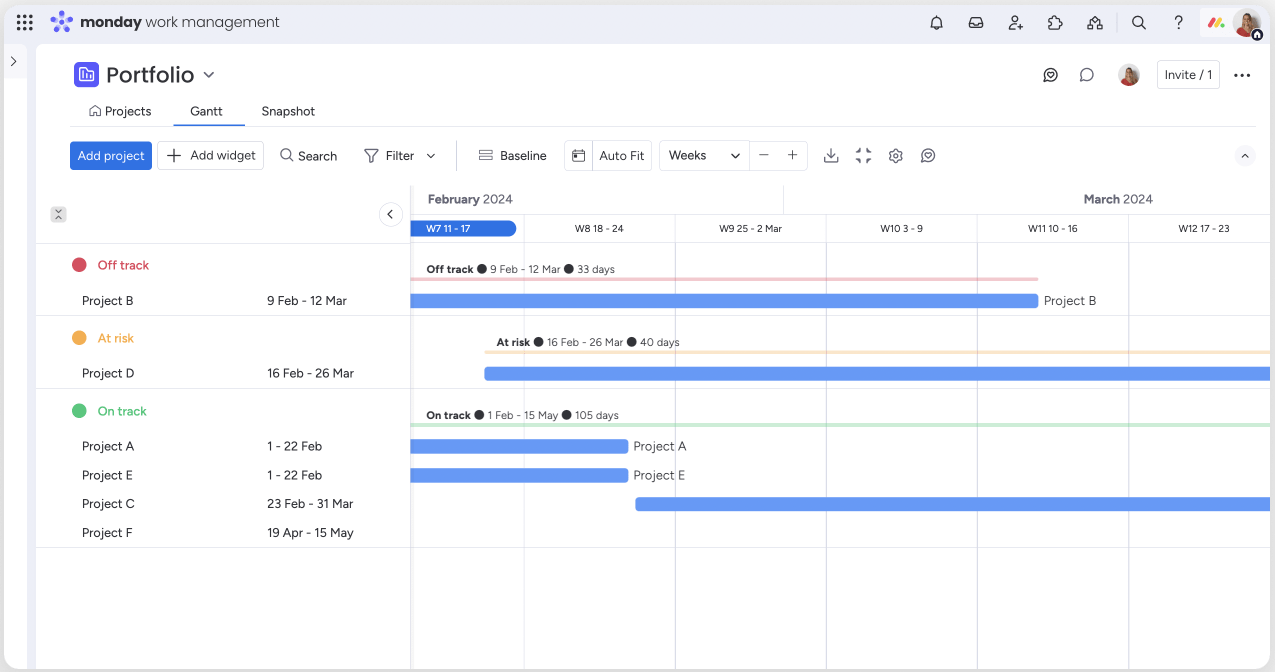
Switch to the “Gantt” view to see all your projects on a timeline view. They’re auto-sorted by “Off-track,” “At risk,” and “On track,” so you can quickly see what needs attention.
Finally, if you’re ready to see details on individual projects, you can click into them from the sidebar of the “Portfolio” view.
“Project” views show you all the granular details about your project. From here, you can easily manage project status and progress, and drill down into what needs to happen to get “at risk” projects back on track.

All of these portfolio and project views allow team members and project managers to collaborate and quickly understand what needs to take priority to deliver on-time projects.
What you’ll love
The custom reporting features within monday.com help stretched-thin project managers who need real-time, customizable views of budgets, revenue, project progress, and more.
To create your own reports, go to the view for any project and click the “+” button to add a new dashboard. Once in the dashboard, click the “+Add widget” button to choose from a variety of widgets to display your data. For example, you can add:
- Charts
- Time tracking widgets
- Calendars
- Gantt charts
Once you’ve added widgets to your dashboard, they’ll automatically populate with data from your project board.
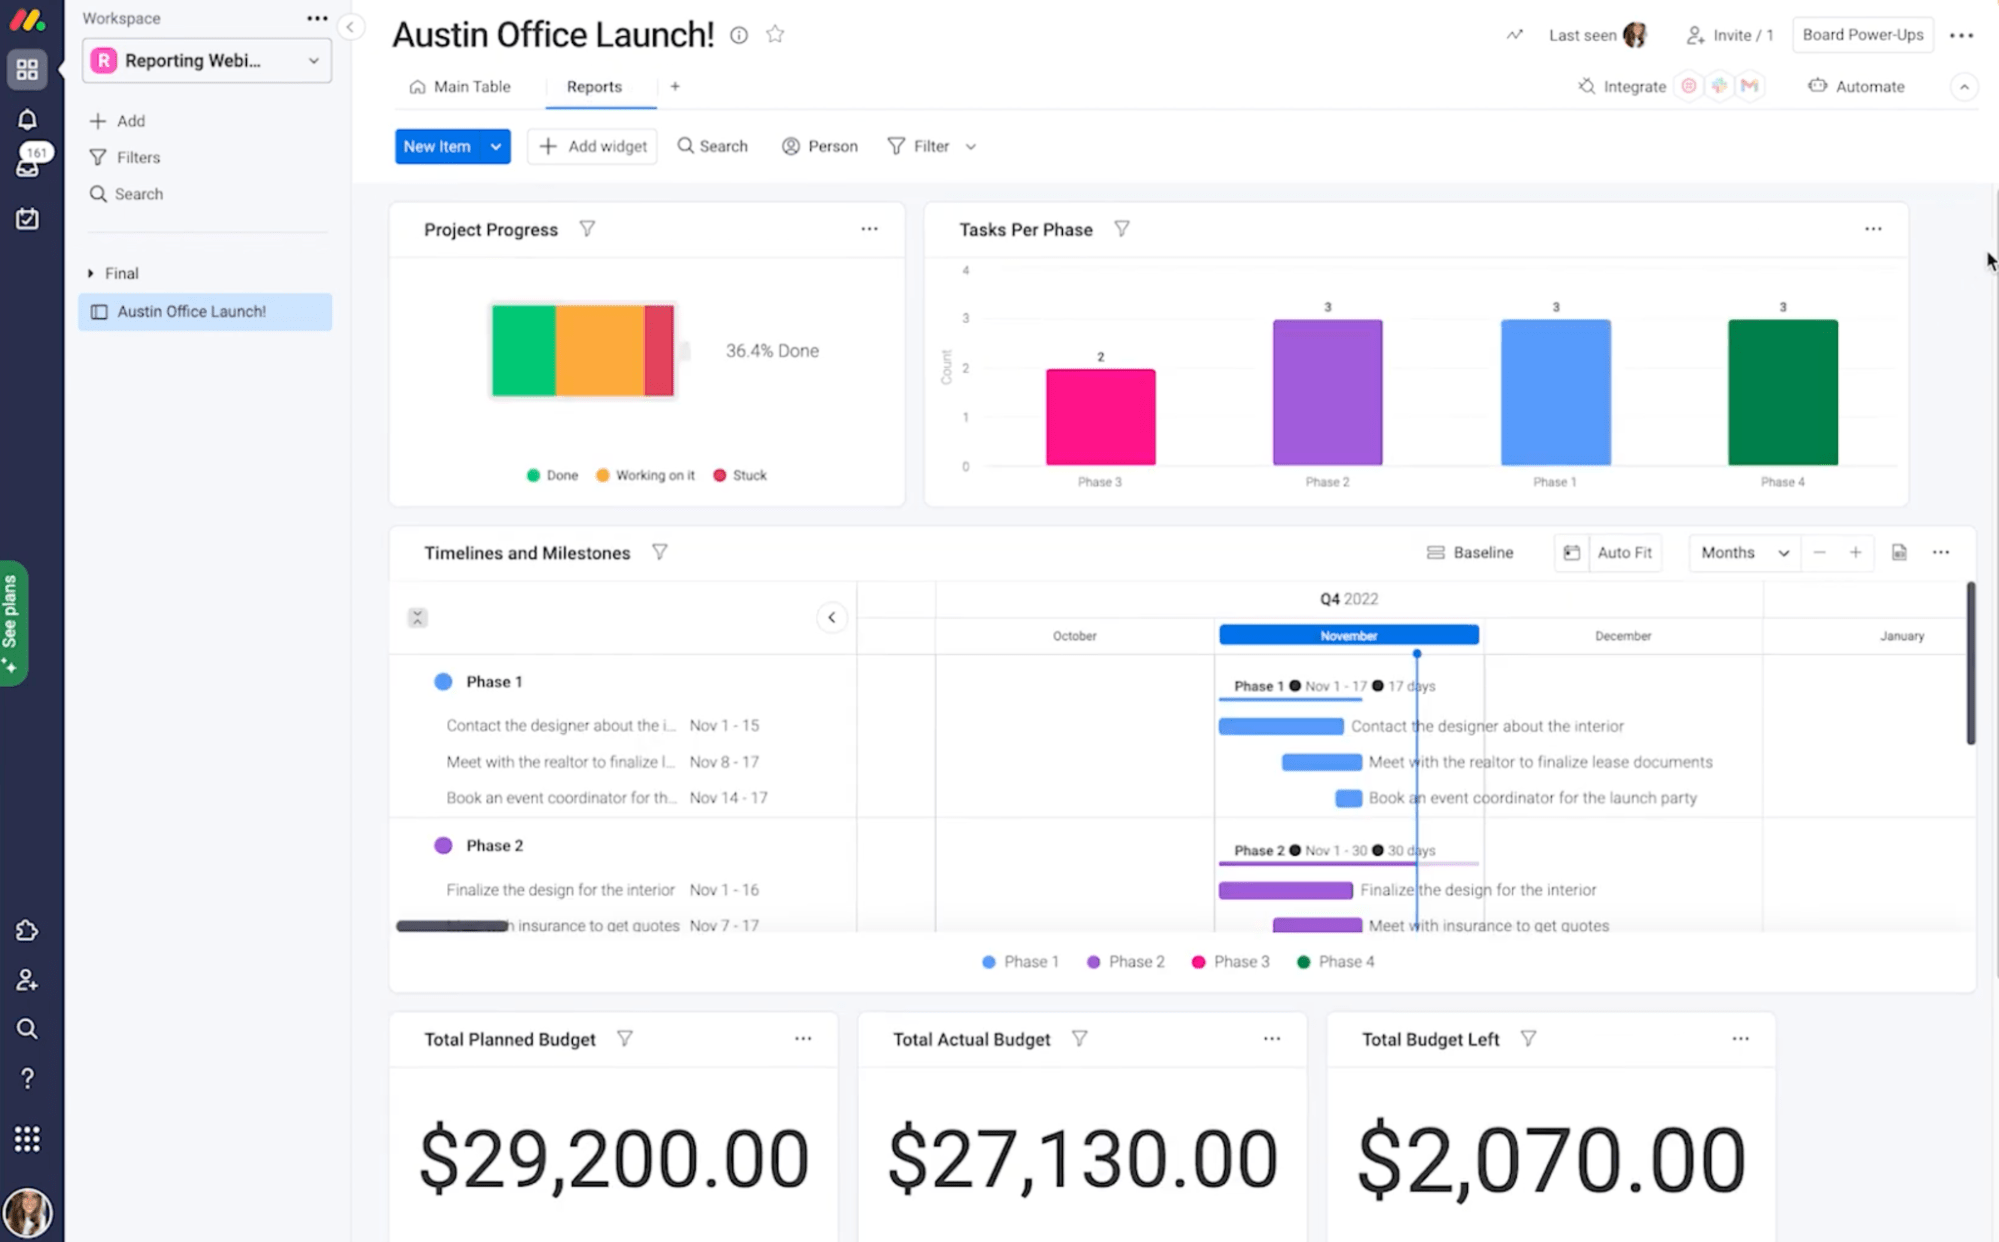
To customize what data each widget shows, click the three dots at the top right corner of each widget and click “Settings.”
From here, you can choose the data you want to view, view options, labels, and more.
With custom widgets and dashboards, you can pull in data from anywhere and create exactly the reports you need to monitor your entire portfolio or provide project and status updates to your executive team.
Core features
- Project portfolio views offer immediate visibility into project health, progress, workload, and more
- Gantt chart views show you project milestones and timelines so you can monitor progress and identify bottlenecks
- Portfolio-level reports and dashboards let you visualize essential data and report to key stakeholders easily
- Time tracking makes it easier to accurately estimate projects and keep things profitable by monitoring budgets vs. actuals
Pricing
Monday.com has five plans:
- Free: for up to two seats
- Basic: $9 per user per month
- Standard: $12 per user per month
- Pro: $19 per user per month
- Enterprise: custom pricing for enterprise-level features
A 14-day free trial of the Pro plan is available.
6. Liquid Planner
Liquid Planner is a project portfolio management solution that uses predictive insights and analytics to help you better balance your resources and portfolios.
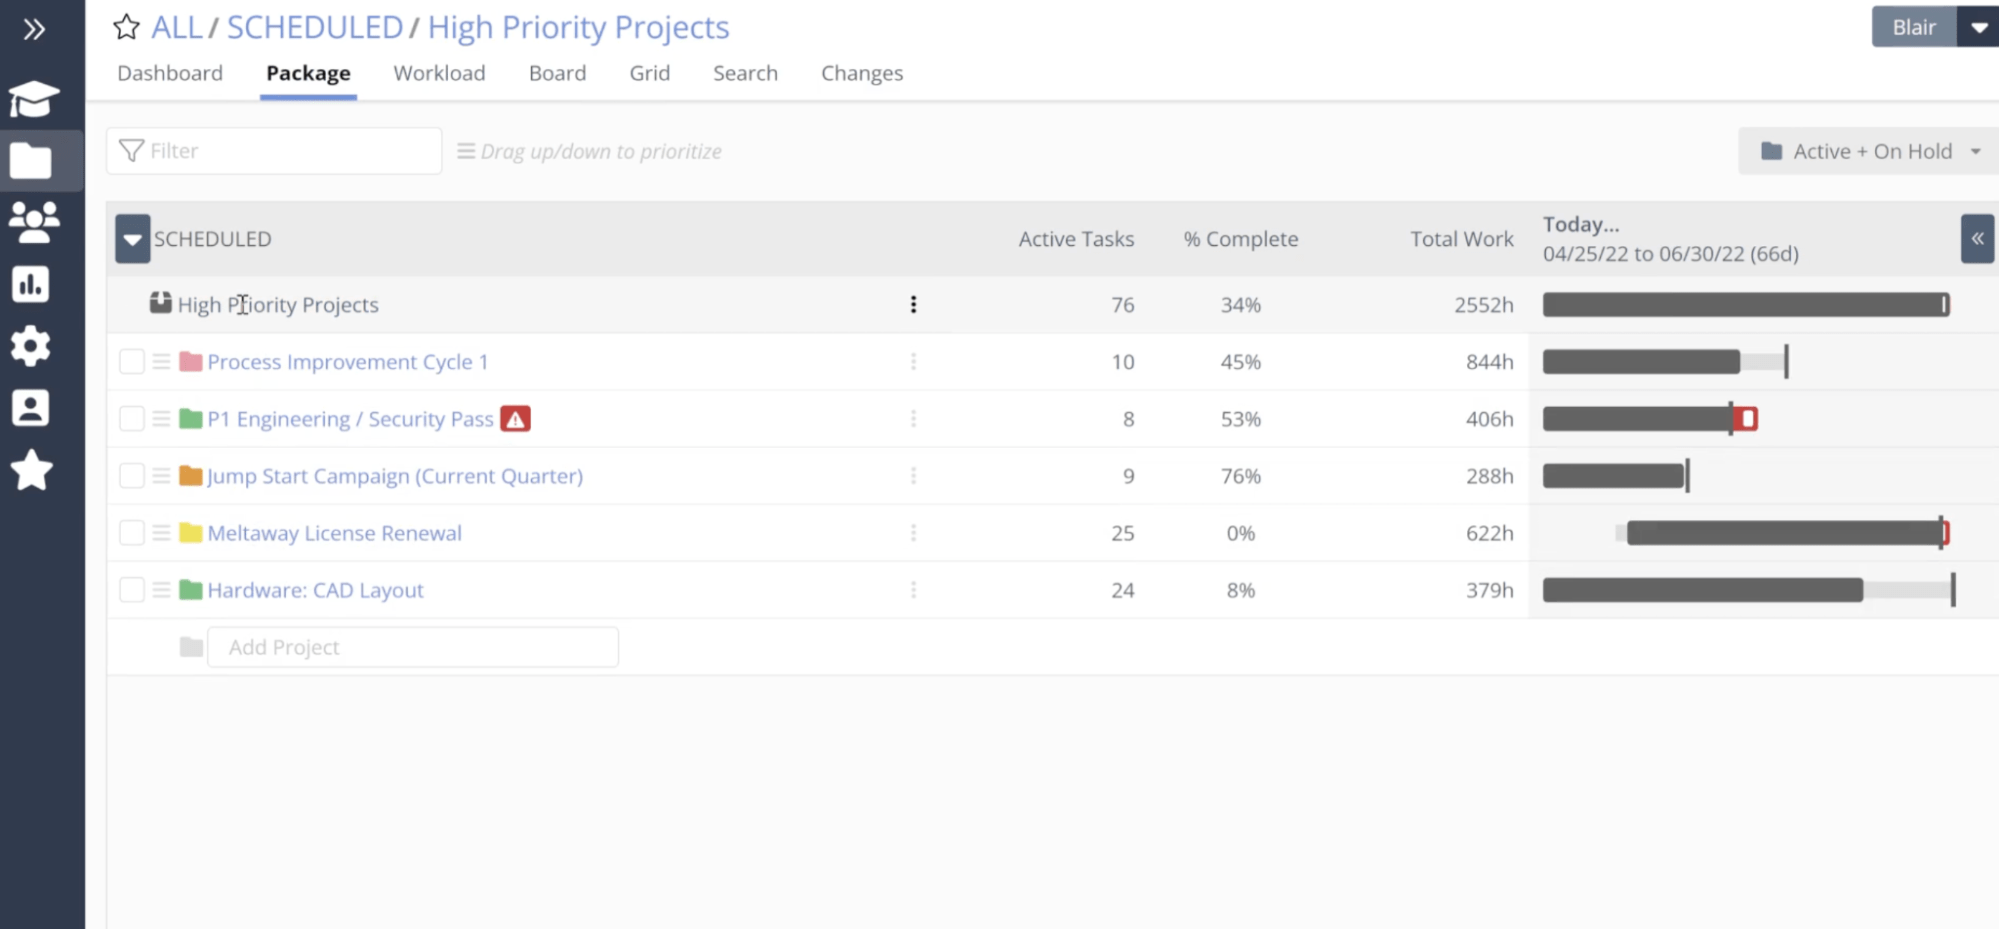
Their high-level “Package” view shows your entire portfolio so you can get quick visibility into all your projects and their status. You’ll see projects grouped by priority, along with the “Active Tasks,” “% Complete,” “Total Work” in hours, and timeline for all of those projects. To drill down further, click on any grouping to see the projects included and the breakdown of that data.
From here, you can quickly see what projects are moving along smoothly, and which ones have blockers or bottlenecks.
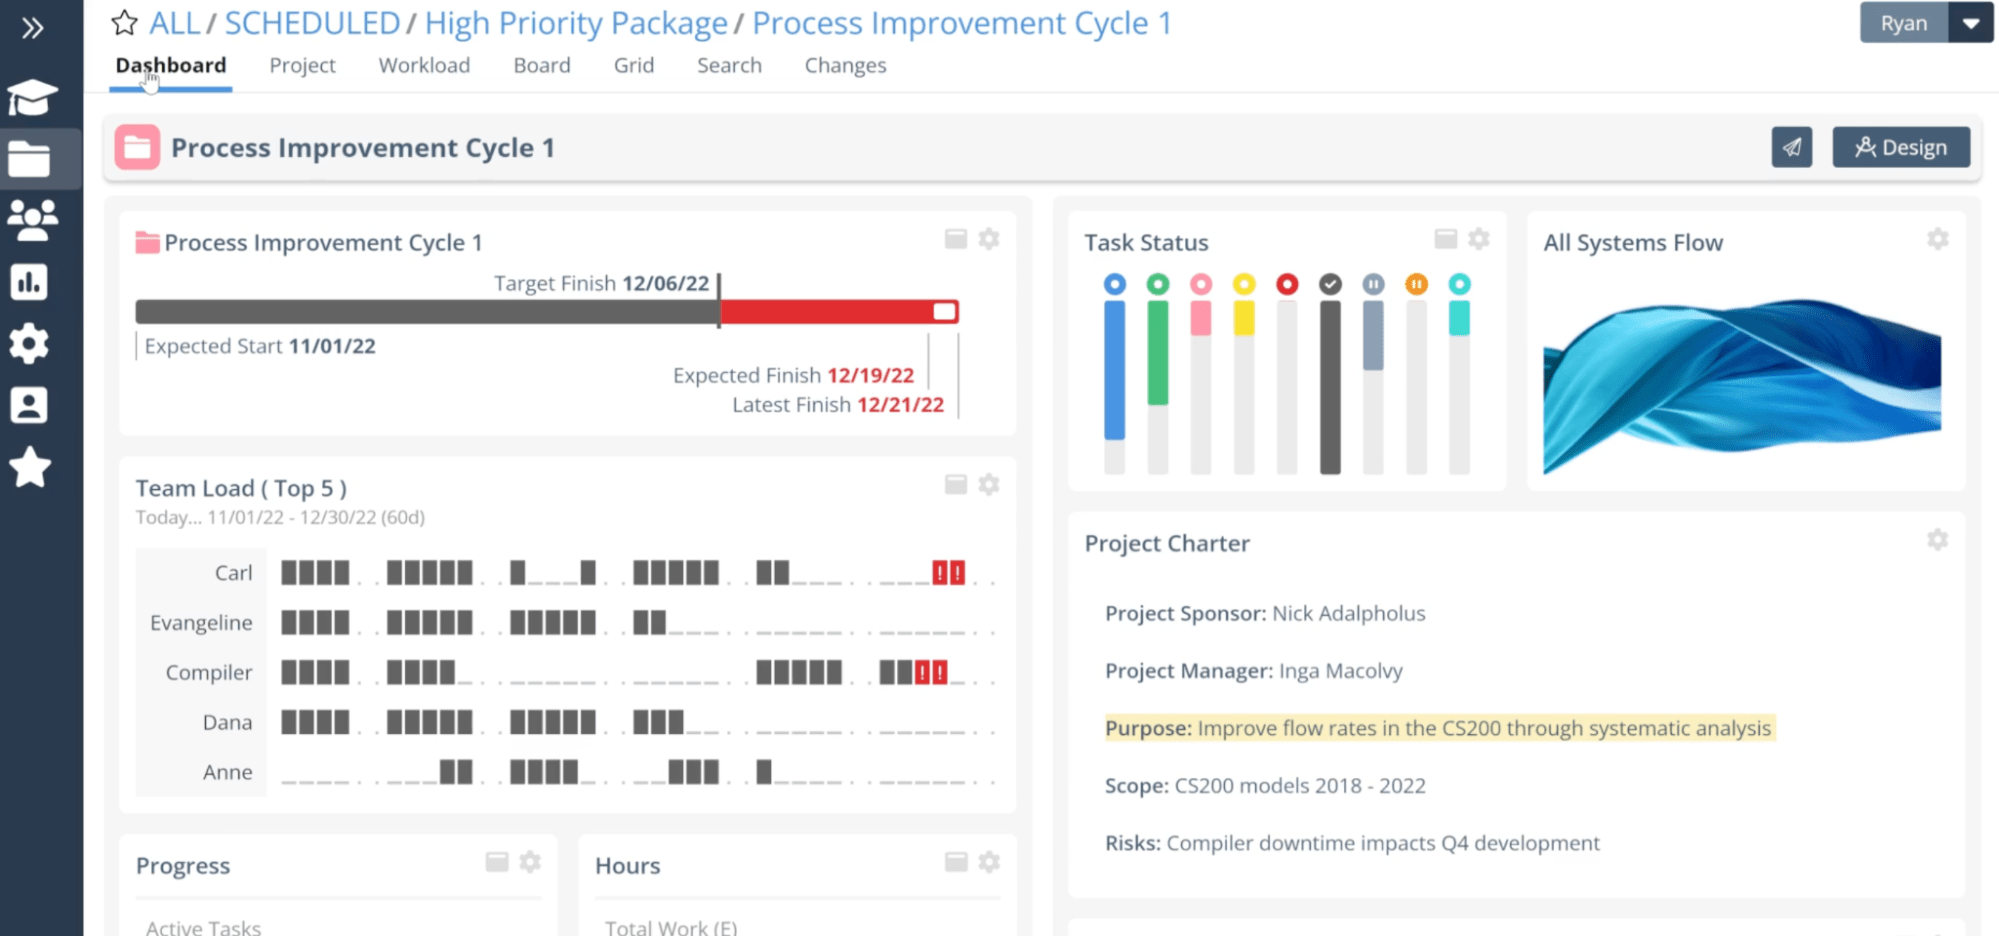
For project-level details, click on the project title from this portfolio view to jump to the project “Dashboard.”
This provides an at-a-glance look at important project metrics like:
- timeline and projected finish dates
- task statuses
- workload and capacity for your team
- project progress and hours
This is a great way to quickly assess the project’s progress and identify areas that need attention.
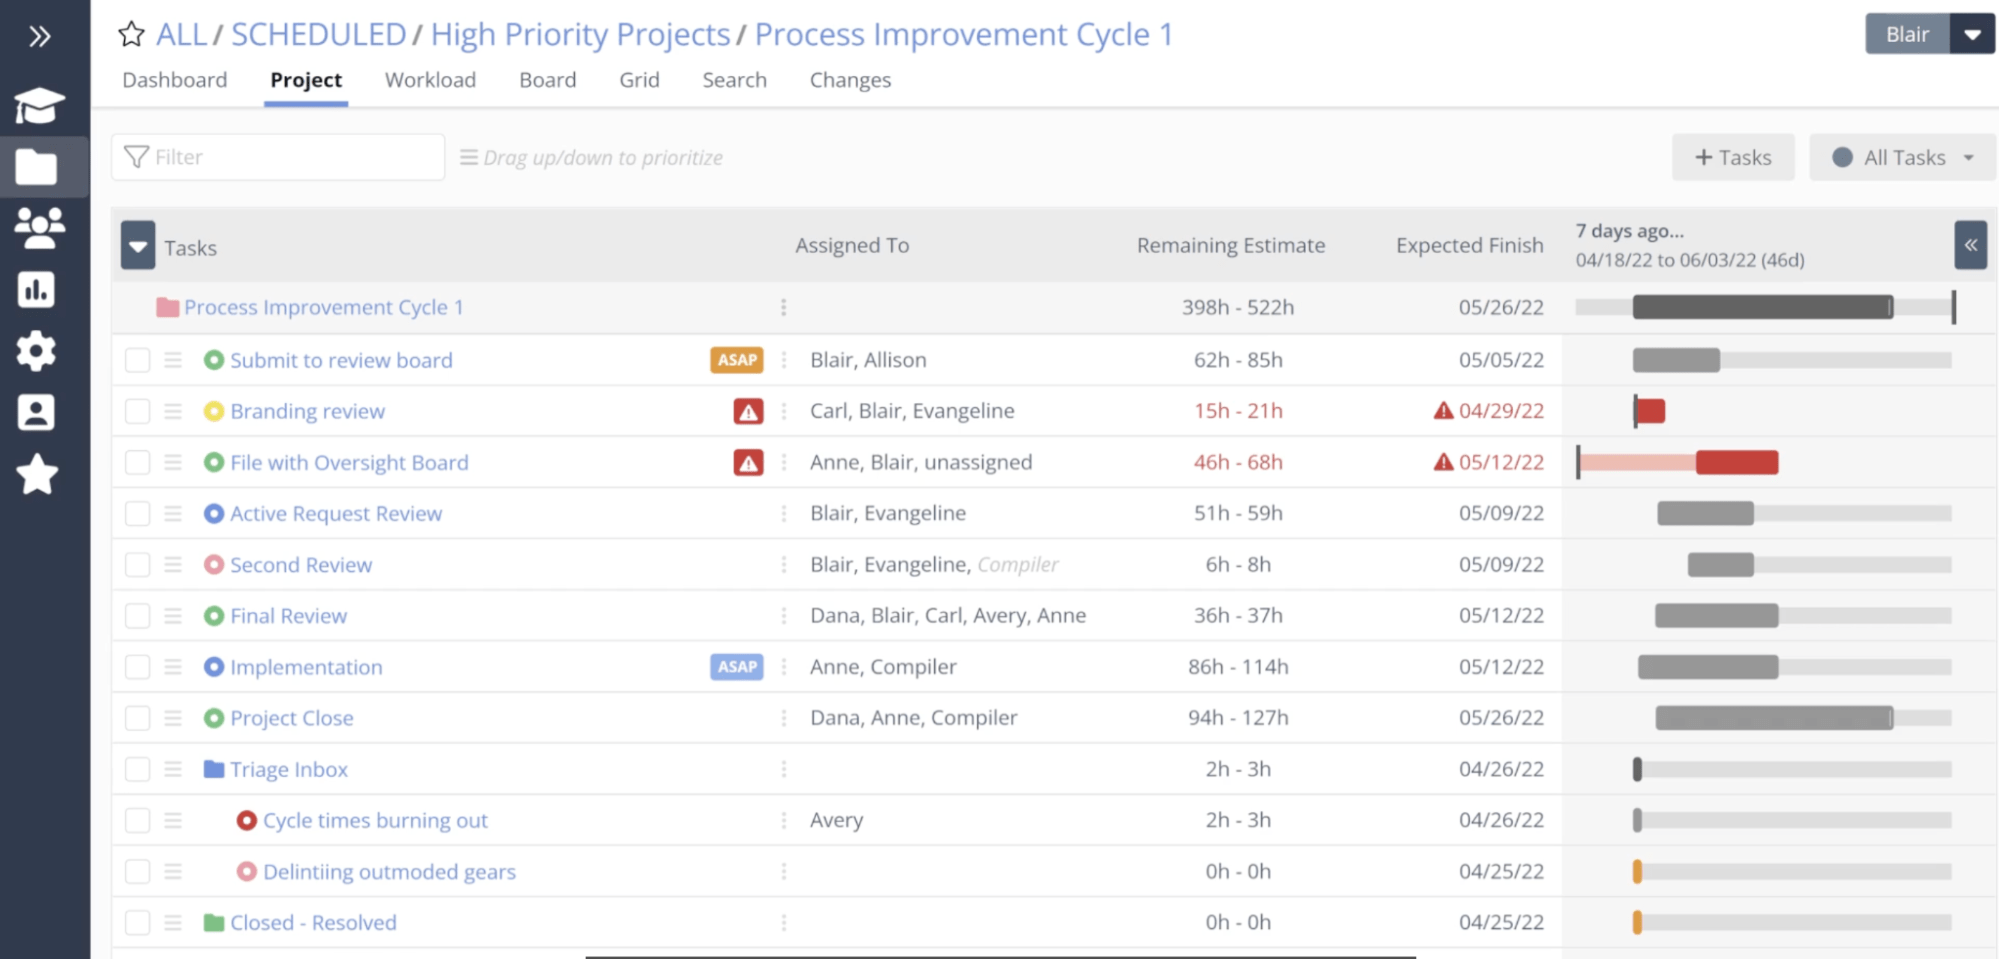
If you spot problems or potential bottlenecks, click the “Project” tab to see all the tasks in the project, as well as timeline and capacity. Here, you can see overdue projects that take longer than expected or need other attention.
With all your project data in one place, it’s easy to see what needs attention — and quickly make adjustments — or manage reporting and updates on your entire portfolio.
What you’ll love
Liquid Planner’s “Balanced Workload” feature helps project managers quickly see schedule risks, resource conflicts, and potential bottlenecks — and helps you know exactly how to take action.
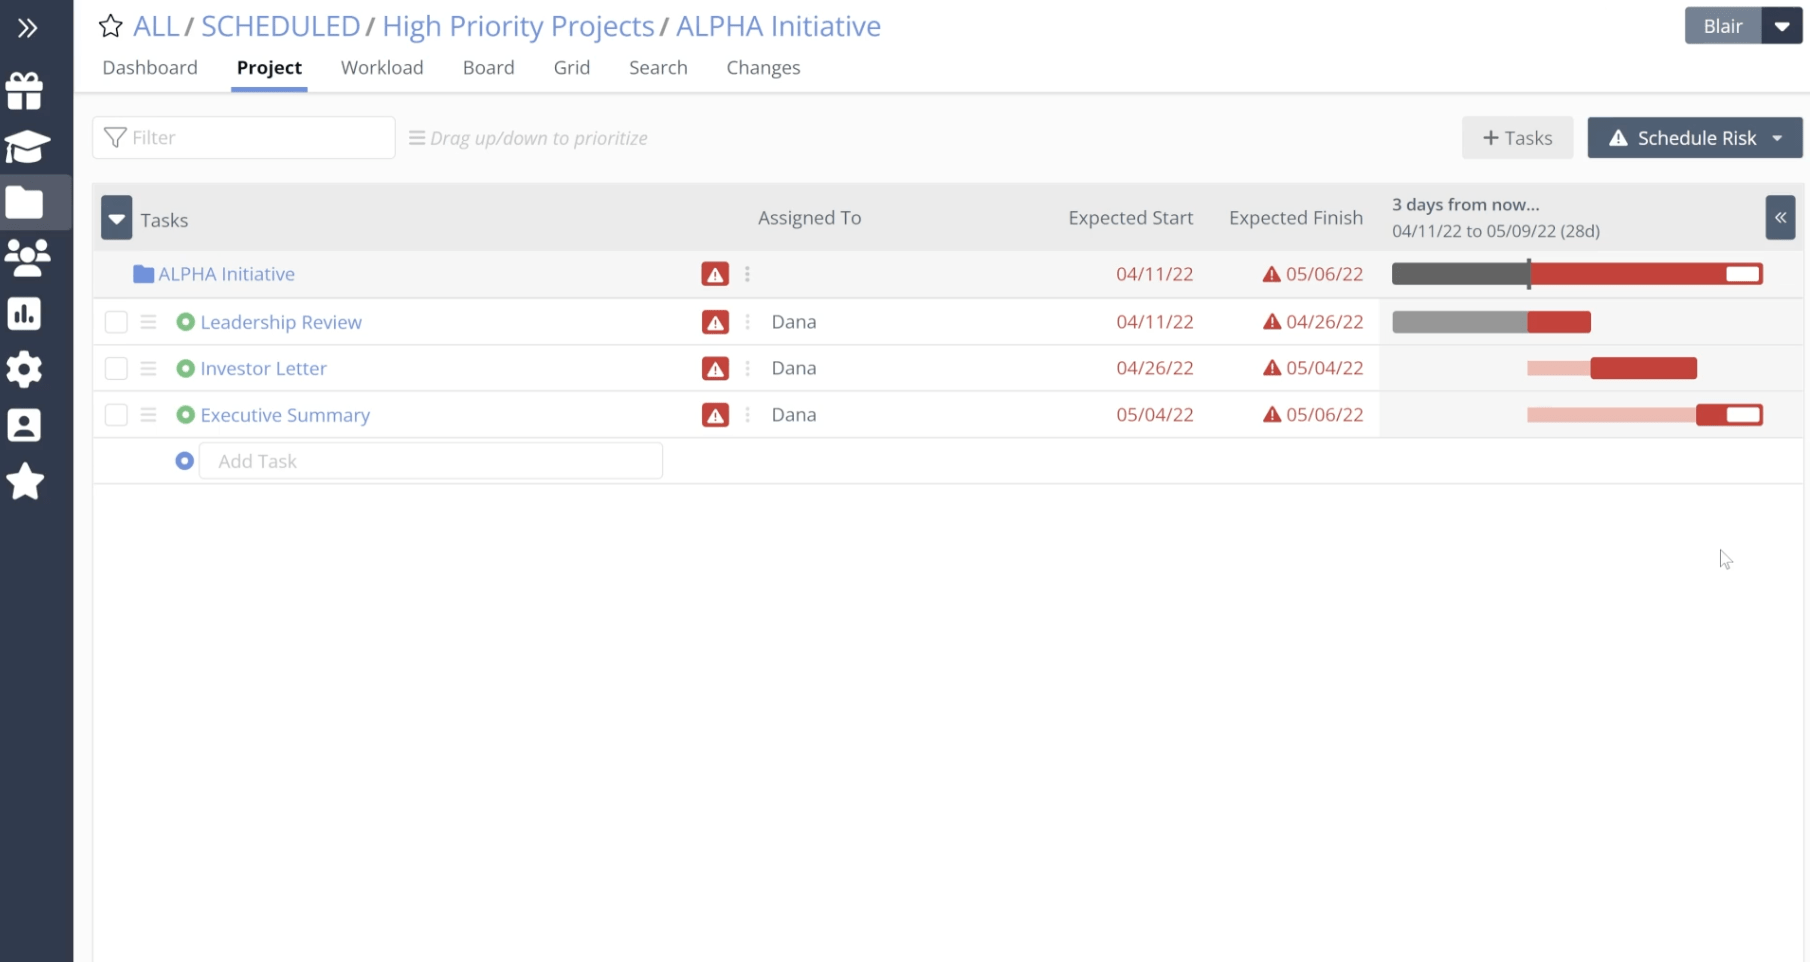
Start from the “Project View,” then filter your tasks by clicking the “Schedule Risk” filter from the toolbar dropdown.
Now, you’ll see all the tasks at risk of creating bottlenecks or going over the timeline.
Once you identify where action is needed, the “Workload View” will help you decide what to do next.
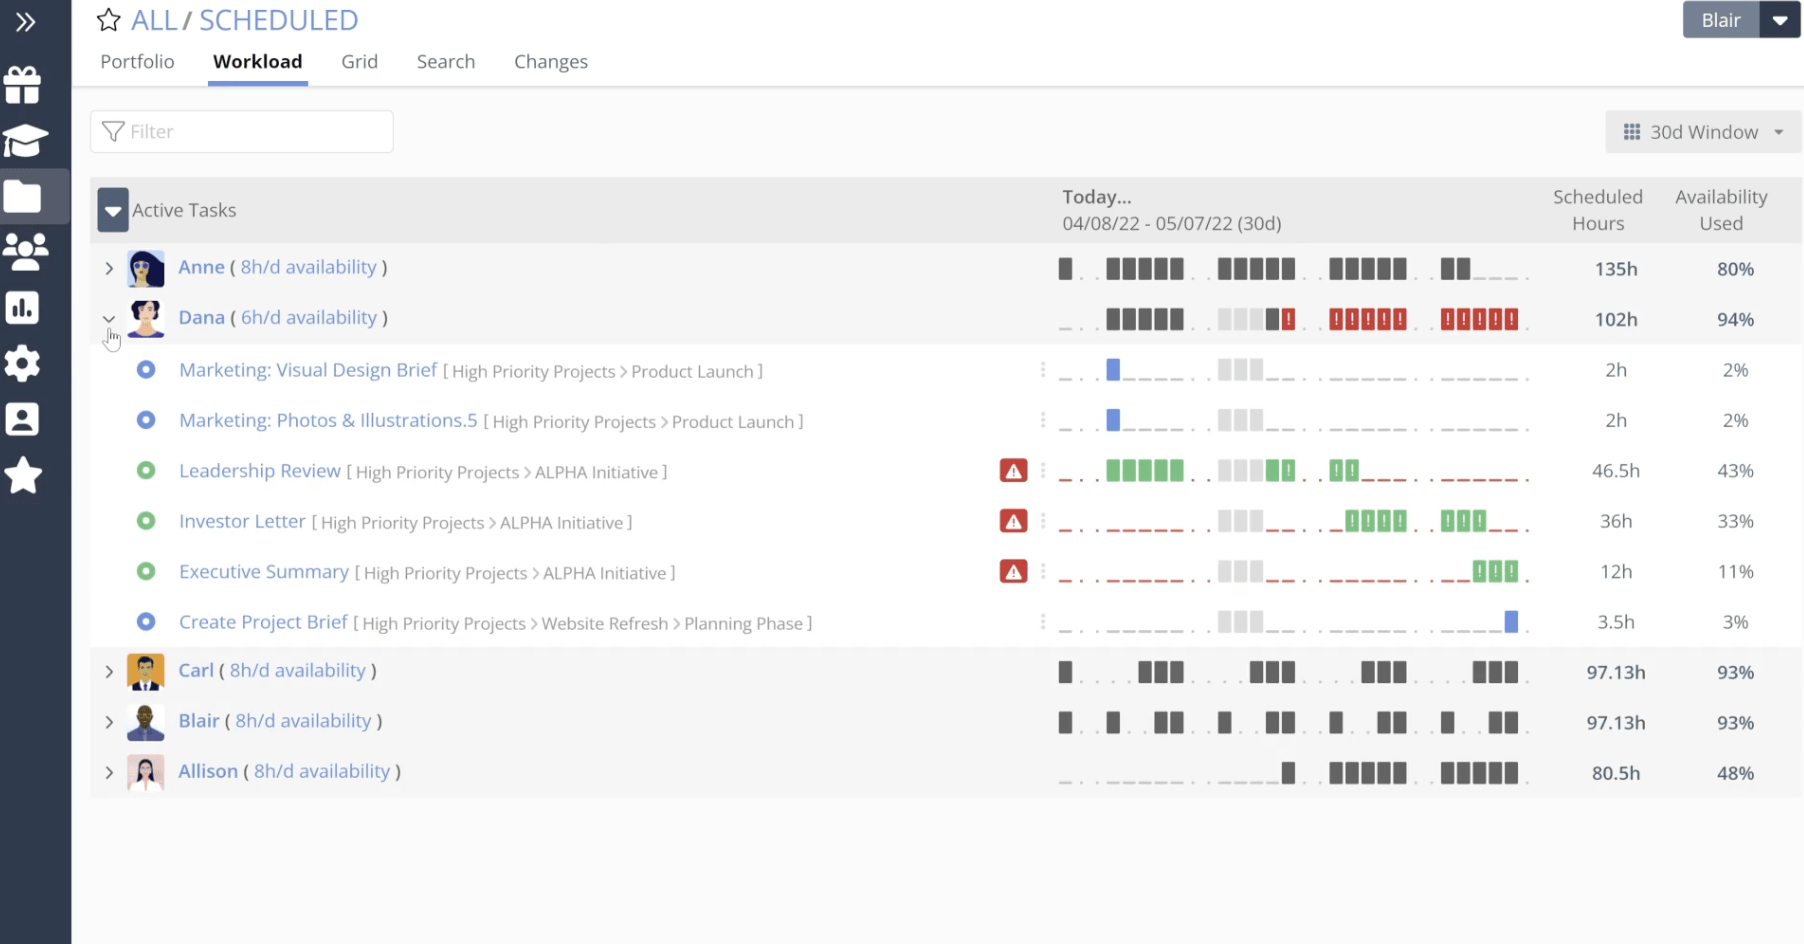
In “Workload View,” you’ll see all team members assigned to work within this project.
The “Scheduled Hours” column shows the work each person has scheduled, and the “Availability Used” column shows their current utilization, so you know who can take on new tasks.
The table shows you how work is distributed so you can see exactly where those bottlenecks are occurring.
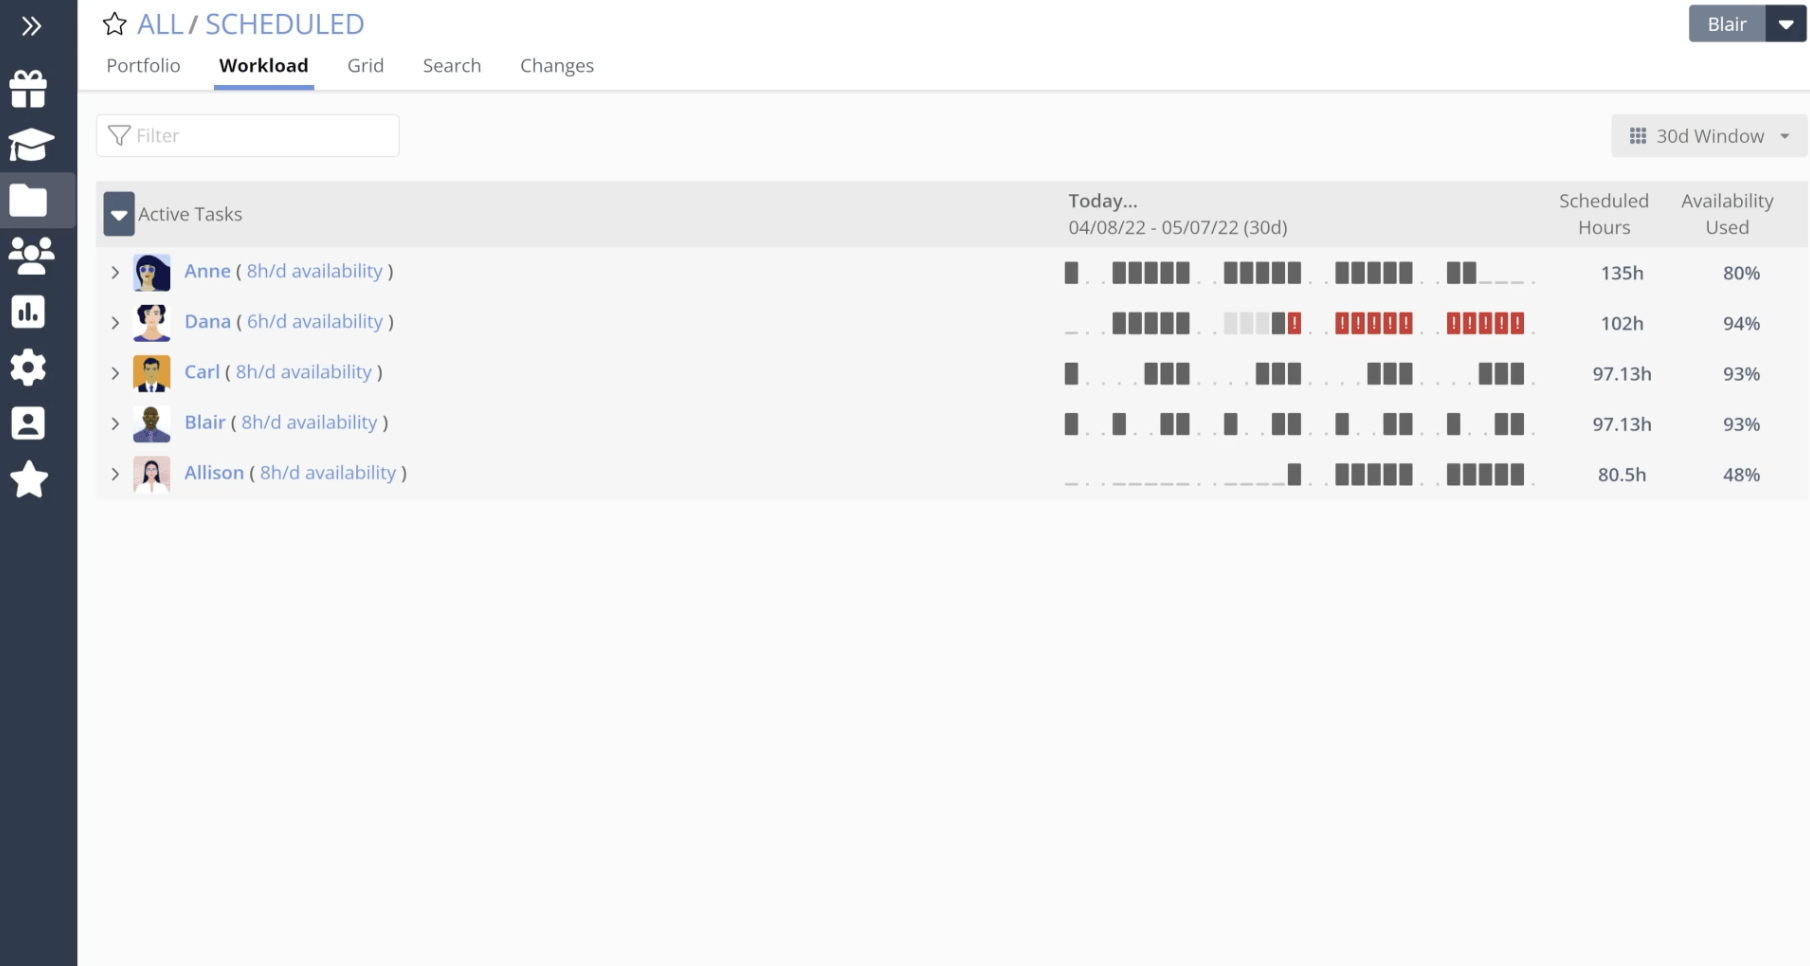
To fix it, click on any team member’s row to address the schedule risks or over-allocations. You’ll see which tasks are creating the schedule risk, and can choose to:
- assign the task to someone who can take it on sooner
- prioritize a task to move it earlier in their schedule, or
- adjust time estimates to reduce scope
Using “Schedule Risk” and “Workload” in tandem allows you to quickly identify which tasks are backing up a project, actively manage your team’s workload, resolve bottlenecks, and improve utilization across the portfolio, ensuring projects stay on track.
Core features
- Priority-driven project sorting keeps your whole team on the same page about where your focus should be
- Ranged estimates show best-case and worst-case scenario predictions to help manage unknowns
- Integrated time tracking lets you keep track of work being done and capture billable hours for billing and analysis
- Customizable dashboards give you real-time insights into the data you need
Pricing
Liquid Planner has three plans:
- Essentials: $15 per user per month
- Professional: $28 per user per month
- Ultimate: $42 per user per month
A 14-day free trial of the Ultimate plan is available.
7. ProofHub
ProofHub is project management and collaboration software that helps your team stay on the same page about project tasks, priorities, progress, and more.
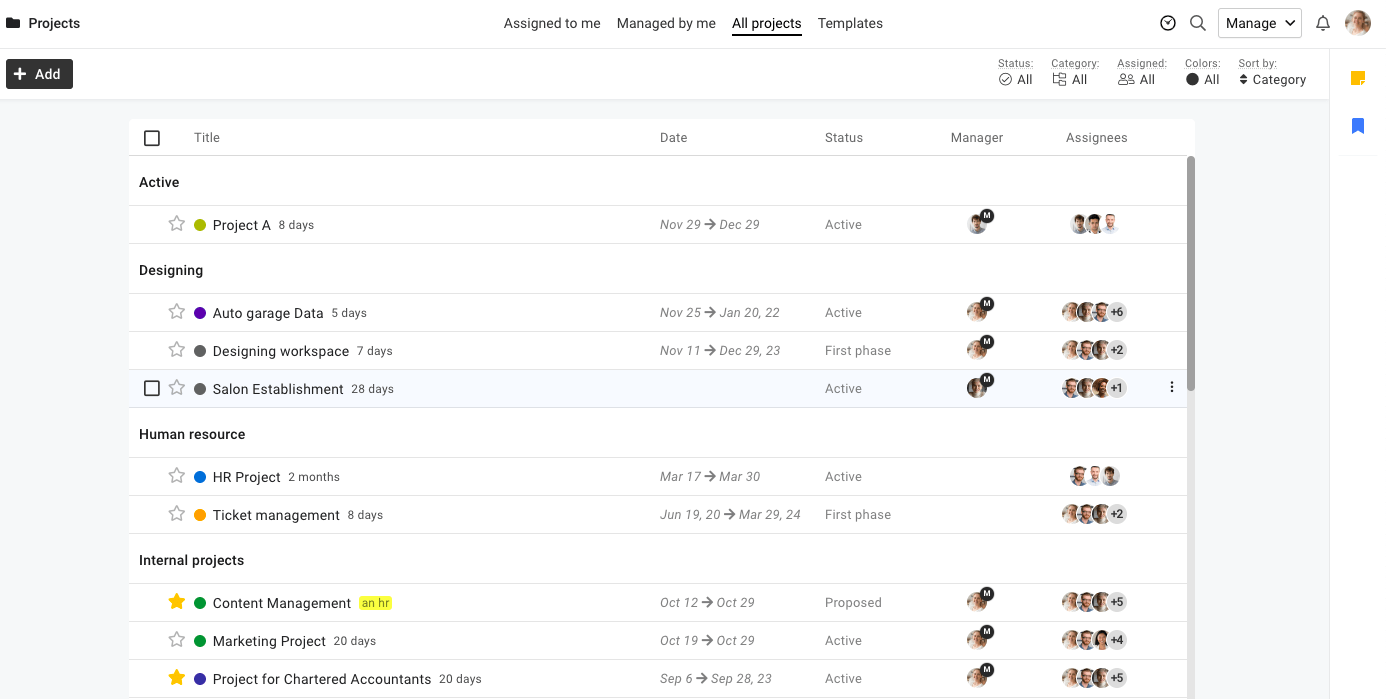
To see your entire portfolio at a glance, go to “Projects” and then click “All Projects.” You can add additional sorting options, such as projects assigned to you or managed by you, status, or category.
From here, you get a super high-level overview of the status and timeline of your projects, so you can see where everything stands.
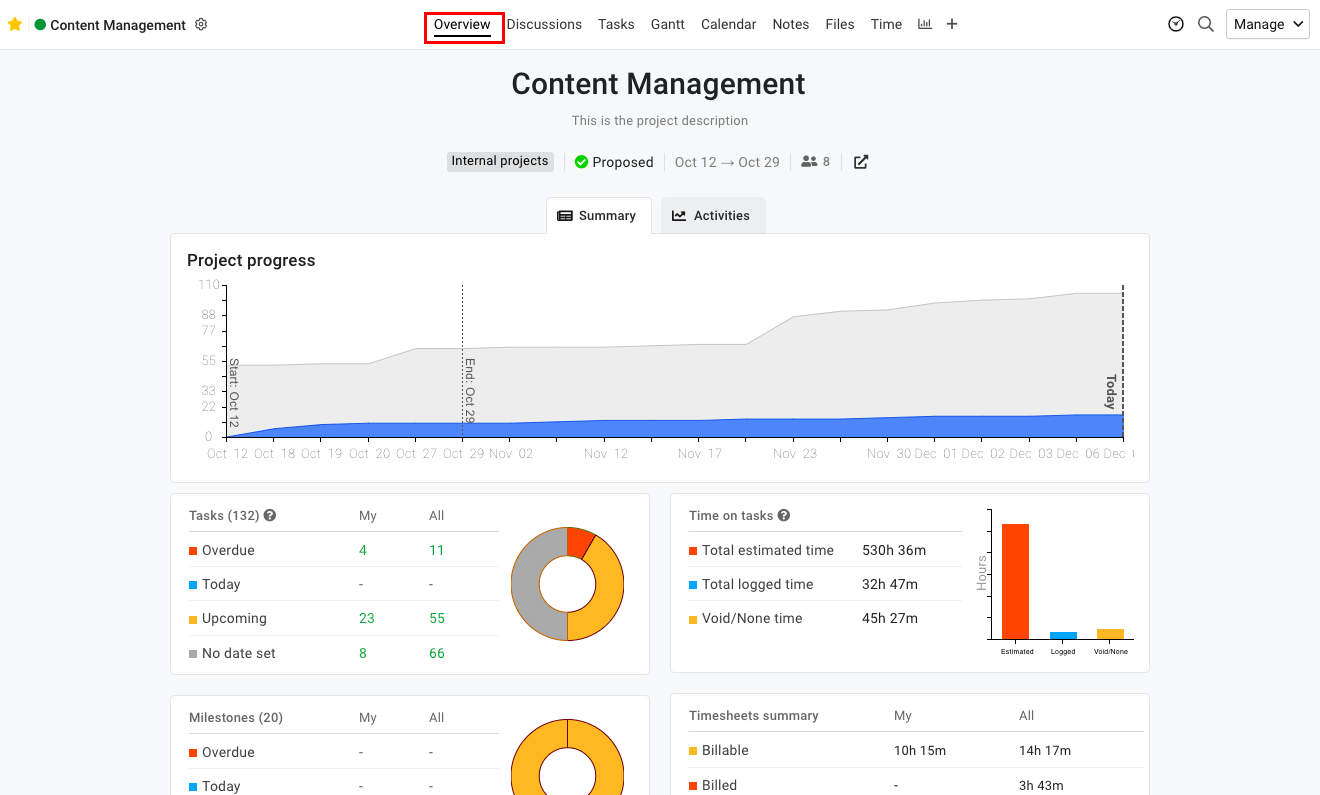
To drill down into project details, click on any project to go to the “Project Overview.”
Here, you’ll find metrics and data on project tasks, milestones, discussions, time logged, and overall progress.
Internal time tracking tools allow you to see estimated vs. actual time and the percentage of billable vs. non-billable time to help keep projects on track and profitable.
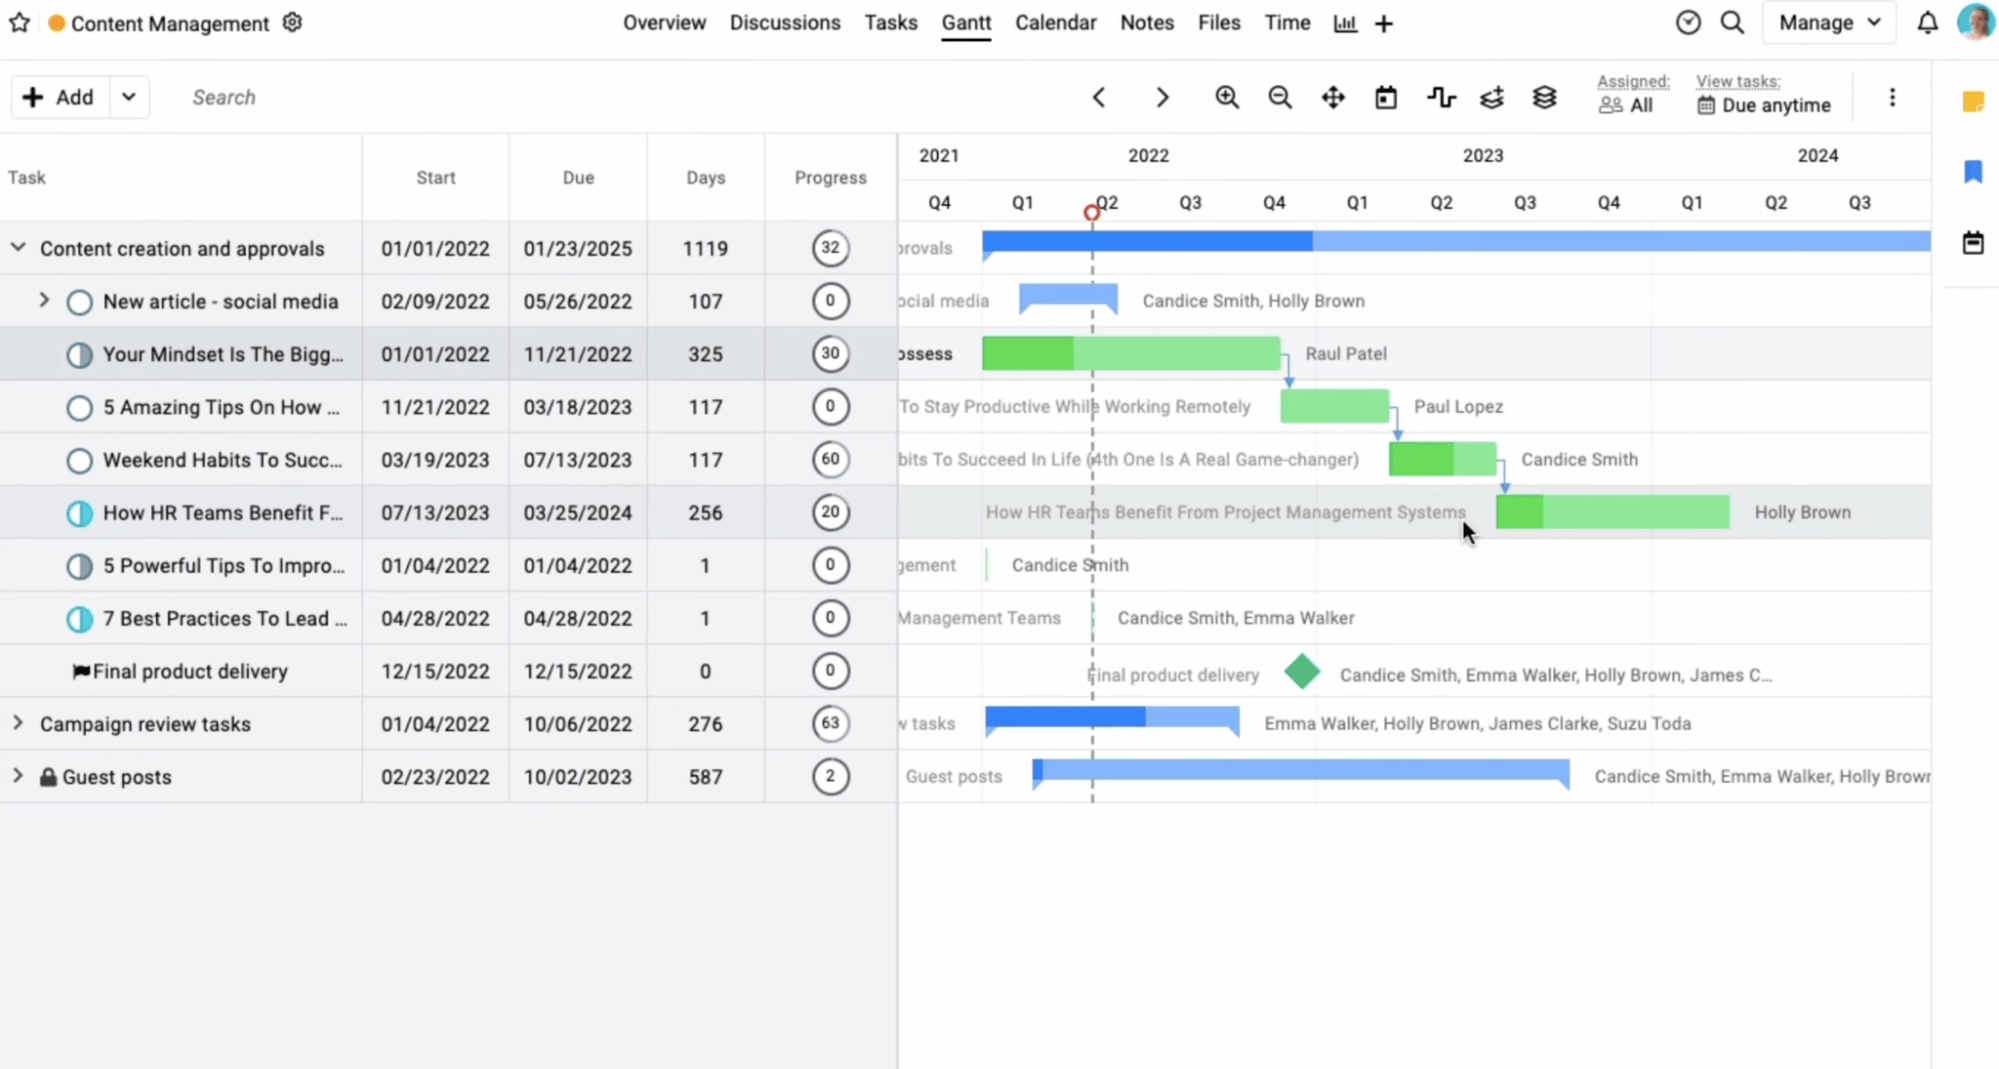
Once you’ve gotten a big-picture look at your project, keep track of deadlines and tasks with the “Gantt” views.
“Gantt” view gives project managers a granular look at everything coming up for this project and how it’s progressing.
From here, you can see all your project milestones and tasks on a timeline, the number of days assigned to the project phase, and the progress made so far.
With all these views working together, you can seamlessly stay on top of project management and reporting.
What you’ll love
When juggling many moving pieces of multiple client projects, ProofHub’s “Files” feature will help you keep everything in one place.
Under every project, you’ll see a “Files” tab, where you’ll find all the uploaded files associated with the project.
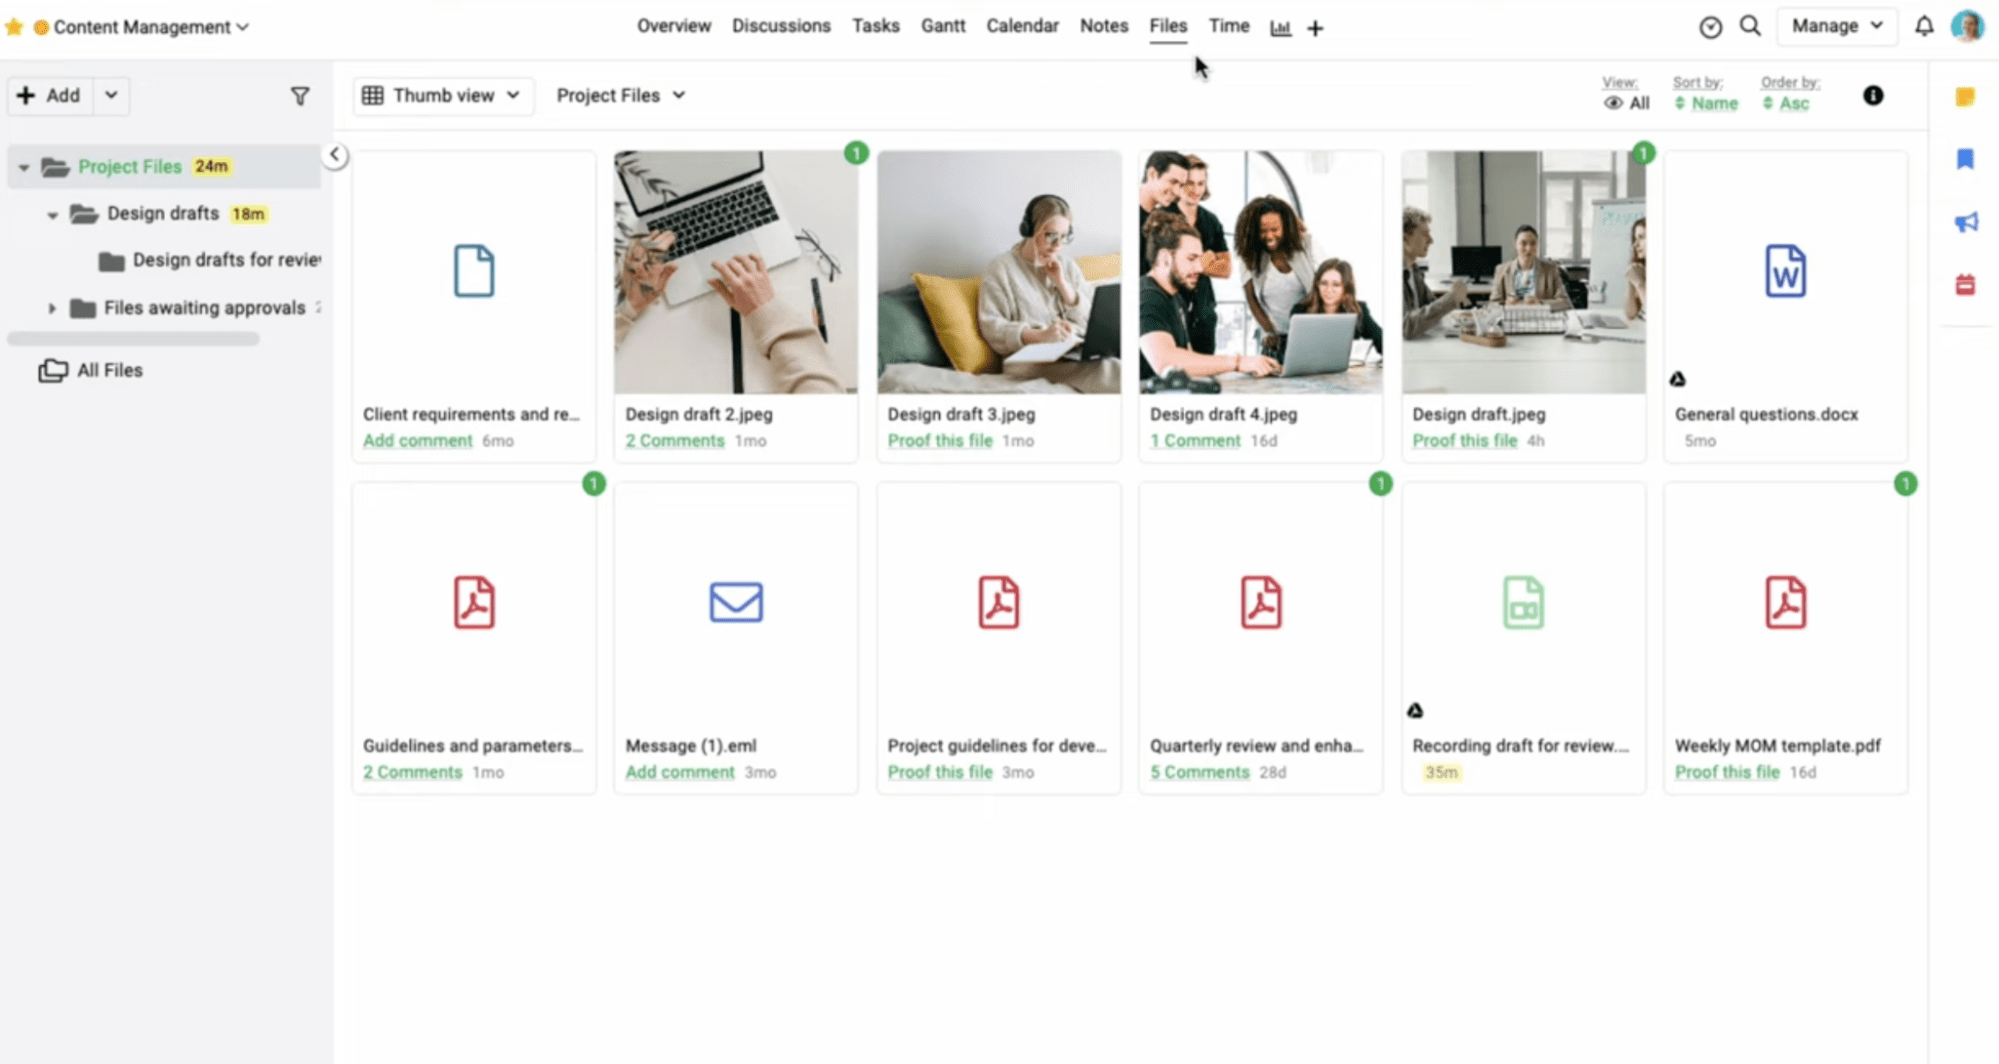
Once you upload a file, you can tag other team members or clients for notification and review.
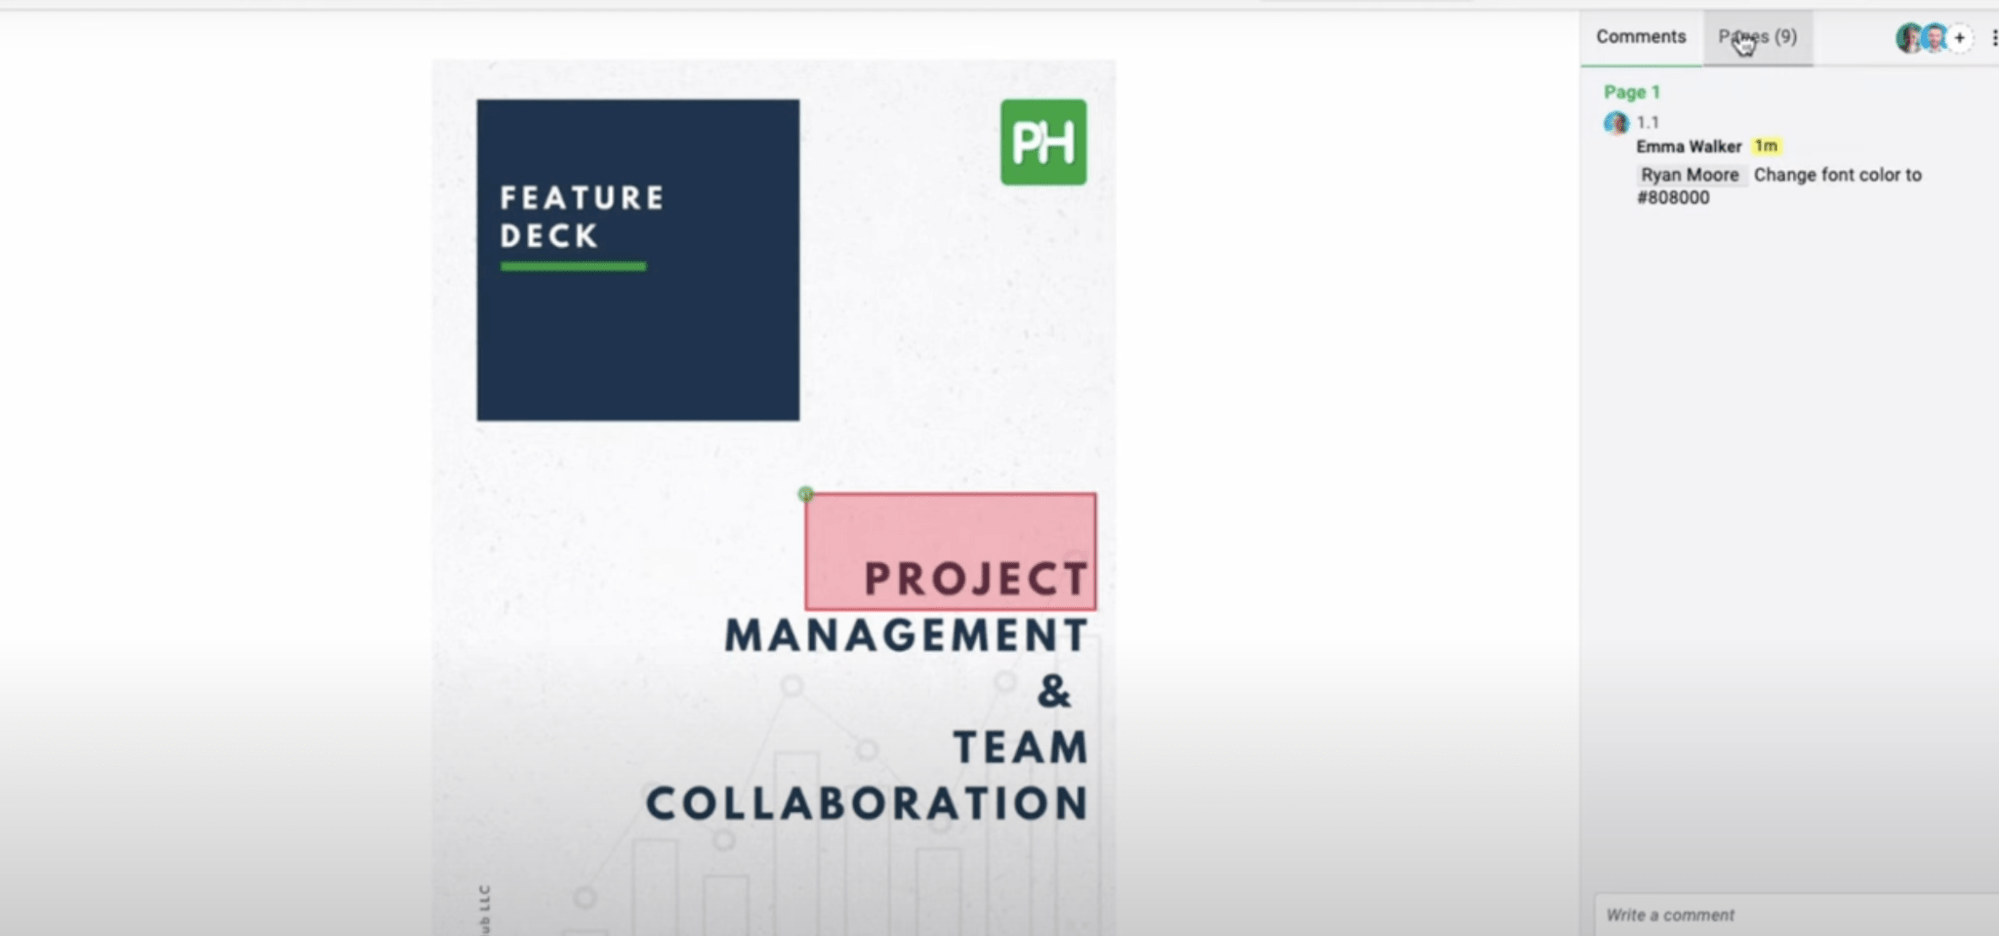
Click on a file to open the proofing hub. Here, you can view, annotate, and comment on files and images to get feedback and manage review processes directly within ProofHub.
This simplifies the process of getting client feedback and making iterations and updates accordingly.
In addition, keeping all your project files within your work management tool can increase visibility while also making it easier to track and organize files quickly and deliver quality work.
Core features
- Board, calendar, Gantt views and more help you stay on top of project tasks, milestones, and deadlines
- Time tracking shows you how the project is progressing in comparison to your estimates
- Custom templates and workflows let you easily manage and duplicate workflows, retainers, and project schedules
- Built-in files management allow you to organize and share files for each project, provide feedback, and keep everything in one place
Pricing
ProofHub has two plans:
- Essential: $45 per month for up to 40 projects and unlimited users
- Ultimate: $89 per month for unlimited projects and users
A 14-day free trial is available.
Which tool is right for your team?
Finding the right portfolio management tool isn’t always easy.
Project managers must focus on juggling multiple client projects, tasks, deadlines, and milestones while managing resources effectively and keeping projects profitable.
For an end-to-end solution designed for agencies and professional services, try Scoro. Scoro has everything project managers need to increase visibility and collaboration, manage resources, and improve project profitability.
Start your free trial of Scoro today.