


Project Management KPI Dashboard
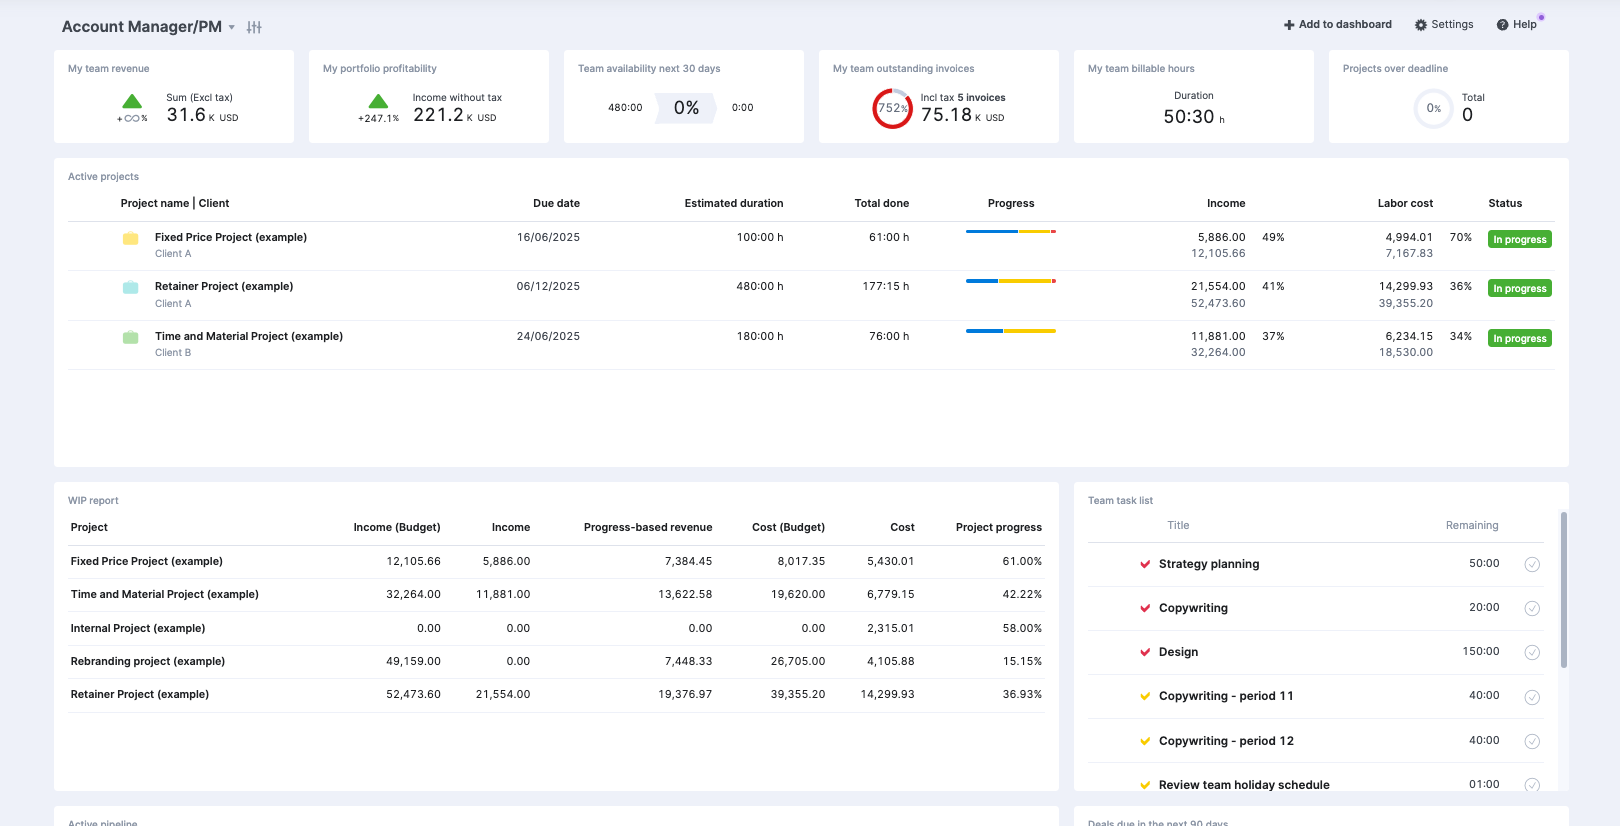
Scoro’s project management KPI dashboard is a powerful tool that provides real-time visibility into project progress, budgets, and resource allocation. This dashboard is designed to help project managers make data-driven decisions to keep their projects on track and profitable.
Project managers can easily monitor and analyze key project data in one centralized location with customizable widgets, result metrics, ratio metrics, and interactive charts.
Project management KPI dashboard features
The project KPI dashboard is ideal for tracking a selection of your site’s most important data in one place.
Its features of include:
- Customizable Widgets: Display essential project data like active projects, overdue tasks, and project costs using widgets tailored to your needs
- Result Metrics: Track key numeric data such as project budgets, billable hours, and task completion rates to stay on top of project performance
- Ratio Metrics: Calculate the ratio between two important results, such as planned vs. actual hours, to identify potential issues and optimize resource allocation
- Interactive Charts: Visualize project data using charts to spot trends and communicate progress to stakeholders effectively
- Multiple Dashboards: Create separate dashboards for different projects, teams, or departments to ensure everyone has access to the information they need
Editing the project KPI dashboard
The project manager KPI dashboard is a default dashboard in Scoro. But, if you do want to modify it, follow the steps below.
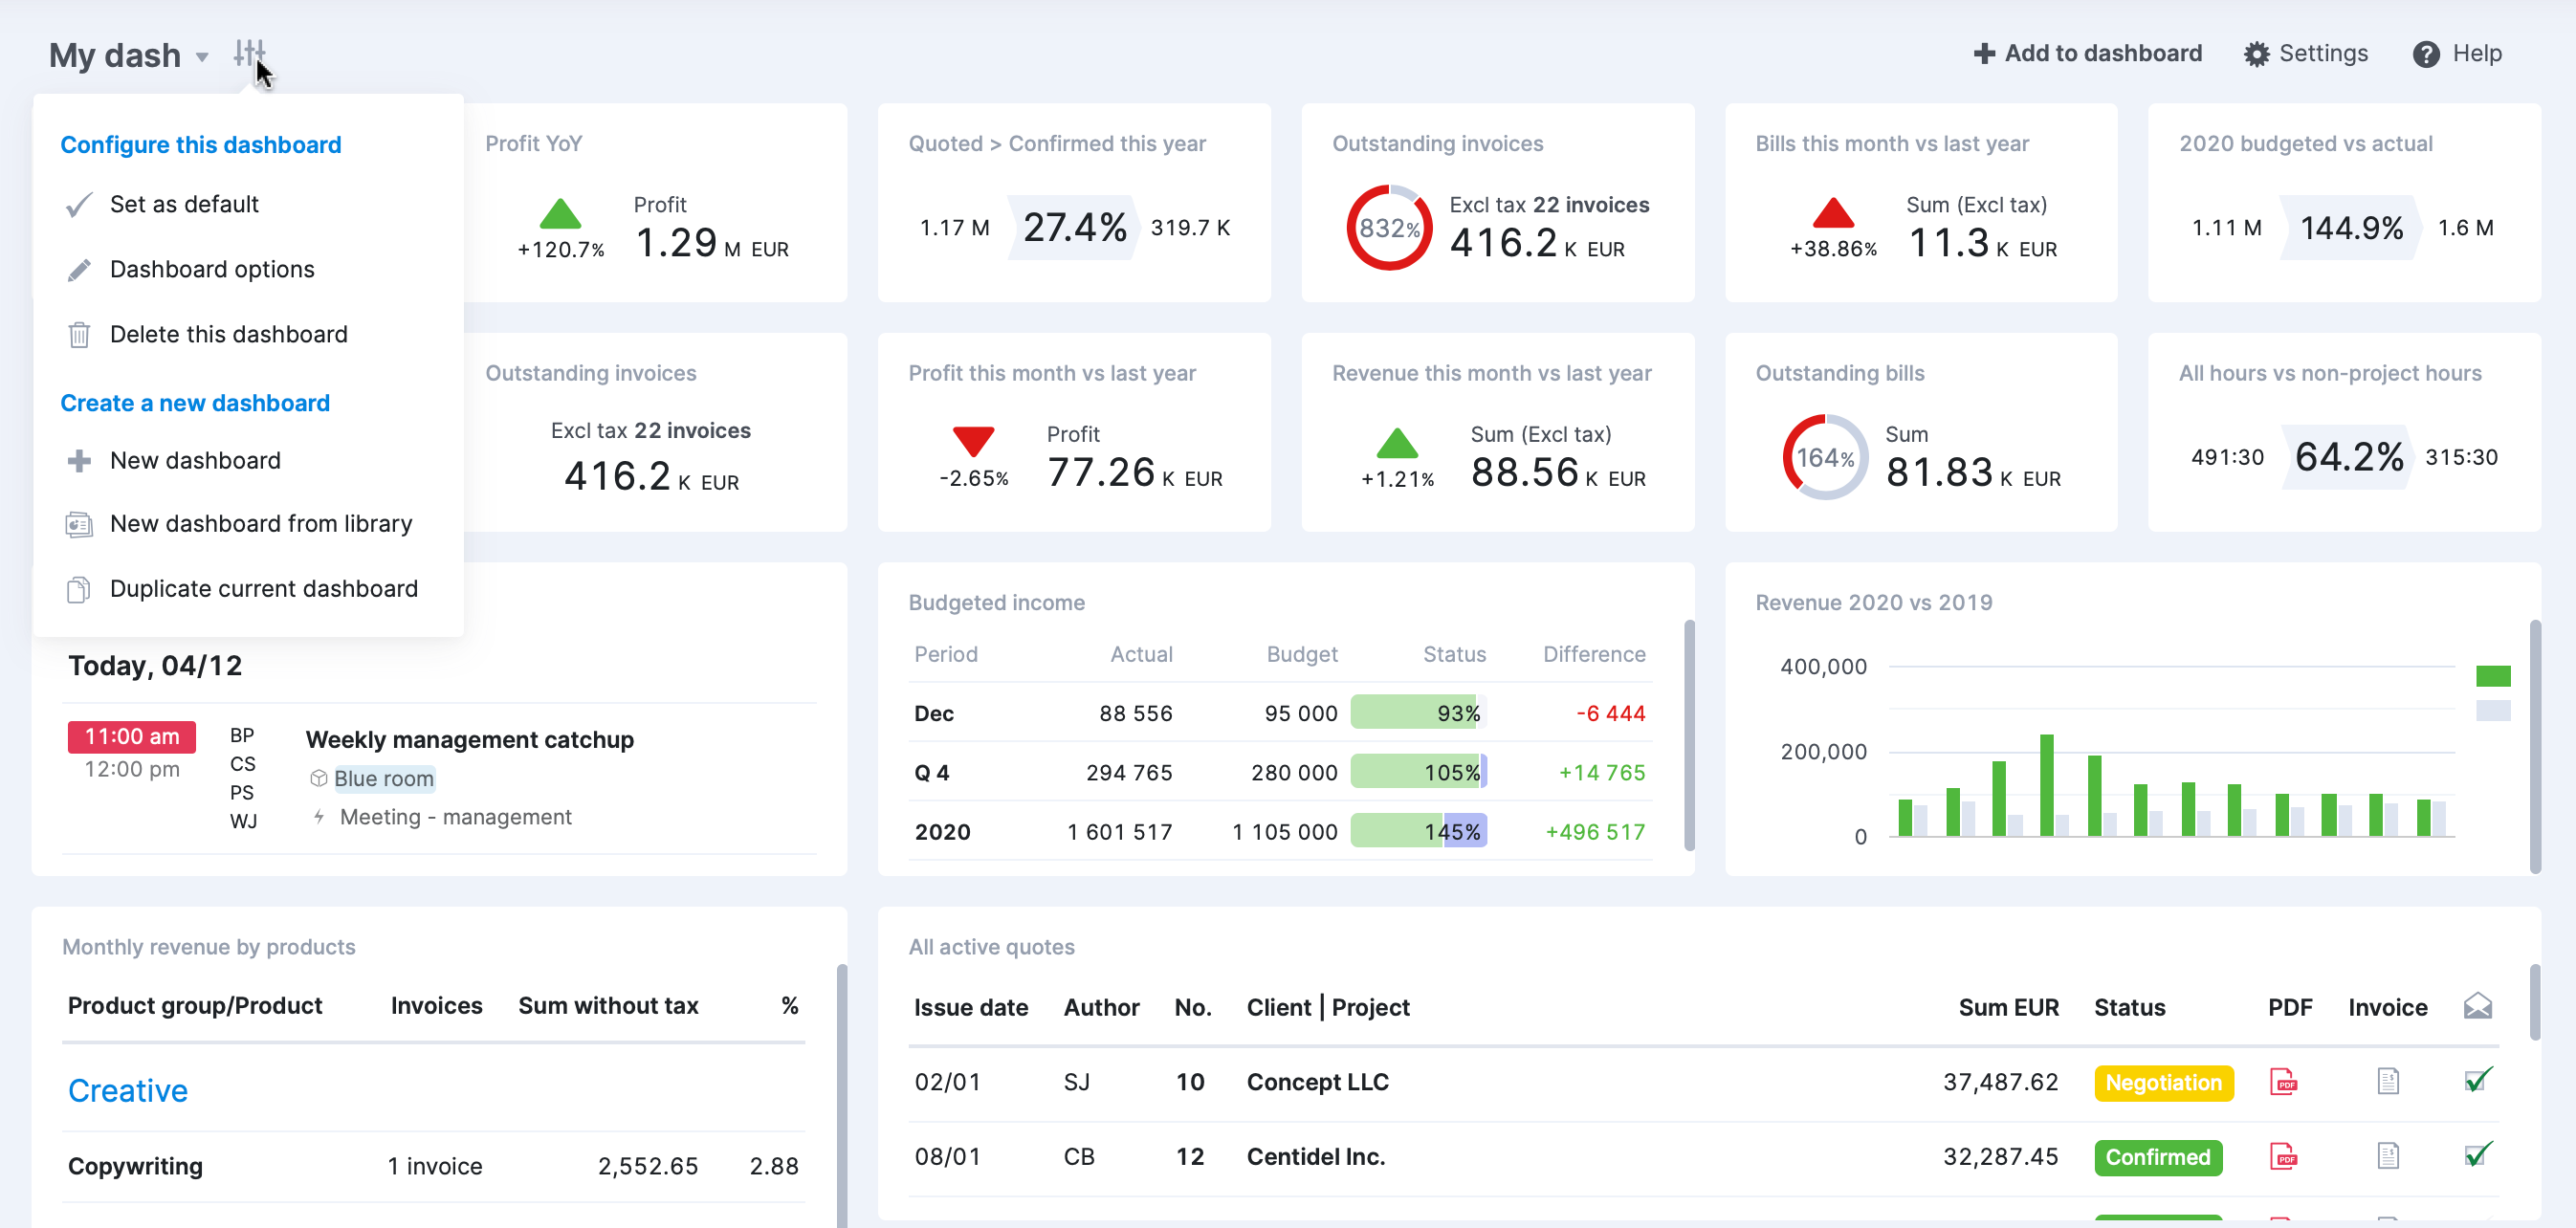
Configure your dashboard
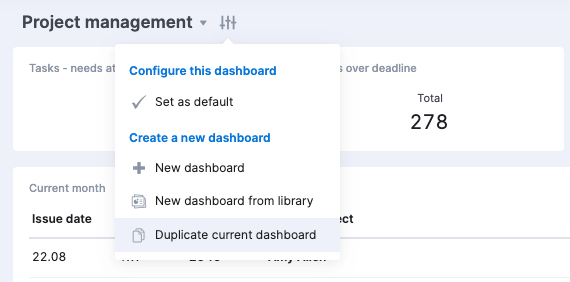
Click the “Configure” button on your existing dashboard. Choose “New dashboard” to create a dashboard from scratch or “New dashboard from library” to select a pre-built template.
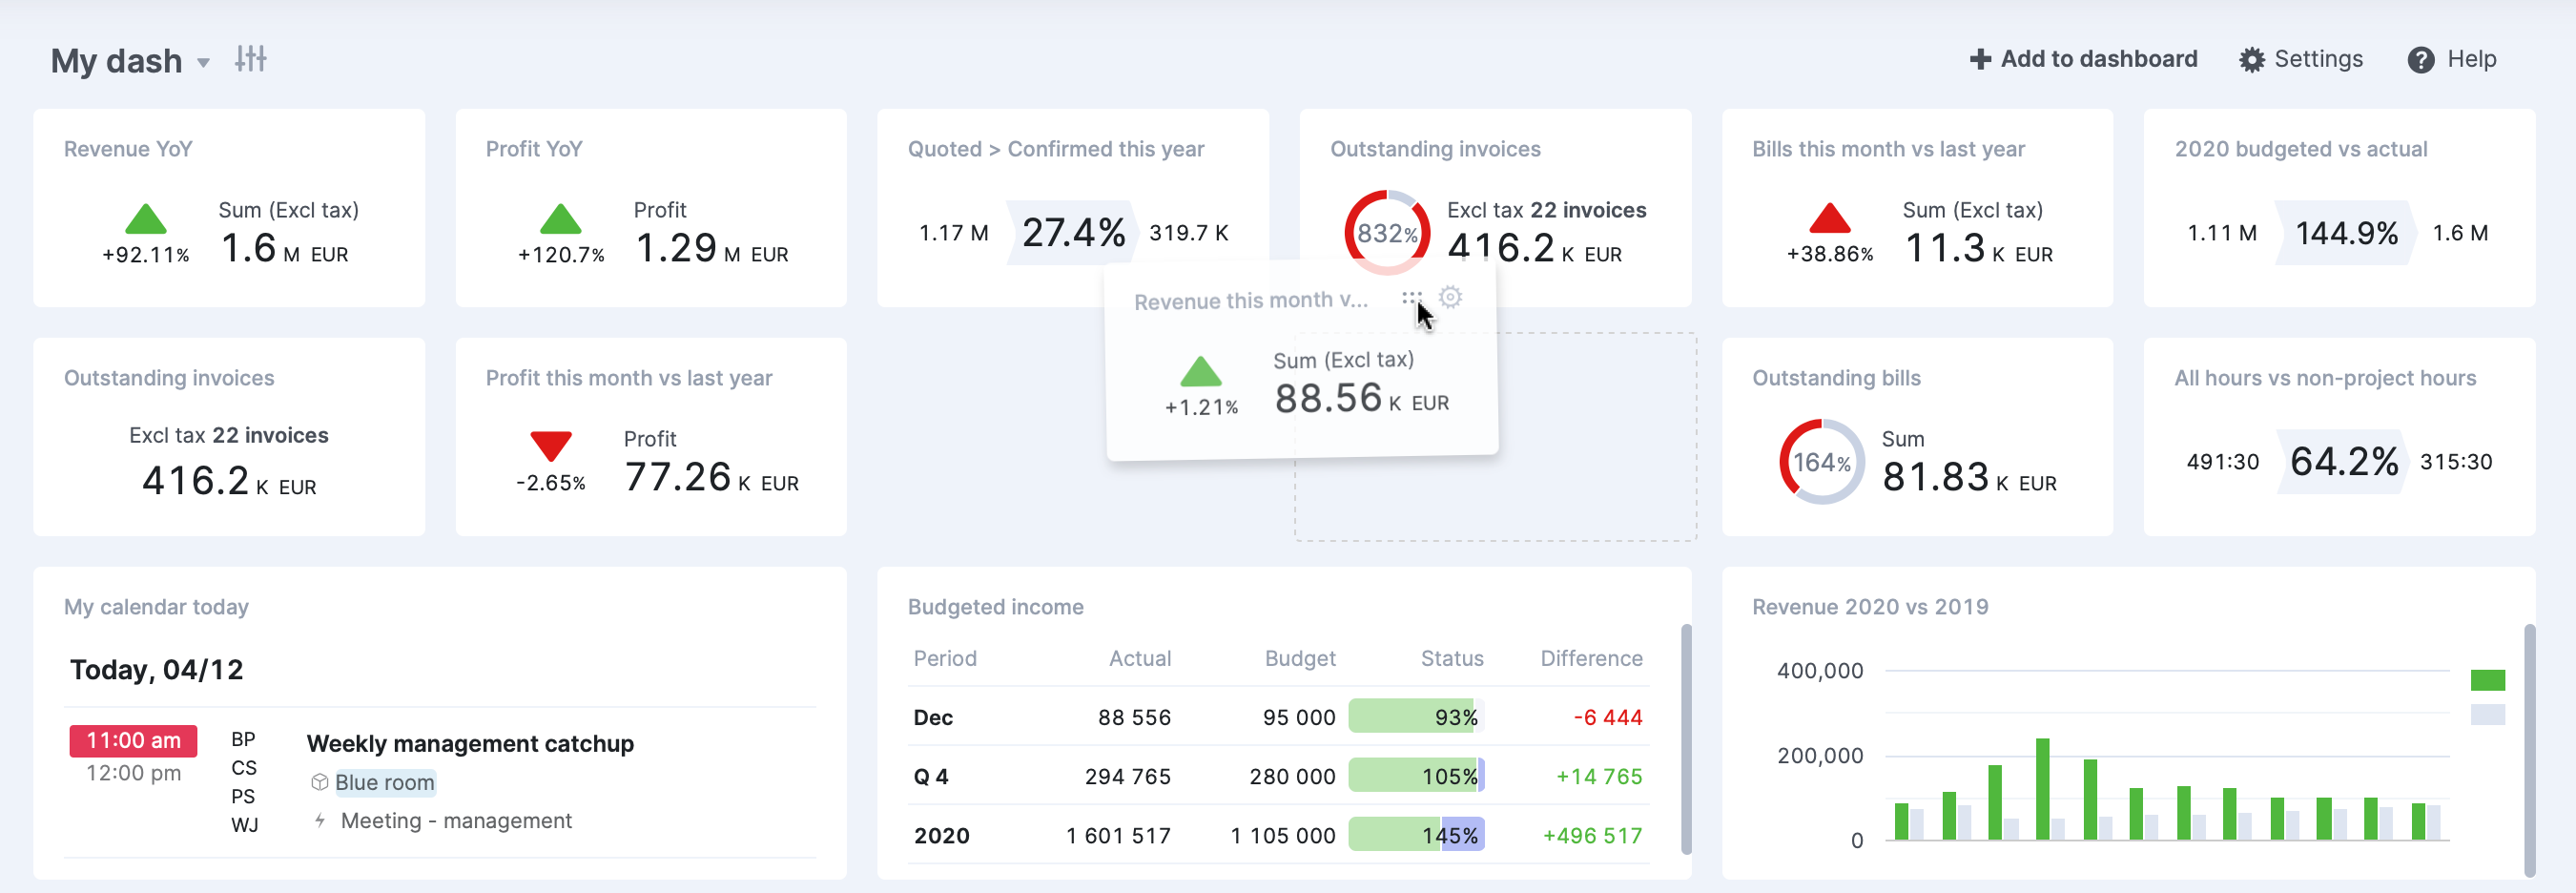
Add dashlets
Click the “Add to dashboard” button to add new dashlets. Select from options like result metrics, ratio metrics, or charts. Choose data sources and set filters to display relevant project data.
Drag and drop dashlets to rearrange them on the dashboard, and then resize dashlets by dragging from the lower right corner to create the optimal layout for your needs,
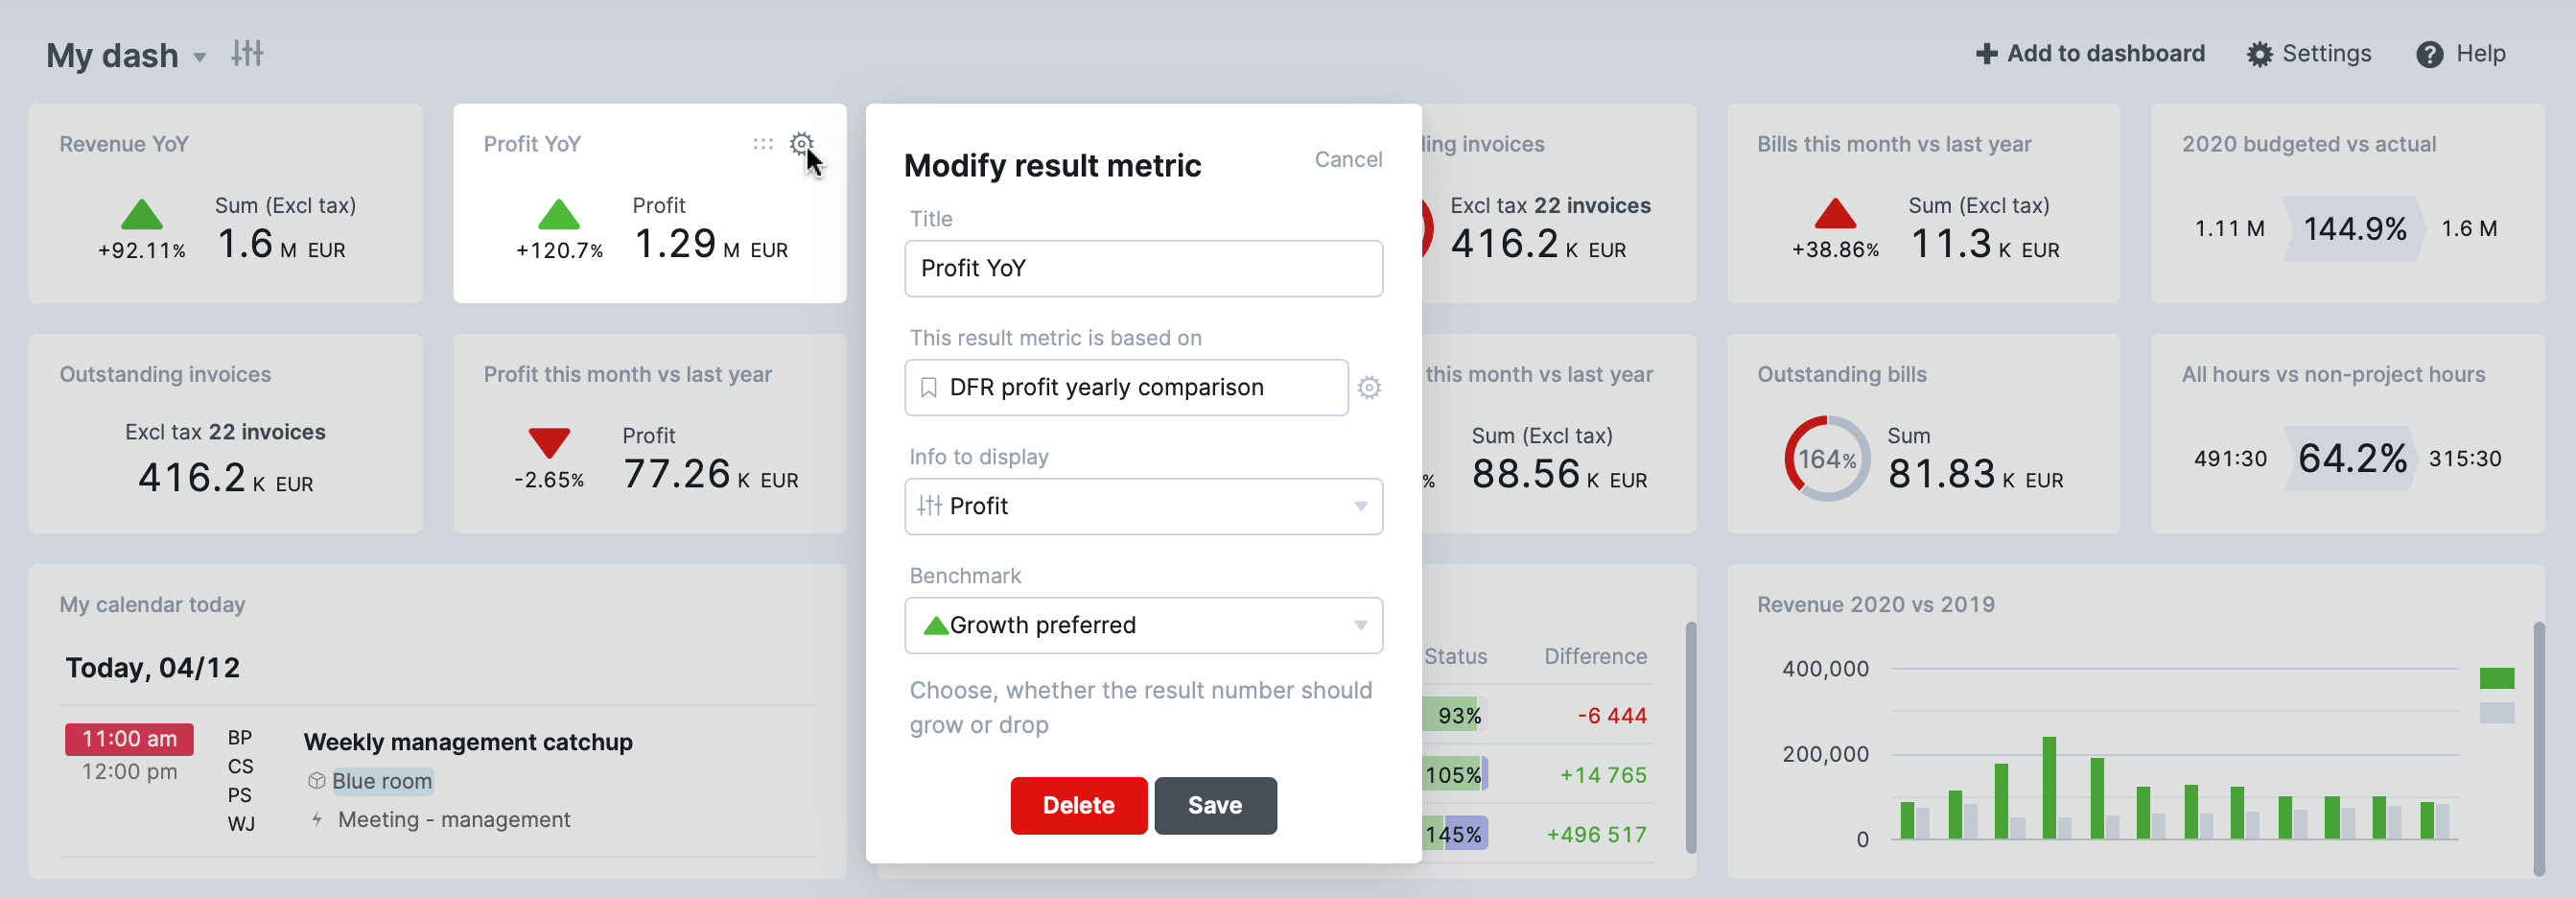
Customize your dashlets
Click the settings icon on each dashlet to customize it. Set filters to focus on specific projects, tasks, or team members. Choose the information to display, such as project budgets, billable hours, or task completion rates.
Creating a new KPI dashboard
If you’re starting with a fresh, empty dashboard, the first step is to add some dashlets. Click the “Add to dashboard” button to get started.
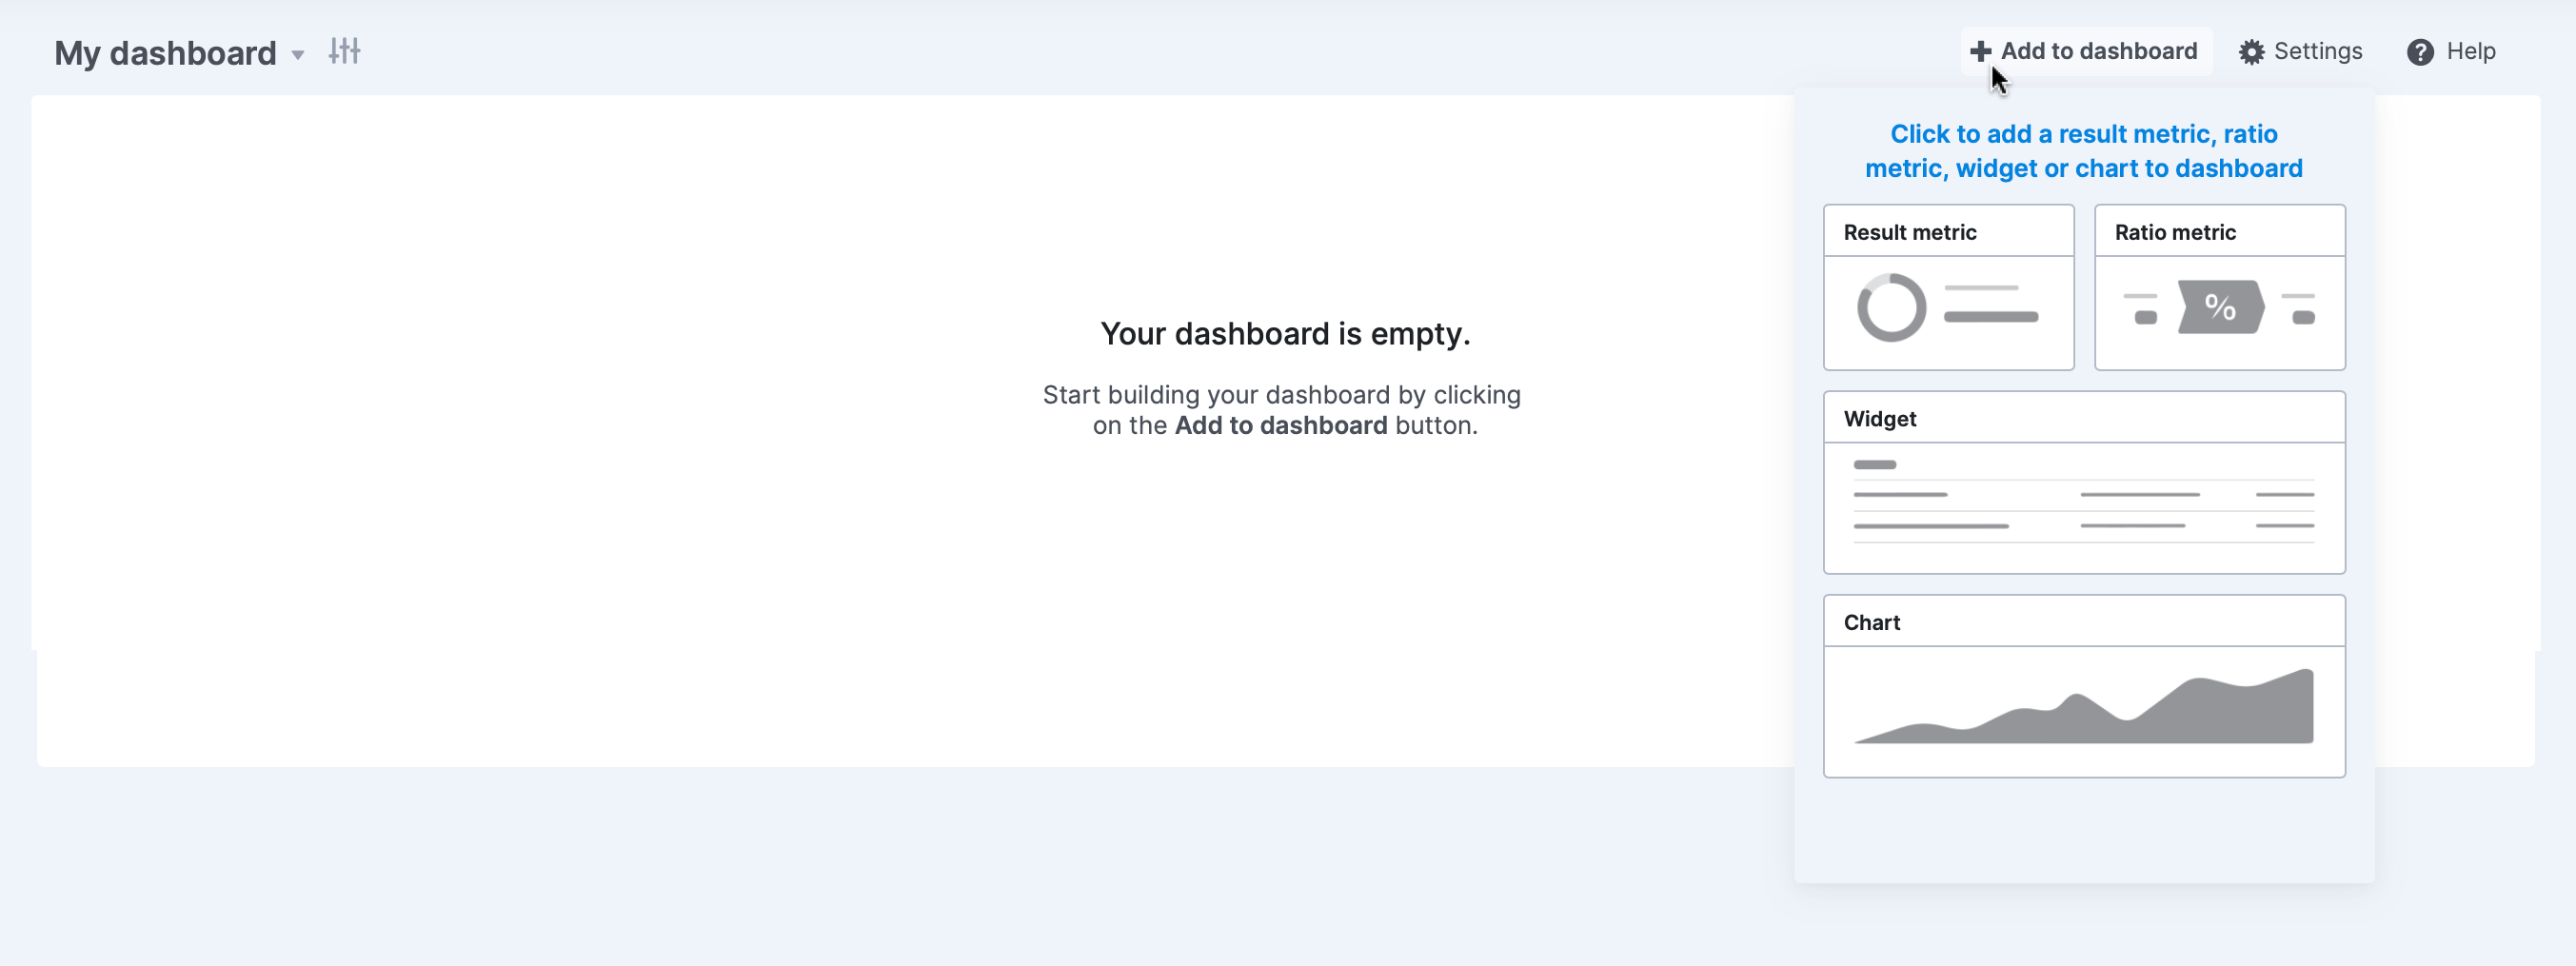
Please note that if the “Add to dashboard” button is not visible, it could be due to one of two reasons:
- You’ve already added the maximum number of dashlets allowed (36)
- Another user owns the dashboard
If you want to add a new metric to a dashboard owned by someone else, you’ll need to create a duplicate of the current dashboard. This way, you’ll own the duplicate dashboard and can add new dashlets to it.
Click the desired option to add a new dashlet, such as “Result metric.”
You’ll be presented with several choices:
- Browse bookmarks library: Select from a collection of pre-made bookmarks
- Choose from a bookmark: Pick an existing bookmark from your Scoro site
- Create a new result metric: Build a custom metric from the ground up
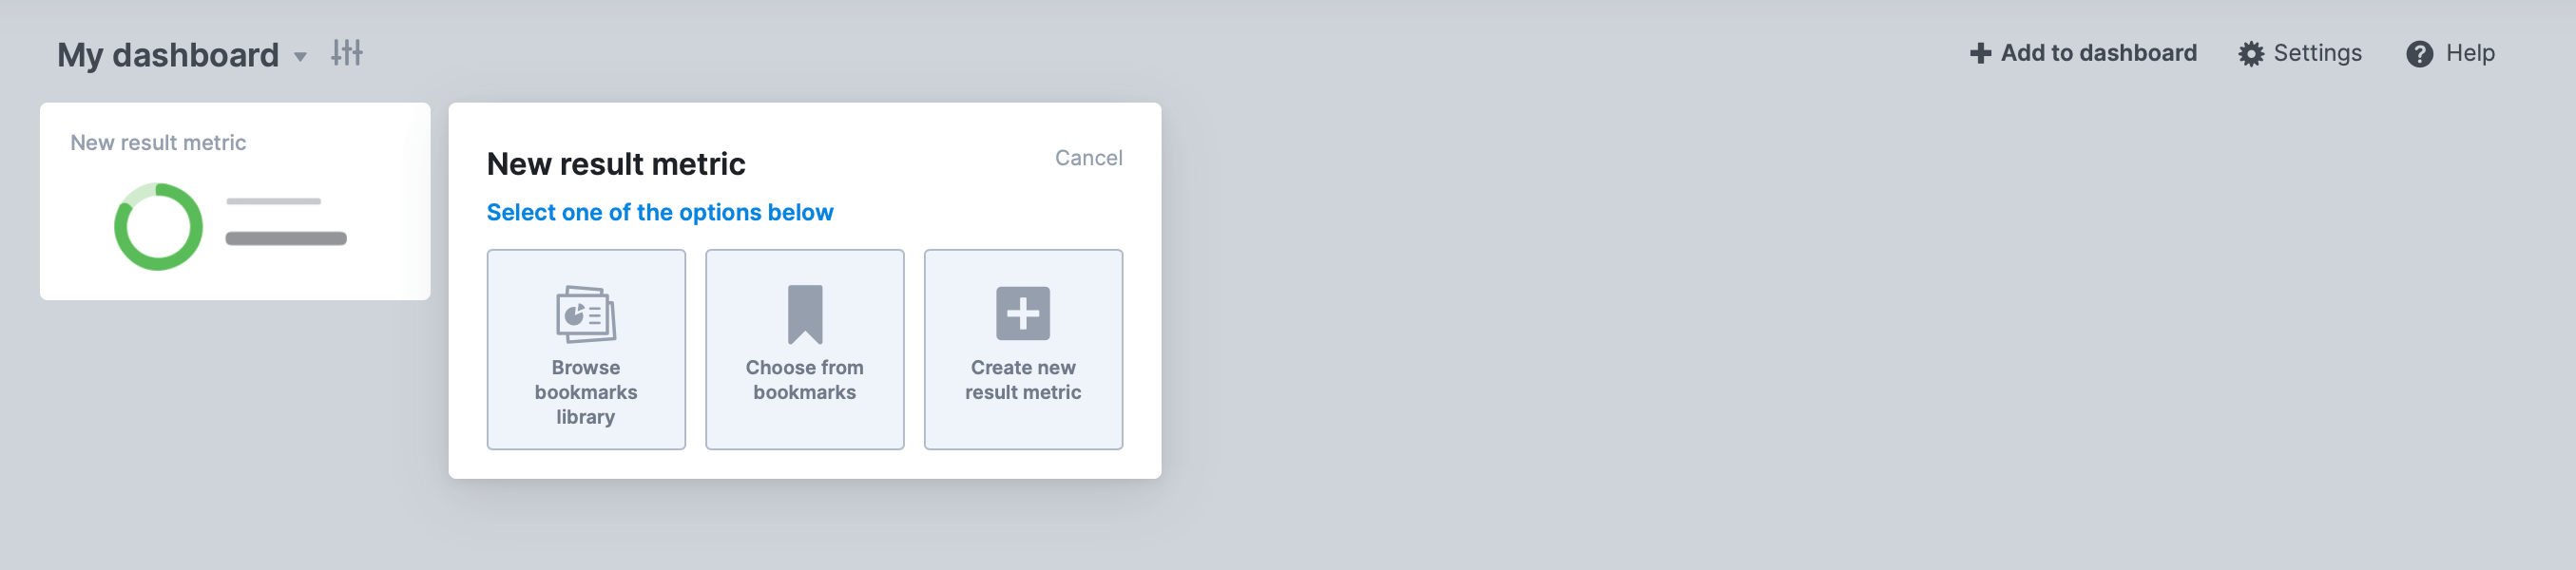
For this example, let’s choose “Create new result metric.”
Select a “source” for your metric (e.g., Invoices) and apply the appropriate “filters” to narrow down the results to the specific data you need.
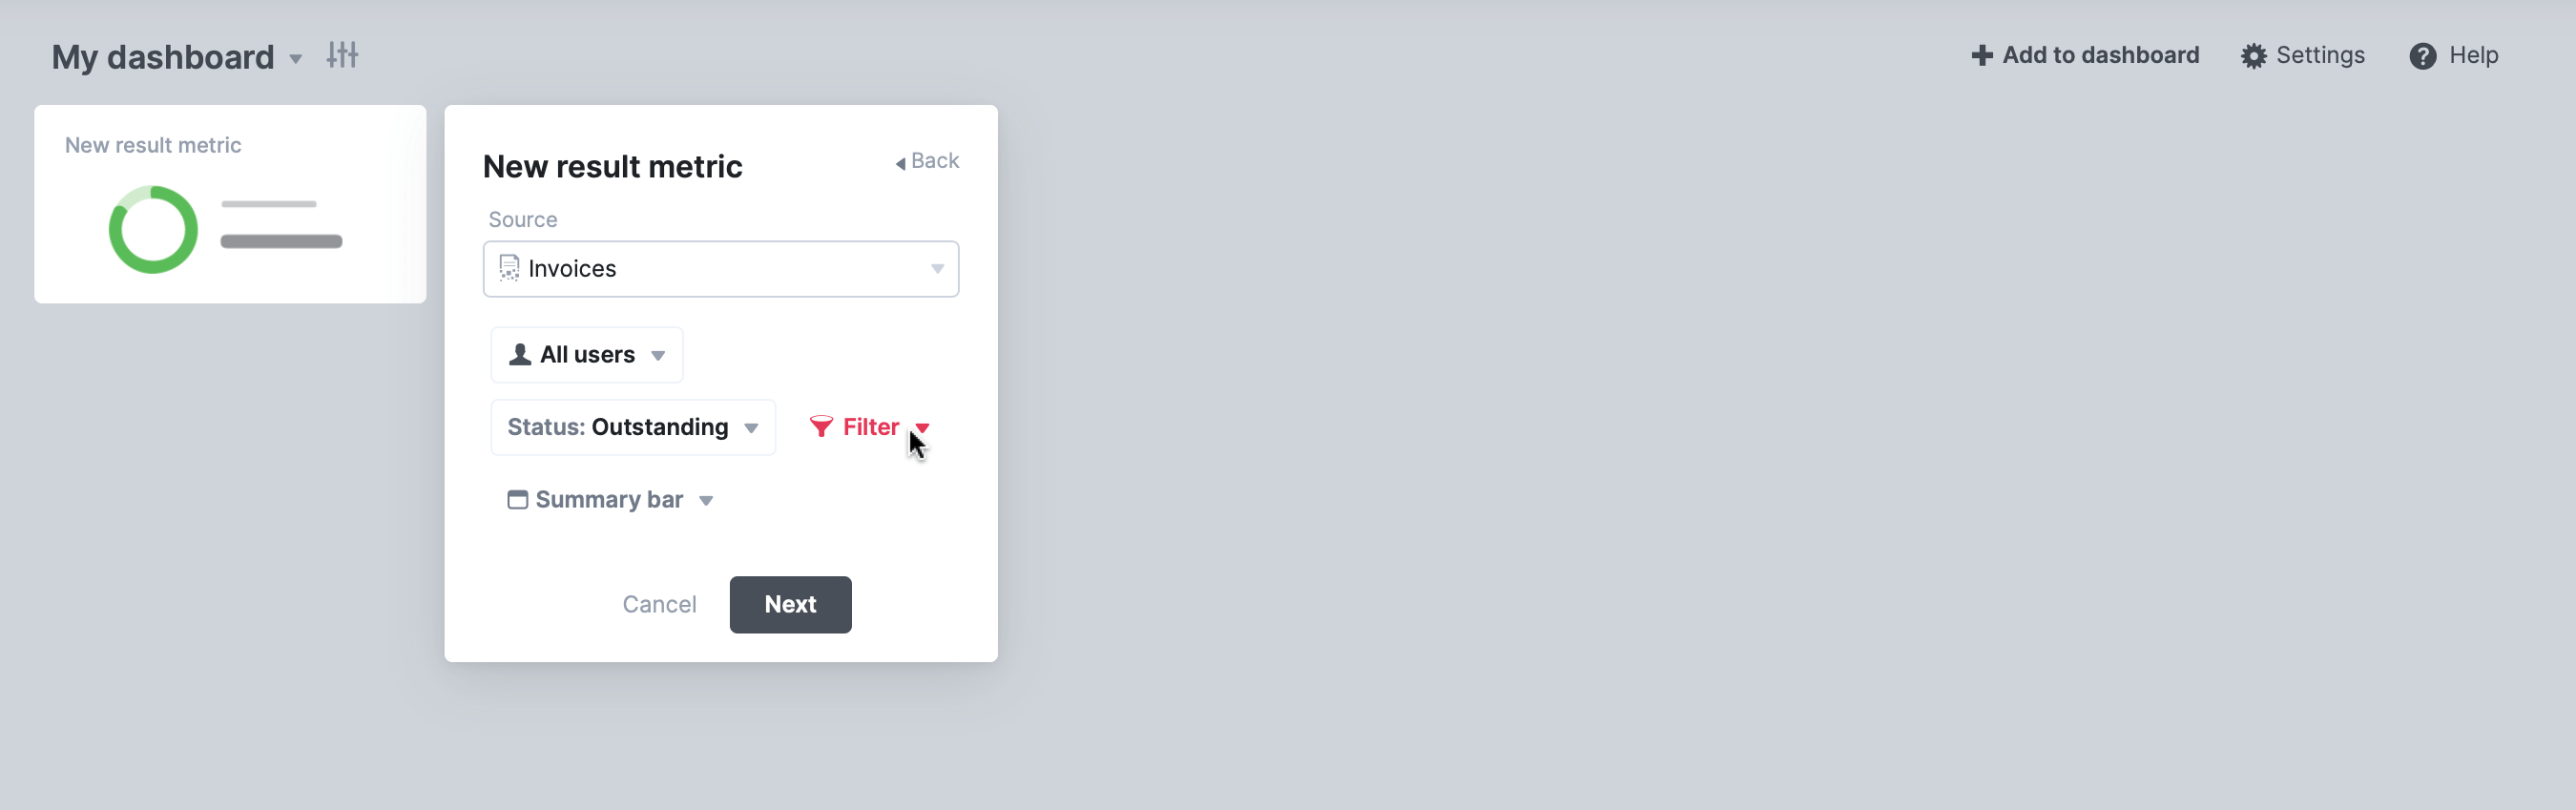
Click “Next.”
Enter a “title” for your bookmark and specify the “Info to display.”
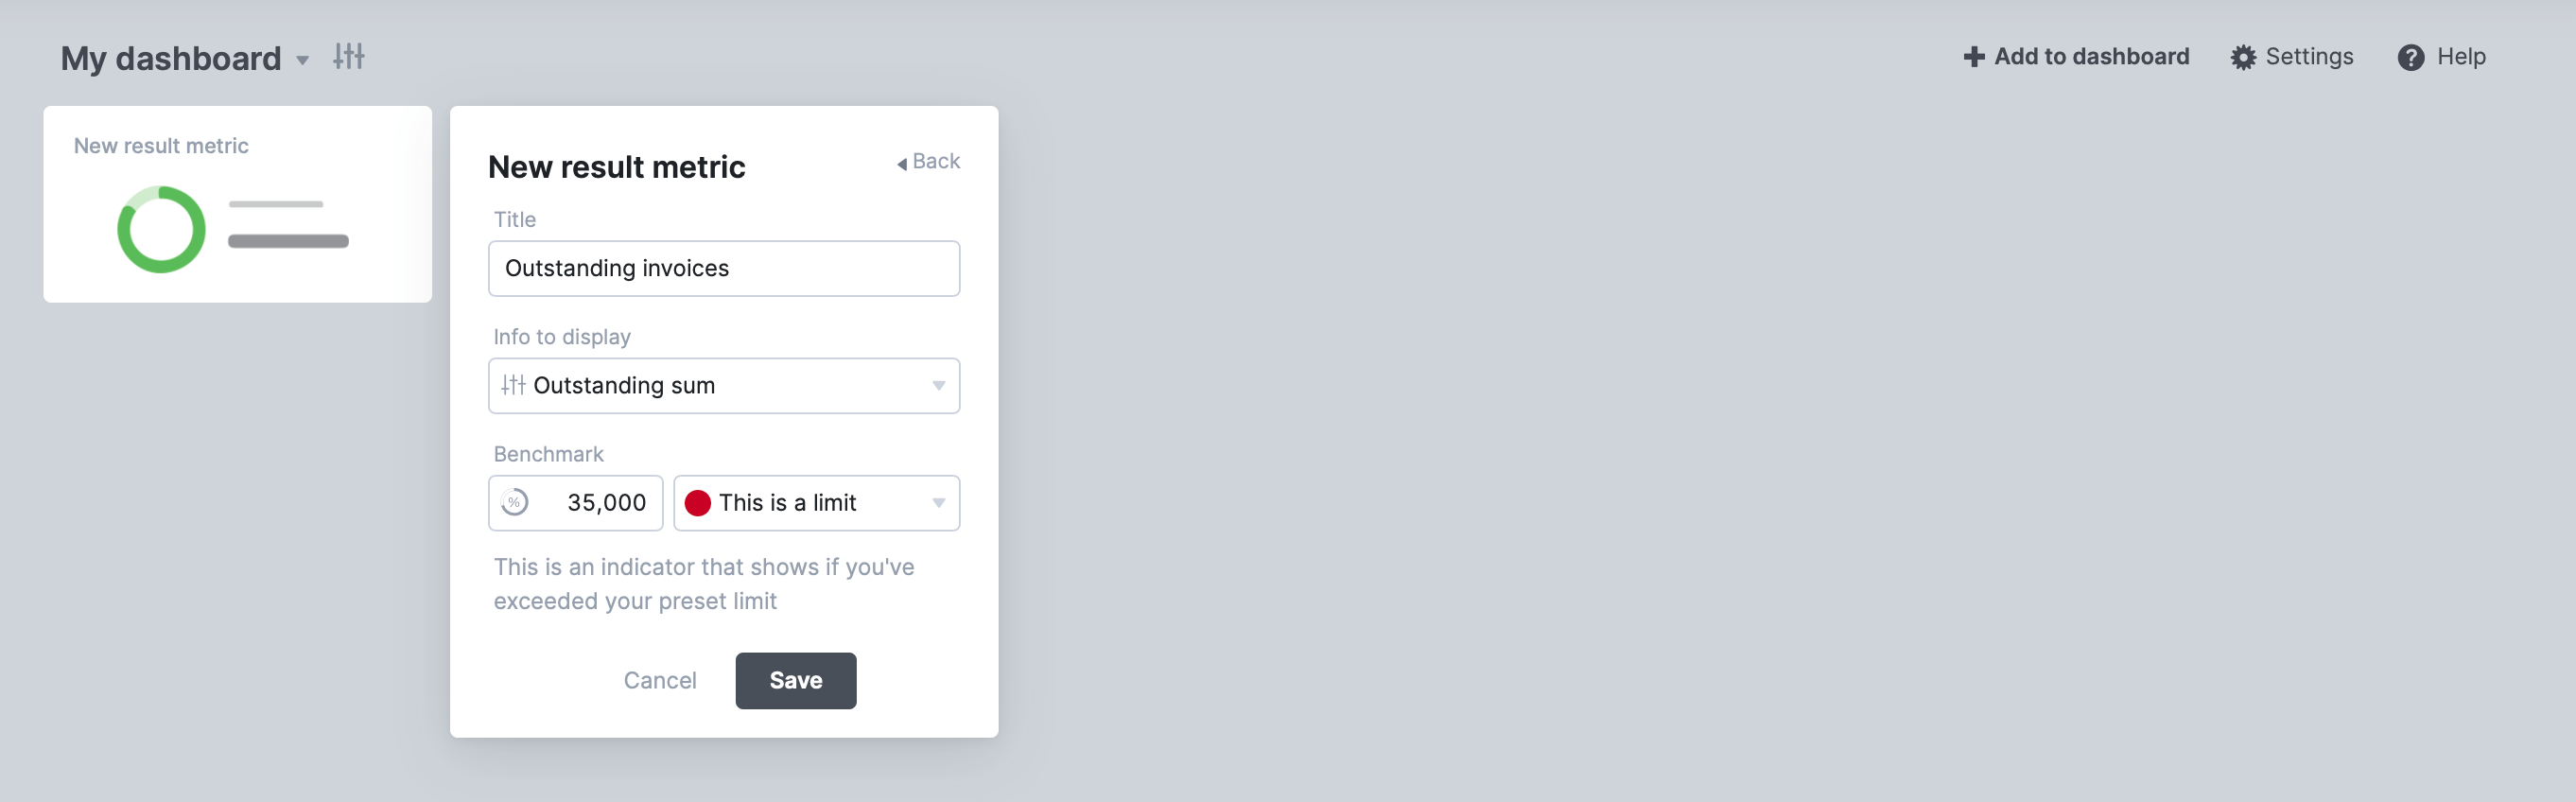
Crucially, set a “benchmark” for your metric by adding a “goal” or a “limit” and a benchmark value that your result will be measured against. This lets you see at a glance whether you’re achieving your goals or staying within your limits right from your dashboard. Click “Save.”
You can always go back and modify any of the dashlets on your dashboard if needed. Just click on the Settings icon on the dashlet.
![]()