

SPI Research has proven that there’s a 7.7x difference in profitability between the most and least mature professional services firms.
But nobody’s explained why that divide happens—until now.
We surveyed 303 firms across the United Kingdom, United States, Australia, Canada, and beyond to find out.
Their answers reveal where most firms are getting stuck. And what the top performers are doing differently.
How We Assessed Operational Maturity for 303 Firms
Respondents answered 25 questions in our business maturity quiz about five different operational pillars:
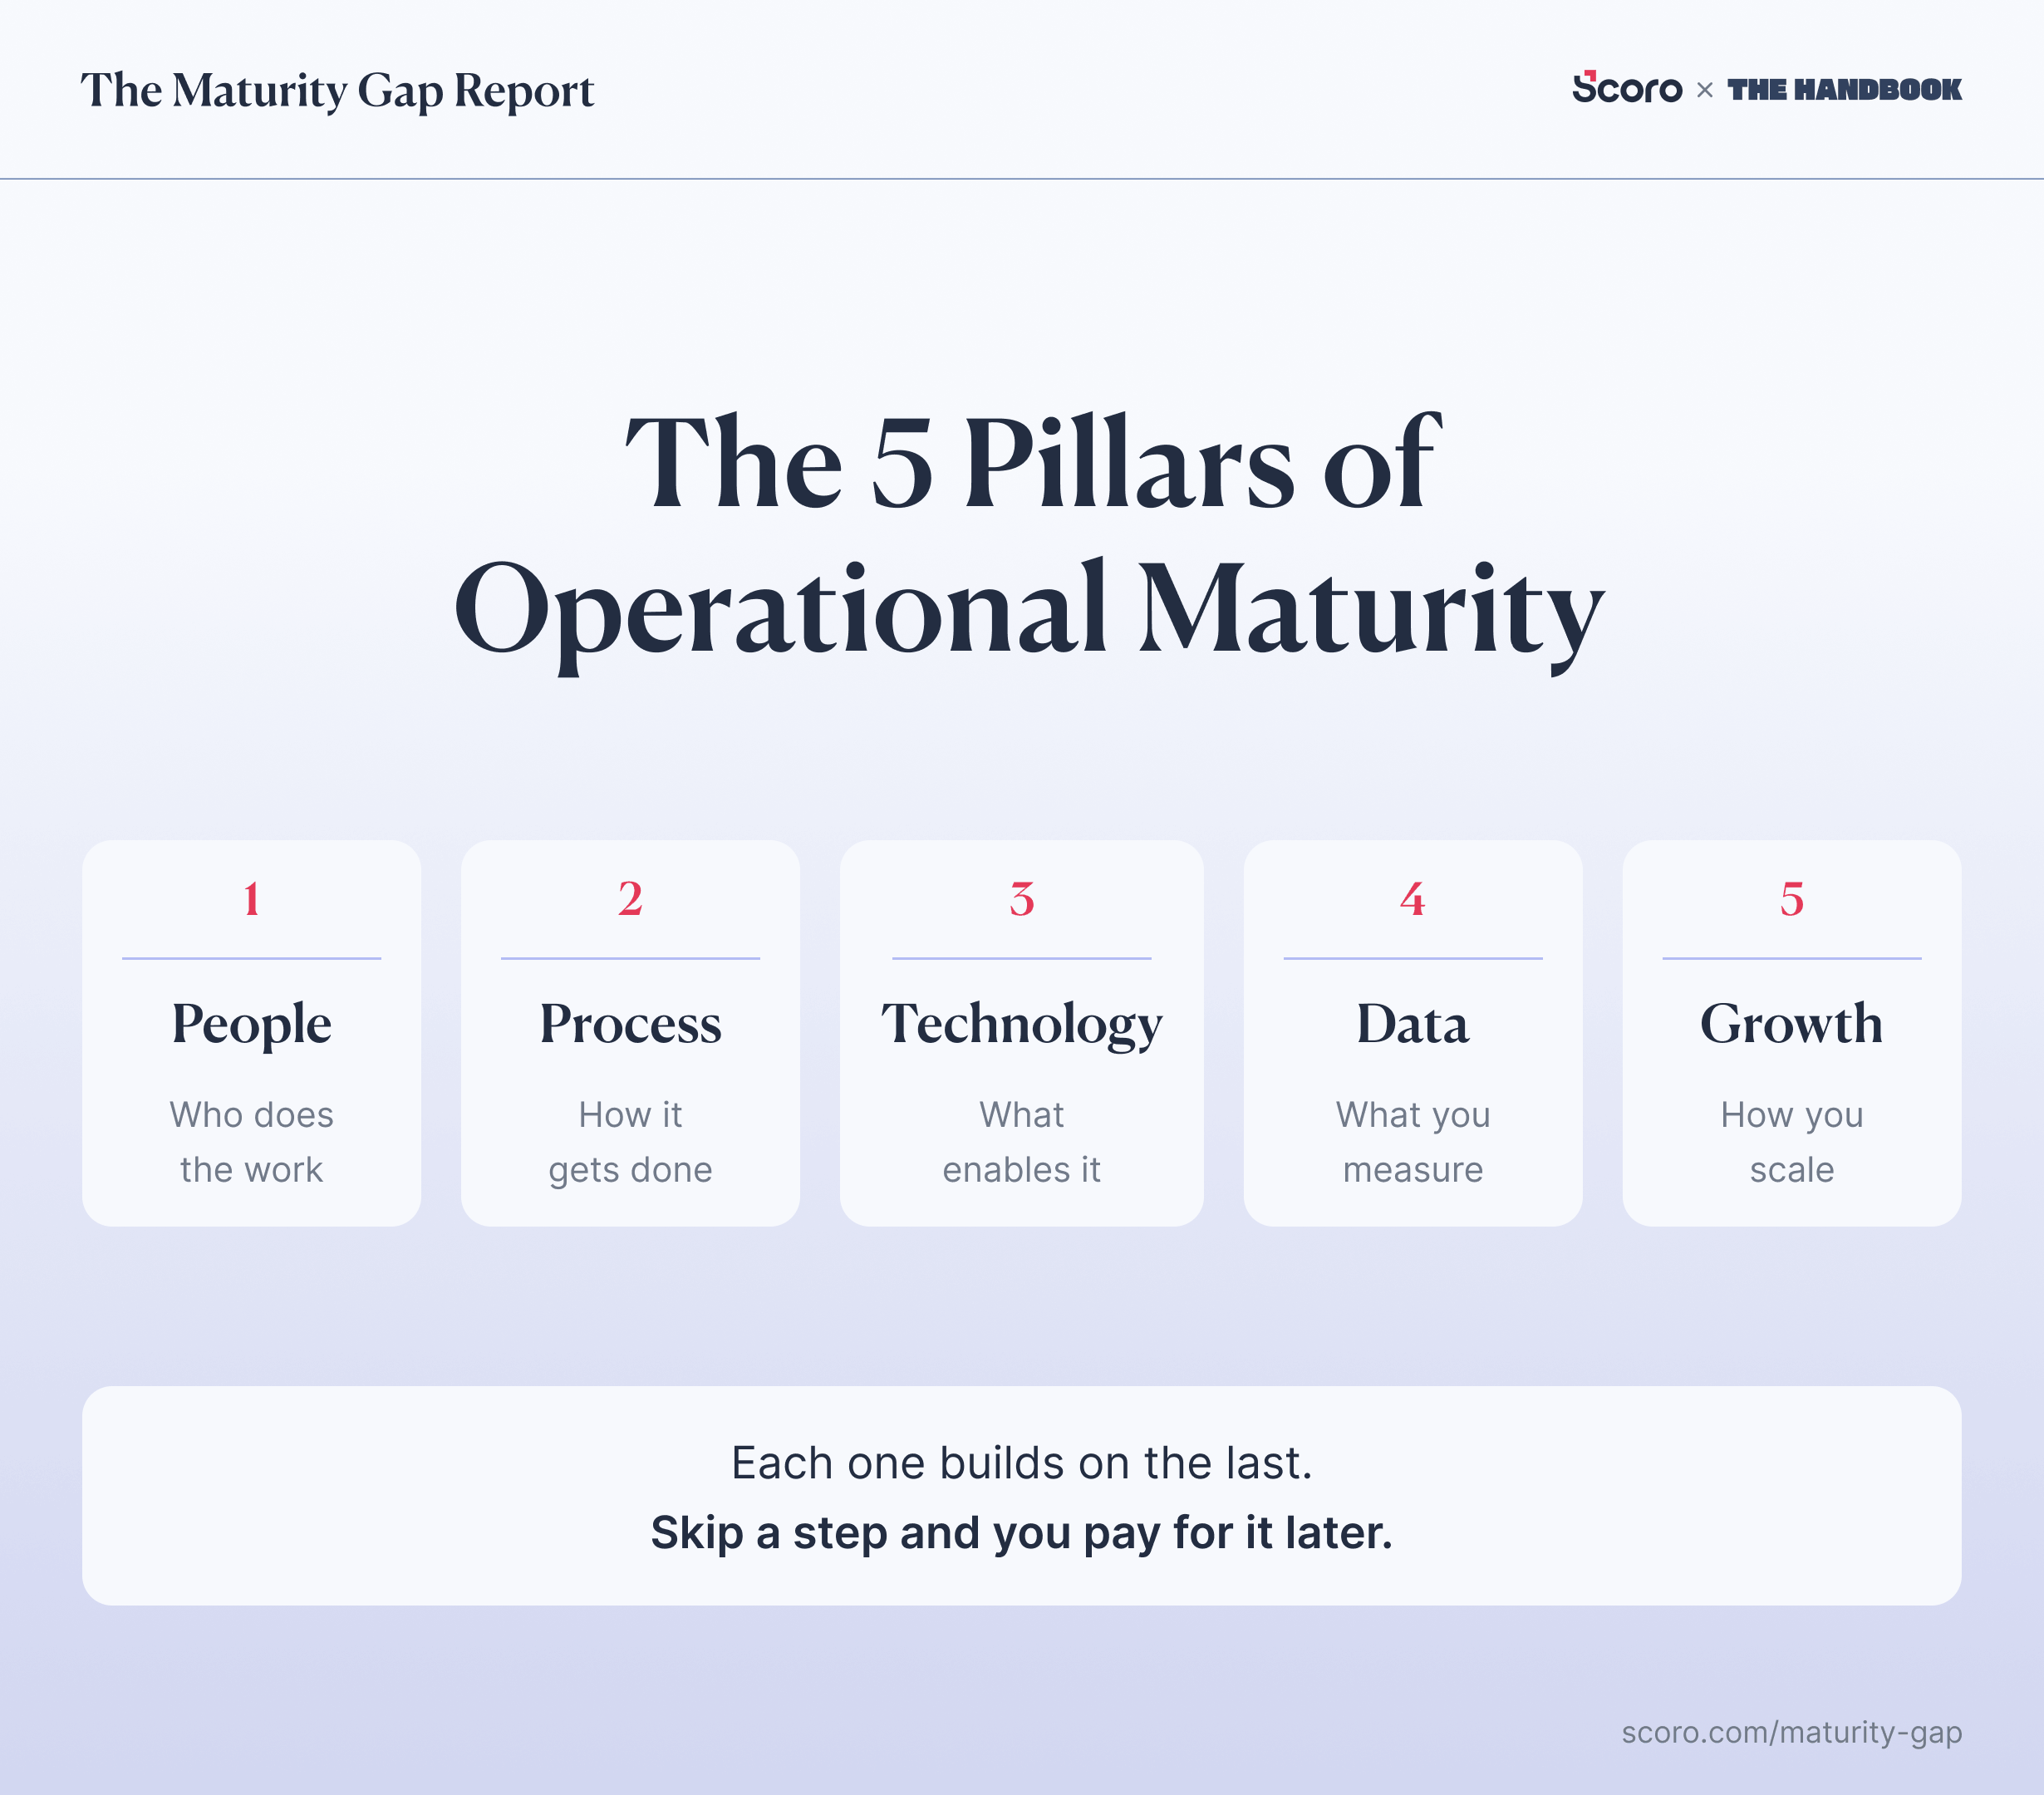
For each question, we asked firms to rate themselves honestly: “yes,” “somewhat,” or “not at all.”
Based on their responses, every firm received a score for each pillar (0–100%). Then, the average across all five pillars became their overall operational maturity score.
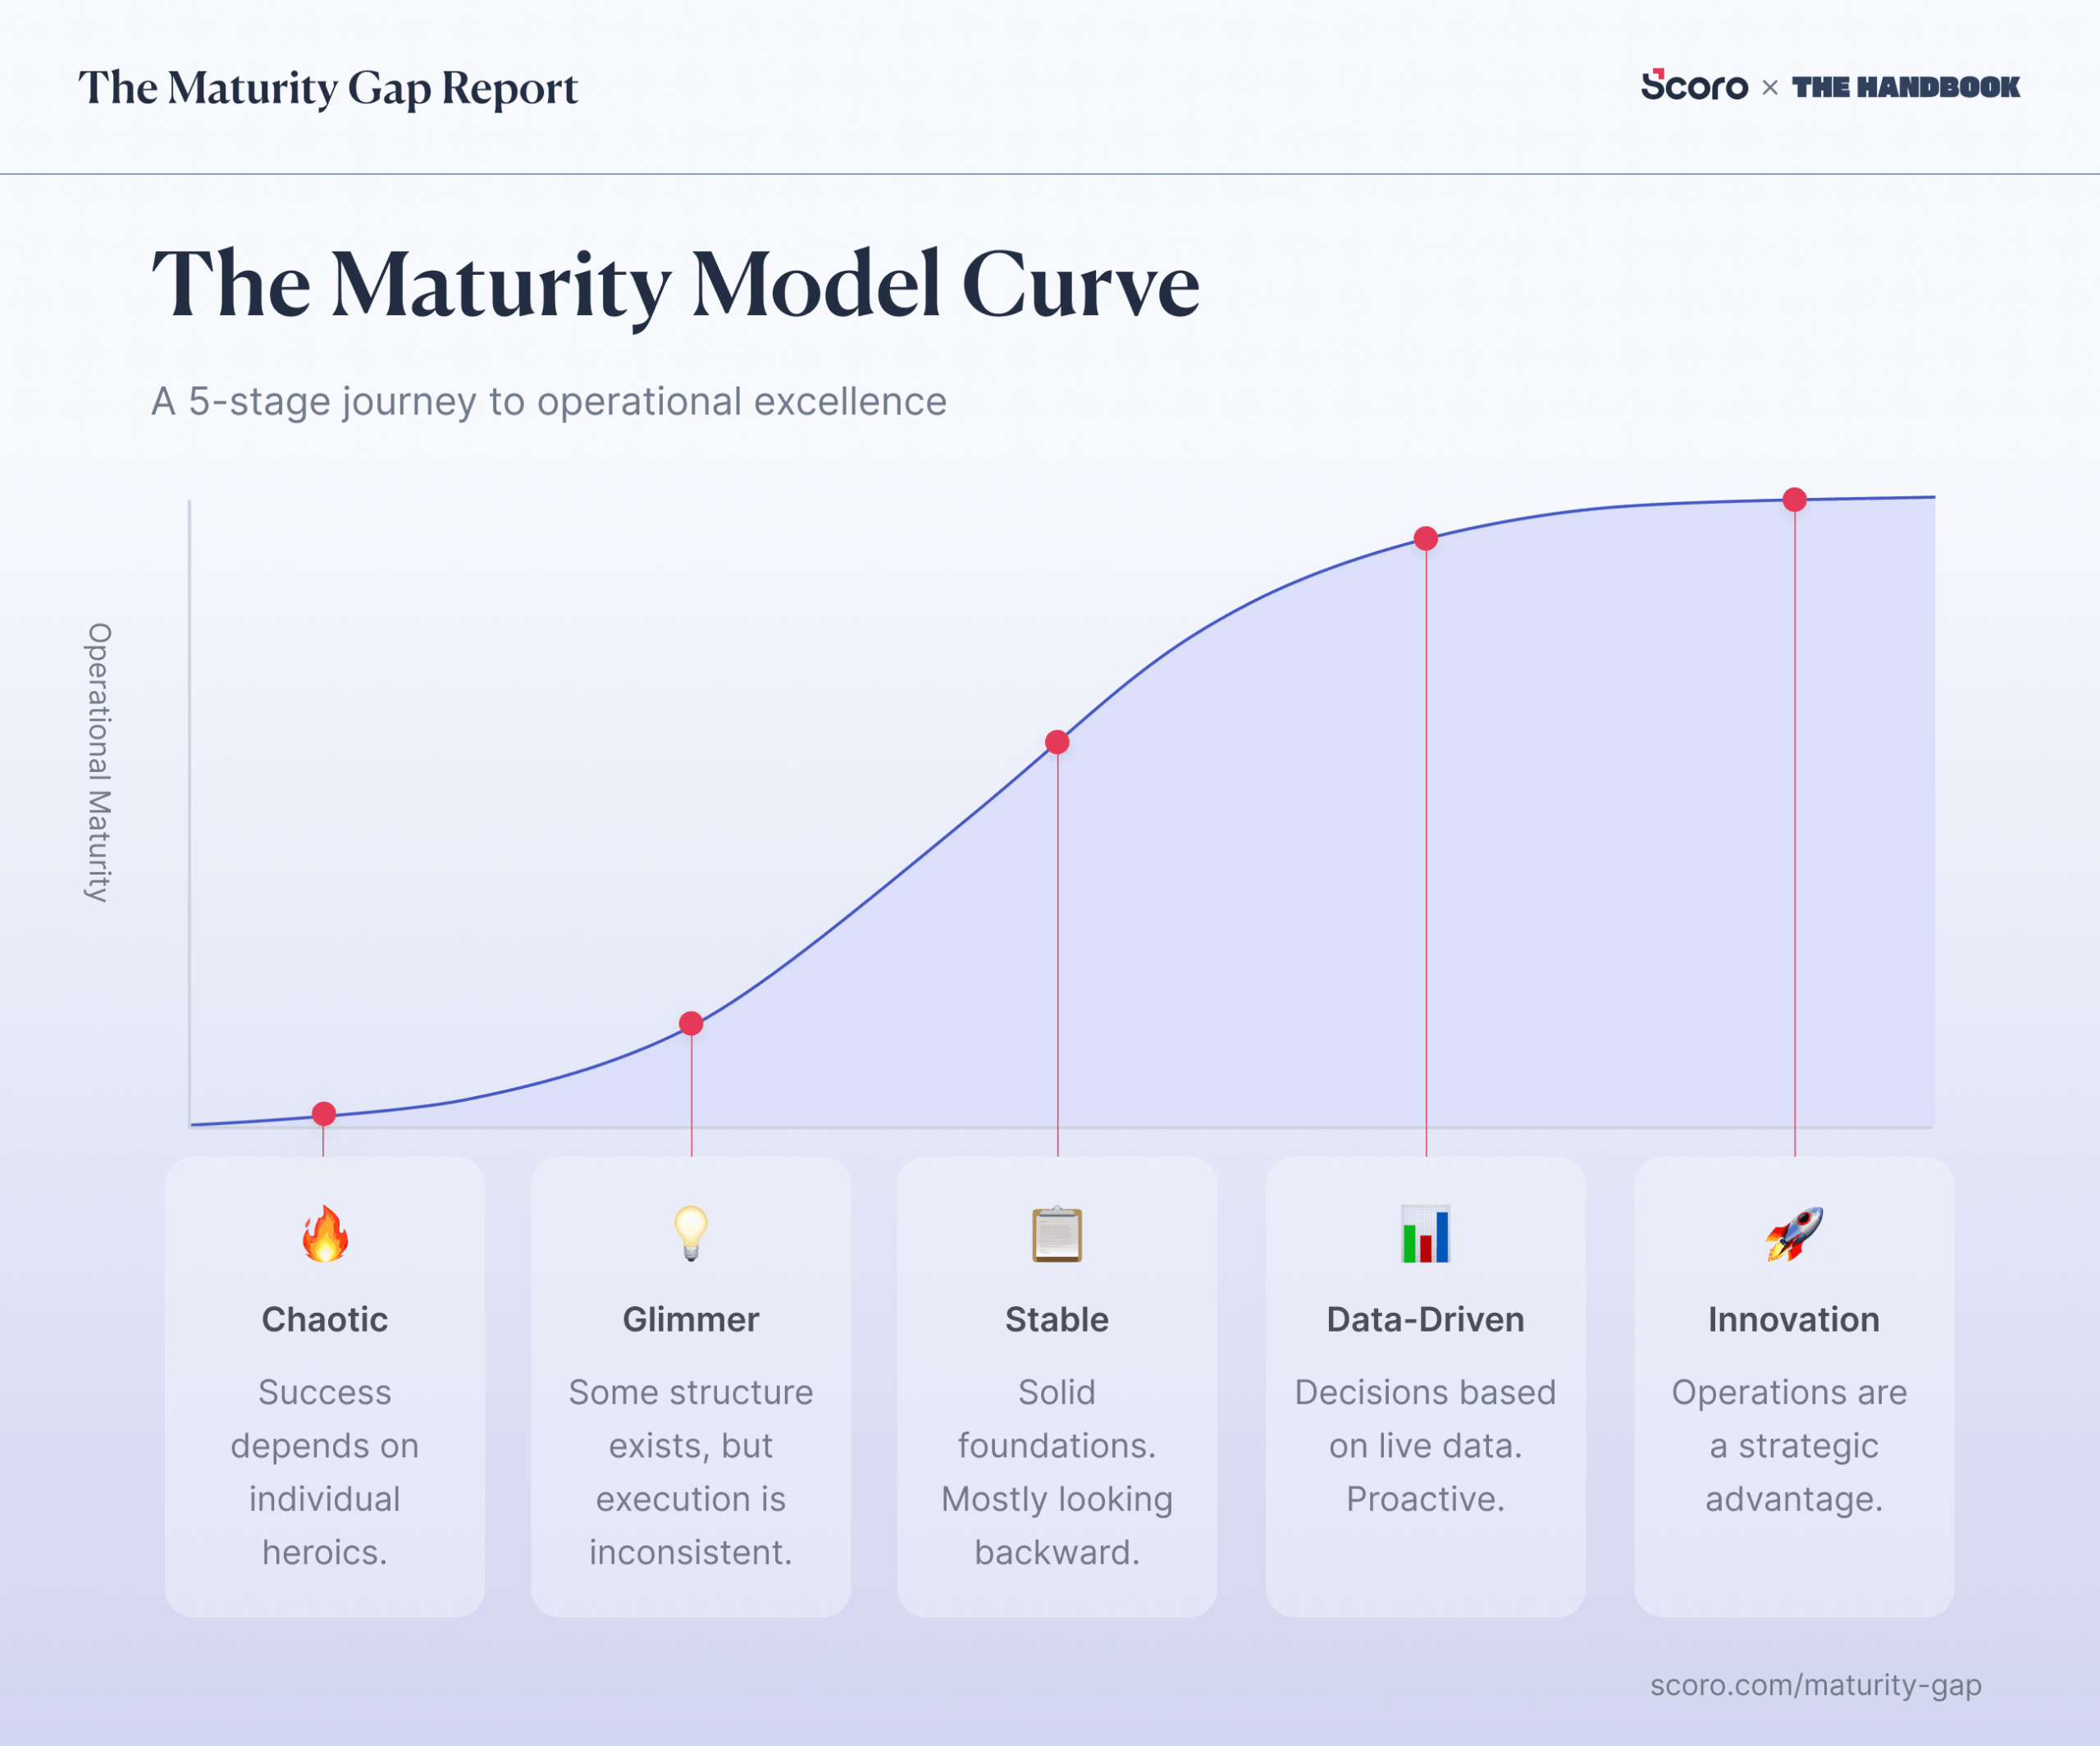
That final score placed each firm into one of five stages:
- Chaotic: No consistent processes, success depends on individual heroics, and every project feels like starting from scratch.
- Glimmer: Some structure exists on paper, but execution is inconsistent. You know what should happen. It just doesn’t happen reliably.
- Stable: Solid foundations. You have defined roles, documented processes, and maybe integrated tools. But you’re mostly looking backward.
- Data-Driven: Decisions are based on live data. You catch problems mid-project, forecast with confidence, and operate consistently across teams.
- Innovation: Operations are a strategic advantage, not an afterthought. Continuous improvement is built into how you work.
Key Findings
The clearest theme across 303 responses? Many firms are struggling with ops basics.
It’s not issues with strategy or talent causing problems. In fact, every single surveyed segment scored highest in the “People” pillar. It’s issues with the foundational infrastructure underneath.
The data doesn’t lie:
- Only 13% of firms use live data on margin to adjust mid-project. So most surveyed firms find out what went wrong after their invoices go out. And by then, there’s nothing to do but take the hit.
- 41% of firms track time and expenses accurately. Only 13% use that data to make decisions. The information exists. It’s just not connected to anything.
- Fewer than 1 in 4 can forecast with confidence. Just 24% of firms can forecast margins, revenue, or capacity confidently. The rest are guessing and monitoring performance in the rearview mirror.
- Nearly half claim to be strategic partners. But 85% have no live data to act like one. 47% of firms say clients see them as a “strategic partner.” But 85% of those same firms don’t use live data to guide decisions. How strategic is that, really?
- Only 1 in 8 firms have automated any of their workflows. Just 12.5% say they’ve automated meaningful portions of how they work. More than a third say they’ve automated almost nothing. In 2026!
- Only 1 in 5 firms have their operations joined up in a single system. So 80% are running projects, tracking time, and reporting finances across disconnected tools or spreadsheets.
- Roles are “clearly defined” at just 35% of firms. They’re “somewhat defined” for 59%. Without clear roles, there’s no way to measure performance, flag skill gaps, or know who’s accountable when things slip.
- Only 23% of firms take a proactive approach to business risk. And nearly 30% have no approach at all. So most firms are not managing risk. They’re just hoping nothing goes wrong.
- Only 13% of firms believe their operating model is ready to scale. Their current processes, tools, and systems were built for a smaller, simpler business. Not the one they’re trying to become.
- Zero percent of “Chaotic” firms track time accurately. Without accurate time data, every other metric—utilization, margins, forecasts—is guesswork. It’s the foundation everything else sits on.
- Only 21% have documented best practices. The other 79% are running on institutional knowledge. In people’s heads, shared in passing conversations, and one resignation away from disappearing entirely.
While these were the most concerning points we discovered, they don’t necessarily tell every firm’s story. Most actually landed in the middle.
The Middle Ground
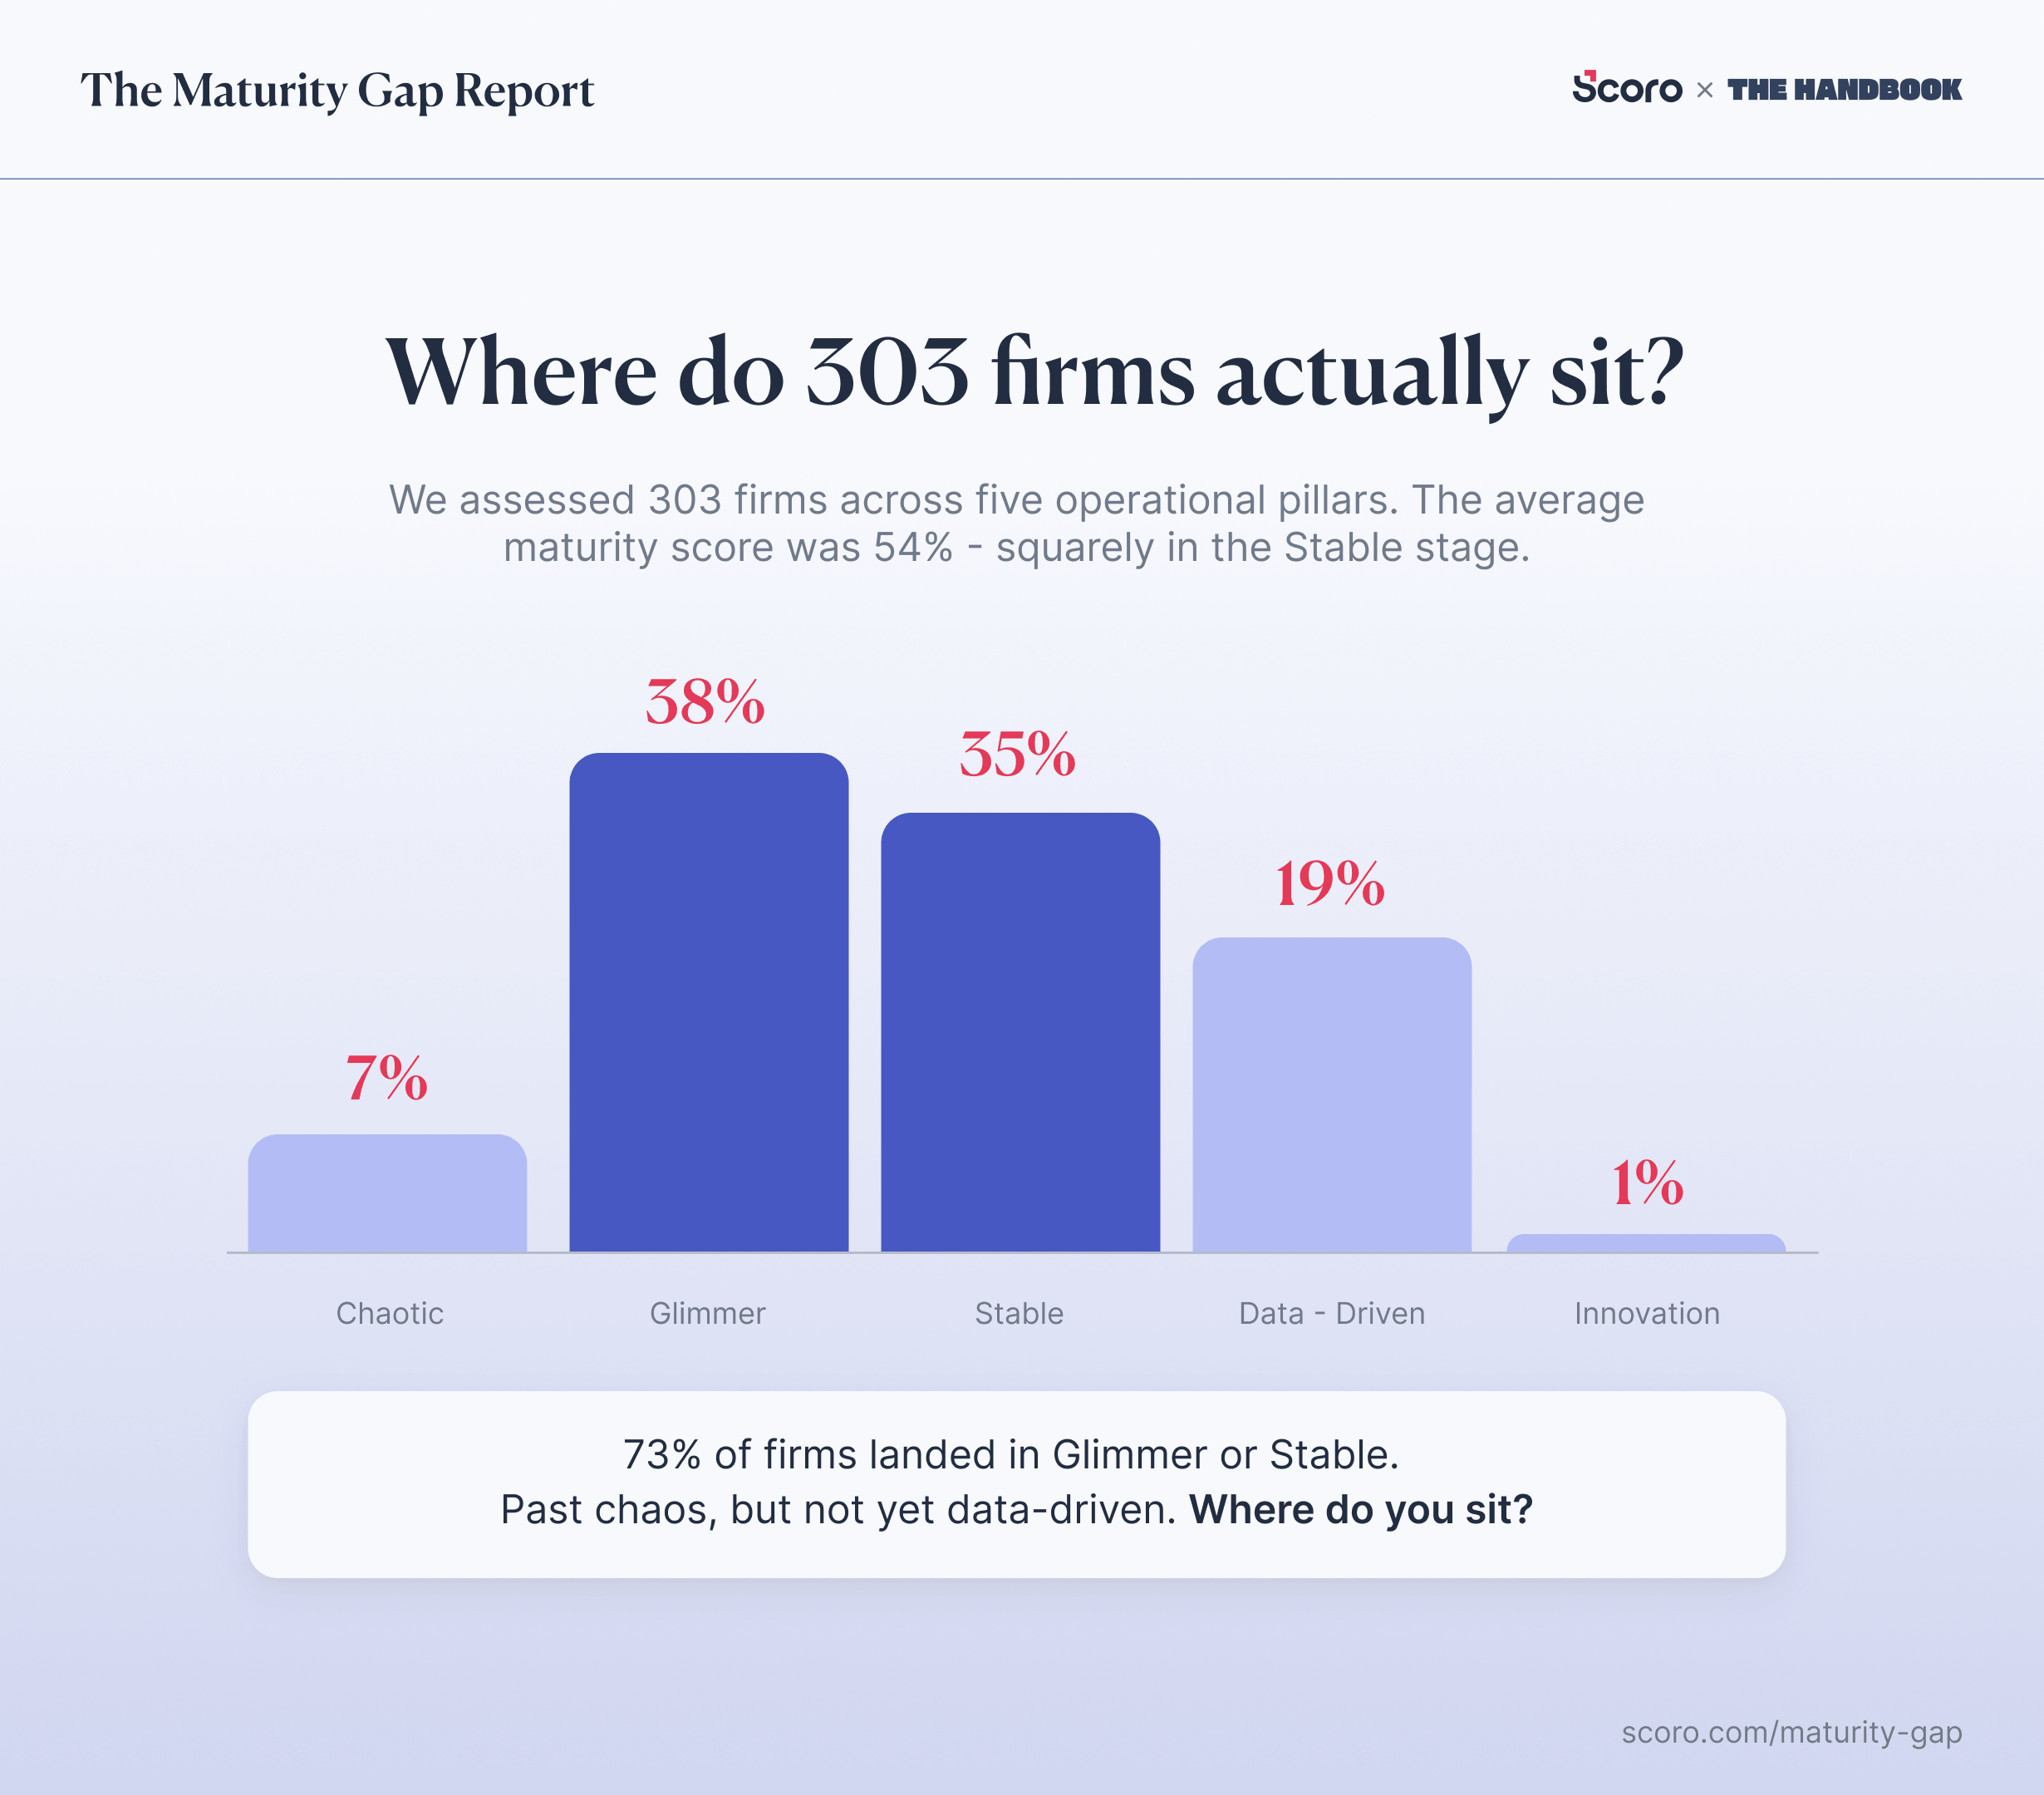
Only 20% of firms made it to the “Data-Driven” or “Innovation” stages, where we consider the top performers to be.
Nearly three-quarters (73%) landed in “Glimmer” or “Stable.” Past “Chaotic,” but not yet “Data-Driven.”
And the average maturity score across all 303 firms was 54%. Squarely in the “Stable” stage.
This makes sense when we look at how firms answered: the single most common response in our entire dataset wasn’t “yes” or “no.”
It was “somewhat,” making up 46% of all responses across every firm and every question.
So the average surveyed firm does have processes—they just aren’t consistent. There’s greater role clarity, but nothing concrete documented. They have tools in place, but they’re disconnected.
In other words: the appearance of maturity without the infrastructure to back it up.
These firms aren’t failing. But they aren’t progressing, either.
As Harv Nagra, Head of Brand Communications at Scoro, puts it:
The “Stable” era is where things start looking pretty good. But that’s exactly why firms get stuck there. The pain that forced you to change is gone, but you haven’t built the infrastructure to see what money you’re leaving on the table.
The Cost of Staying Stable
SPI Research’s benchmarks, based on a similar five-stage model, give us a clear picture of what each maturity level is worth financially:
| Stage | SPI Level | EBITDA | Growth | Utilization | Rev/Person | Margin |
|---|---|---|---|---|---|---|
| Chaotic | 1 | 2.7% | 0.1% | 59.6% | $105K | 16.5% |
| Glimmer | 2 | 5.7% | 2.7% | 61.3% | $149K | 24.1% |
| Stable | 3 | 9.1% | 6.4% | 70.4% | $224K | 36.8% |
| Data-Driven | 4 | 11.8% | 9.3% | 78.0% | $267K | 48.7% |
| Innovation | 5 | 20.8% | 14.4% | 83.6% | $294K | 55.8% |
EBITDA = earnings before interest, taxes, depreciation, and amortization.
Note
SPI Research structures their maturity model on a 1–5 numeric scale. Our stages above—”Chaotic” through “Innovation”—are our own framing, mapped to roughly mirror their levels for comparison purposes.
Even a single-level jump matters. For example, a $10-million firm moving from Level 3 to Level 4 could mean an additional ~$270,000 in annual profit.
So what’s stopping firms from making that jump?
What the Top 20% Are Doing Differently
We split the dataset into top performers (firms in the “Data-Driven” or “Innovation” stages, 20% of the sample) and bottom performers (“Chaotic” or “Glimmer” stages, 45%).
Here’s how they compare across all five pillars:
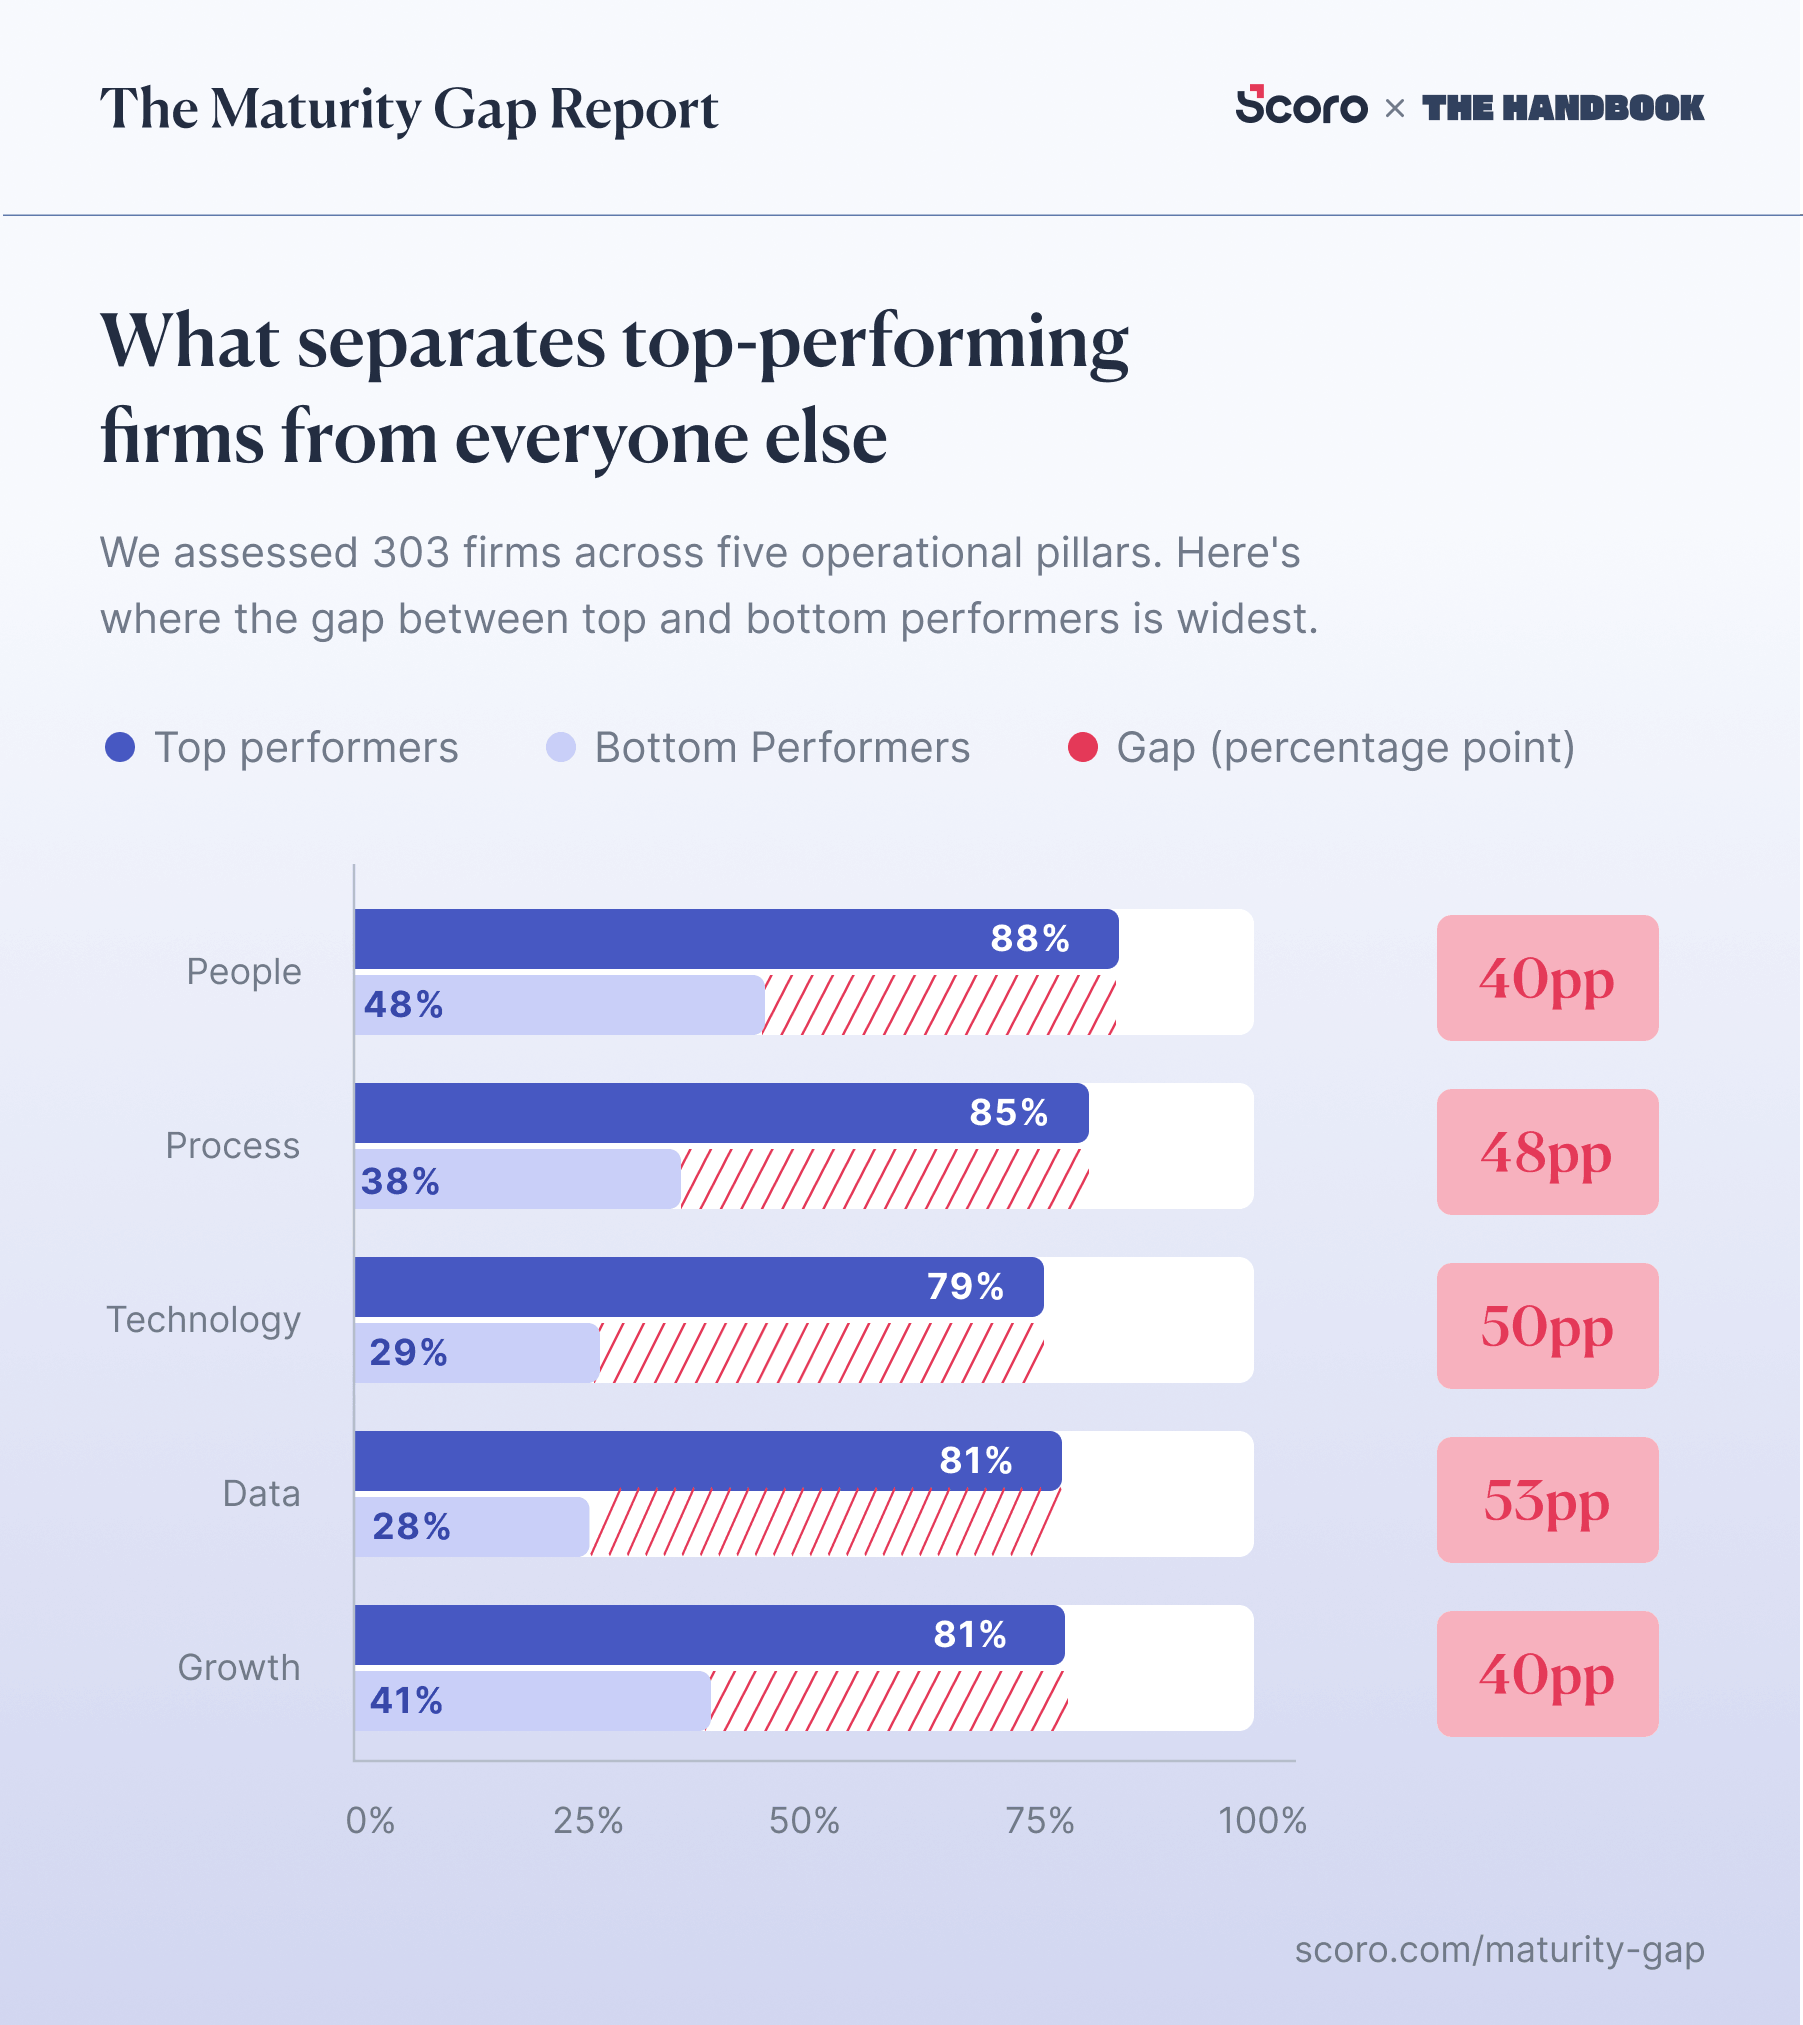
As we mentioned, both top and bottom performers scored highest in the “People” pillar. It’s where firms feel most confident, regardless of their stage.
But the differences became glaring in “Data” and “Technology.”
Top performers scored 81% on “Data.” Bottom performers scored 28%, with “Chaotic” firms only scoring 3.8%.
Firms aren’t failing to reach their potential because they have bad talent. They’re failing because they’re underinvesting in the infrastructure that helps those people work well (like real-time insights and connected tools).
Zoë Blogg, managing director of Reboot, has watched this play out:
I’ve seen firms stack senior hires into messy environments and expect performance to improve. But if systems don’t support decision-making, you just get expensive talent operating in fog. High performers don’t magically fix broken infrastructure. They either burn out trying to compensate for it—or lower their standards to match the system.
So “Data” and “Technology” are where the biggest gaps sit. The sections that follow dive into the specific issues firms have with both.
After that, we’ll compare scores across “Process,” “People,” and “Growth.”
Data: Where Most Firms Are Flying Blind
As we mentioned, the “Data” pillar has the widest gaps between top and bottom performers.
The biggest difference?
While 77% of top performers “monitor key project and financial metrics during delivery,” just 9% of bottom performers do the same.
| Question | Top Peformers | Bottom Performers | Gap | Average |
|---|---|---|---|---|
| Do you monitor key project and financial metrics during delivery? | 77% | 9% | 68pp | 29% |
| Do you track time, expenses, and outsourced costs accurately? | 82% | 17% | 65pp | 41% |
| Are budget reports, utilization, and key data automatically updated from live project activity? | 68% | 8% | 60pp | 24% |
| Can you forecast margin, revenue, and capacity with confidence? | 55% | 4% | 51pp | 24% |
| Do you use live data on margin and burned hours to guide decisions? | 40% | 2% | 38pp | 13% |
So top firms can spot overservicing, margin erosions, and resource gaps while there’s time to fix them. But bottom firms don’t see issues until projects are already wrapped up.
This leads right into another key difference:
Only 17% of bottom firms accurately track time, compared to 82% of top firms.
Richard Brett, a FinOps advisor, explains why this matters:
The best firms are not just tracking time spent against what’s sold, but also time booked, so they can see where it’s going to finish and still give them time to make changes—whether that’s asking for more money, adjusting resourcing, or changing the plan.
Without tracking real-time metrics (including time), the data that shapes decisions is either incomplete or wrong.
With this in mind, it’s no surprise that just 4% of bottom firms said they can “forecast margin, revenue, or capacity with confidence” versus 55% of top firms.
As Kate Bridge, an operations consultant at Mission: Purple, puts it:
To forecast revenue accurately, you need three things: a detailed pricing breakdown, a realistic project plan, and an honest view of what’s actually flowing through the studio. Without all three, capacity and margin forecasts are essentially guesses.
Without that visibility, firms:
- Overcommit on projects they can’t staff
- Underprice work they don’t understand the true cost of
- Miss signals that a key hire is needed until team members burn out
What real-time project visibility looks like in practice
Design de Plume, a 20-person creative agency, used to discover overservicing well after it happened.
After moving their project tracking, time capture, and budgets to Scoro, they saw a 20%+ improvement in project profitability.
We could tell we were over-servicing, but we didn’t have a way to track it effectively. By the time we saw the impact, it was already too late.
The shift
Review your biggest projects weekly. Are quoted hours tracking against actuals? The goal isn’t perfection. It’s to get in the habit of spotting issues before they eat into your margins.
Technology: The Fragmentation Problem
The “Technology” gap isn’t about how much firms spend on tools. It’s about whether those tools work well for their unique business, and whether anyone’s managing them.
Most bottom firms don’t have tools that help their teams “manage and analyze work effectively” (10% vs. 82% of top performers), and almost none have tools that give their team visibility into what’s happening (4% vs. 65% of top performers).
The root cause? No one owns the stack.
Just 16% of bottom firms have any governance over how tools are selected and used, compared to 83% of top firms.
And without that oversight, things fall apart behind the scenes.
| Question | Top Performers | Bottom Performers | Gap | Average |
|---|---|---|---|---|
| Does your team use tools that are designed to help them manage and analyze their work effectively? | 82% | 10% | 72pp | 35% |
| Is there governance over how tools and platforms are selected and used? | 83% | 16% | 67pp | 43% |
| Do your tools enable smooth collaboration and offer visibility to your team? | 65% | 4% | 61pp | 22% |
| Is your budgeting, planning, delivery, reporting and invoicing joined up in a single system (a PSA or ERP)? | 48% | 7% | 42pp | 20% |
| What portions of your workflows have been automated? | 43% | 4% | 40pp | 13% |
As Harv describes:
Nobody wakes up and decides to run their agency on a dozen different tools. It happens gradually—a PM picks one system, finance picks another, someone builds a spreadsheet to bridge the gap. Before you know it, you’ve got a stack that nobody owns and everyone works around.
And when the tools don’t work together, the costs show up in how team members spend their time.
Eilish Kennedy, COO at Power Shifter, explains what happens when people have to toggle between tools or deal with low-quality software:
It shows up as ‘busy.’ Everyone’s working hard, calendars are full, but output doesn’t match effort. You’re paying high salaries for people that bring high value, but they’re spending too much time doing work that doesn’t require their expertise.
What it looks like when the stack comes together
DGA Group, a 380-person global consultancy, struggled to work across seven separate platforms. QuickBooks in the United States, Deltek in Europe, spreadsheets everywhere else.
After consolidating into one platform, they saw a 33% increase in project profitability and 20% increase in utilization.
It was difficult to pull together data for group-level reporting. Systems weren’t integrated, staff were unhappy, and processes felt clunky and inefficient.
The shift
Audit what you actually have. List every tool your company uses for project management, time tracking, budgeting, and reporting.If you find more than one system doing the same job or spreadsheets bridging gaps between systems, those are red flags to address.
Process: Where Margin Starts Leaking
Across every “Process” question, the differences between top and bottom firms are stark.
It even included the single biggest gap in our dataset:
In answering whether they have a “structured way of onboarding new projects and clients,” 92% of top performers said yes. Just 12% of bottom performers said the same.
| Question | Top Performers | Bottom Performers | Gap | Average |
|---|---|---|---|---|
| Do you have a structured way of onboarding new projects and clients? | 92% | 12% | 79pp | 39% |
| Are your day-to-day processes clearly defined – but flexible enough to adapt when needed? | 85% | 18% | 67pp | 42% |
| Is your delivery approach defined and consistent across teams and client types? | 63% | 12% | 52pp | 25% |
| Do you have a proactive approach to identifying and preparing for business risks? | 58% | 6% | 52pp | 23% |
| Are best practices and institutional knowledge documented so they can be used for onboarding, training, and as an ongoing reference? | 55% | 7% | 48pp | 21% |
This 79-point gap isn’t just big numerically. It’s big in its impact.
When projects don’t start with a clear scope, documented assumptions, and defined ownership, problems compound through every stage of delivery.
Which means money quietly bleeds out before anyone notices.
Kate experienced this firsthand:
We won a high-profile client after a competitive pitch. The budget was large enough that it created a false sense of safety. The job was never fully scoped, assumptions weren’t documented, and a ‘say yes’ mentality took over. Overservicing became normalised almost immediately.
And outside of project prep, only 18% of bottom firms have clearly defined processes for anything, compared to 85% of top firms.
But even firms that do document their processes often hit a wall.
Why?
Because having something written down doesn’t mean people use it.
Pilar Suquilvide, founder of Your Agency COO, sees it constantly:
Firms stall because they confuse documentation with adoption. Getting SOPs written, workflows mapped, and tools implemented feels like progress. But that’s the easy part. The hard part is changing how people actually work day to day.
What it looks like when processes get documented (and followed)
At Saentys, a 50-person creative agency, Harv explains that new hires learned how things worked from whoever they sat next to.
Which led to inconsistent practices and workarounds.
To address this problem, Harv created a central, standardized handbook during the rollout of the firm’s new professional services automation (PSA) tool.
In it, he added 20 how-to videos, each covering best practices for everything from creating a quote to scheduling invoices.
Then, new hires had to work through each process using only the handbook—no asking coworkers.
This led to processes that actually stayed consistent. Not because people were told to follow them, but because the habit of going to the handbook was built in from day one.
| [After rolling out the handbook and practice cases, onboarding time dropped by X% / new starters were project-ready in X days instead of X weeks — TBC WITH HARV] |
Harv breaks down his full methodology in the “How to document and embed best practices that stick” episode of “The Handbook” podcast.
The shift
Pick one process—quoting, kickoffs, invoicing—and write down how it should actually work. Then, create a short video or a one-pager that any new hire could follow on day one. Share with team members to test it and fix problems.
People: The Roles You’re Not Investing In
As we mentioned, respondents across the board scored the highest in the “People” pillar.
We found that both top and bottom firms continuously invest in delivery team members (which is a good thing). But it’s not the same story for non-billable roles.
Only 22% of bottom firms have dedicated ops, finance, and resourcing roles, compared to 73% of top firms.
Without those roles, operational work doesn’t disappear, it falls to whoever has a spare moment.
So founders end up making staffing decisions, senior team members chase invoices, and project managers follow up on timesheets. All work that was never in their job descriptions.
| Question | Top Performers | Bottom Performers | Gap | Average |
|---|---|---|---|---|
| Does your leadership team include someone responsible for strategic operations / operational strategy? | 92% | 27% | 64pp | 53% |
| Do you regularly review team performance and morale? | 85% | 21% | 64pp | 45% |
| Are roles and responsibilities clearly defined in the business? | 70% | 13% | 57pp | 35% |
| Do you have dedicated internal operations, finance, and resourcing roles to oversee the core functions of the business? | 73% | 22% | 51pp | 46% |
| Is there a leadership structure in place so decision-making doesn’t rest with a single individual? | 68% | 27% | 41pp | 46% |
There’s also a clear connection between distributed leadership and firm progress: only 5% of “Chaotic” firms have distributed decision-making. At “Glimmer,” it’s 31%. By “Data-Driven,” 66%.
Karl Sakas, founder of Sakas & Company, sees this repeatedly:
Most firms stall because the early wins reduce operational pain but don’t reduce business risk. Defined roles, documented processes, and partial systems create the appearance of maturity, yet the firm still depends on a small number of people—often the founder—to resolve ambiguity, approve exceptions, and interpret the numbers.
You can’t build strong systems when every decision funnels through one person or the same people every time.
But it can be a tough transition. As Ryan Pearcy, founder of Digital Transformers Group, puts it:
Distributed decision-making is a milestone in business growth. It cannot happen at launch, but needs to happen before you get to 50 people. It’s hard to let go, and many business owners can’t.
What it looks like when someone owns ops
When Harv was at Saentys, there was only one internal-facing, non-billable person in the entire organization: the finance manager. Everyone else in management was focused on delivery.
It was exhausting and dangerous. Do we prioritize client work and our teams or ensure the business is still running? We had an intervention with the founders saying, ‘People are going to burn out and walk out.’
Luckily, the founders eventually listened. They brought in an interim COO and Harv moved into a dedicated ops role. Within 18 months, they’d restructured teams, overhauled systems, and introduced entirely new ways of working.
The shift
If no one owns ops strategically in your business, that’s the issue. Not needing more delivery hires. A dedicated ops role (even part-time) creates the visibility and accountability that lets everything else work.
Growth: Where Everything Either Pays Off or Falls Apart
Growth is the last pillar for a reason. Without the previous four pillars as a solid foundation, you can’t see true progress in this category, which the data further reinforces:
| Question | Top Performers | Bottom Performers | Gap | Average |
|---|---|---|---|---|
| Do you regularly review overheads and margins to determine whether pricing should change? | 78% | 21% | 58pp | 39% |
| Are you innovating and evolving your services in response to market shifts? | 73% | 26% | 48pp | 45% |
| Are you seen by clients as a strategic partner? | 75% | 30% | 45pp | 47% |
| Do you have a consistent, repeatable way of bringing in new business? | 52% | 10% | 41pp | 22% |
| Do you believe your current operating model is fit for purpose and set up to scale? | 38% | 5% | 33pp | 13% |
Only 38% of top performers feel their operating model is ready to scale. Only 5% of bottom performers do.
Scaling is hard for everyone.
But without the foundations—accurate data, connected tools, defined processes, the right roles—it’s nearly impossible:
- You can’t review (and improve) margins if you’re not tracking them to begin with
- You can’t evolve services if you’re constantly putting out delivery fires
- You can’t position yourself as a strategic partner if your operations are reactive
Top performers aren’t finding growth easy. But they’ve at least built the infrastructure to make it possible.
Zoë agrees that growth is a direct result of what firms build underneath it:
Growth today comes from operational clarity. What separates top from bottom performers is whether their people are supported by integrated systems, real-time visibility, and defined processes.
And that foundation matters more every year. As Marcel Petitpas, CEO of Parakeeto, argues, the bar for what “good” operations looks like keeps rising:
Margins are coming under significant pressure as competition globalizes and AI makes things more efficient. The level of sophistication required to be profitable increases over time. Talent will still be table stakes—but data and tight operations will be too.
What it looks like when it works
The pattern across our case studies is consistent: firms that fixed their operational foundations (DGA Group, Design de Plume, Saentys) improved revenue and profitability.
The shift
Don’t start with complicated “growth” initiatives. Master the basics underneath first. Pick one: get your time tracking accurate, consolidate your tools, or build a proper project kick-off process. Growth becomes possible after those are in place.
“But Our Industry Is Different…”
The pillar breakdowns above are based on our full dataset.
So do they hold across different firm sizes and industries? Or are some sectors genuinely different?
Let’s look at the data:
| By Company Size | Bottom Two Pillars | Top Pillar |
|---|---|---|
| 1–4 people | Data, Technology | People |
| 5–9 people | Technology, Data | People |
| 10–19 people | Technology, Data | People |
| 20–49 people | Data, Technology | People |
| 50–99 people | Technology, Data | People |
| 100–249 people | Technology, Growth | People |
| By Industry | Bottom Two Pillars | Top Pillar |
|---|---|---|
| Marketing / Advertising | Data, Technology | People |
| Business Consulting | Technology, Data | People |
| IT / Software | Technology, Data | People |
| Creative / Design | Technology, Data | People |
| Construction / Engineering | Data, Technology | People |
To summarize:
- Every single segment scored highest in the “People” pillar
- “Technology” was one of the bottom two pillars for all segments
- “Data” was one of the bottom two pillars for 10/11 segments
And this isn’t getting easier. Margins are shrinking, AI is raising the bar for efficiency, and the cost of staying where you are goes up every year, and competitors who’ve figured out their operations are winning on both speed and margin.
So, how do you move forward?
If You Do Nothing Else
To close the distance between where you are and where the top 20% operate:
- Standardize the start. Projects that start with clear scopes and defined ownership,end with higher margins. If every project starts differently, margins start leaking.
- Consolidate your tools. Move project management, tracking, and reporting into one connected system. If you’ve got spreadsheets bridging gaps between tools, your stack needs fixing.
- Monitor during delivery, not after. Post-mortems are valuable. But if that’s the first time you see project numbers, the money’s already gone. Build the habit of checking quoted hours against actuals on your biggest projects every week.
- Fix the data before you build on it. Dashboards and forecasts are only as good as what feeds them. If time isn’t logged daily, expenses aren’t captured against the right projects, or outsourced costs aren’t tracked at all, that mess of incorrect info will cost you.
- Give someone ownership of ops. Without it, founders make resourcing calls, senior staff chase invoices, and no one’s watching margins until it’s too late.
The good news is that these business gaps are fixable. You just need to know what yours are, and take action to remedy them.
Find out by taking the same business maturity quiz we used for this study.
In a few minutes, you’ll get:
- Your score for each maturity pillar
- Your firm’s overall operational maturity score and stage
- A breakdown of your strengths and weaknesses
- Suggestions about what to focus on next
Methodology
The Sample
303 professional services firms surveyed between August 2025 and January 2026.
- Industries: Marketing/Advertising (30%), Business Consulting (27%), IT/Software (15%), Creative/Design (14%), Construction/Engineering (10%)
- Firm sizes: 1–4 people to 500+, most between 5–99
- Geography: UK (33%), US (18%), Australia (10%), Canada (7%), others (32%)
Scoring
Each question offered three response options: fully positive, partial, and negative responses—scored 2, 1, and 0 respectively
For individual firm scores: Responses are scored with 0, 1, or 2, points. Each pillar score is calculated as “points earned ÷ 10,” expressed as a percentage. The overall maturity score is “total points ÷ 50.” This determines which stage a firm falls into.
For the gap analysis in this report: The percentages shown only count “Yes” responses. “Somewhat” doesn’t count. So when we say “77% of top firms monitor metrics during delivery,” that’s 77% answering “Yes”—not “Yes” or “Somewhat.”
Limitations
Self-selection bias: firms that take a quiz like this are probably already thinking about improvement. Our sample has fewer “Chaotic” firms (7%) than industry benchmarks suggest (30%). Connected systems correlate with success, but we can’t prove causation. Small segments (Architecture n=5, Legal n=5) shouldn’t be over-interpreted. Innovation-stage firms: only n=4.
Financial benchmarks
Our assessment focused purely on operations. We didn’t ask firms about their revenue or profitability. Financial performance data comes from SPI Research’s 2025 benchmark of 50,000+ professional services firms. We mapped our stage definitions to their performance levels to estimate the financial impact of each maturity stage.
Financial impact figures—such as the ~$270,000 profit increase for a $10M firm—are modeled inferences based on the EBITDA delta between levels, not direct measurements.