
Data is a good thing for agencies to rely on.
But too much data can cause more problems than it solves.
If your agency dashboard is overloaded with dozens of metrics and graphs, it makes it hard to answer the big questions:
- Are we growing in a healthy way?
- Are we actually making money?
- Are we using our team’s time well?
To make it easier to focus, we’ve identified the eight key metrics that let you zero in on your four ‘CORE’ business areas:
- Clients → Are we bringing in enough high-quality, predictable revenue?
- Operations → Are we using our team’s time effectively and efficiently?
- Returns → Are we turning that revenue into strong margins and real profit?
- Exposure → Are we spotting risks before they hit cash flow or stability?
Let’s walk through each one.
Clients: Are we bringing in enough high-quality, predictable revenue?
These metrics help you spot whether your revenue engine is sustainable (not just busy).
1. Pipeline health
Pipeline health measures the total value of deals in your sales pipeline compared to the revenue you want to bring in.
A healthy pipeline is one that’s worth approximately three to four times your revenue target. This way, you have breathing room if deals fall through.
And won’t need to rely on last-minute sales, discounts, or bad-fit clients just to stay afloat.
For example, if you want to earn $250,000 next quarter, your pipeline should be worth at least $750,000. If it’s only $100,000, you’ll be scrambling to fill the gap.
Use Scoro’s “Pipeline” report to view, you’ll see one clear number: the total pipeline value (“Sum”), which is exactly what we mean by “pipeline health.”
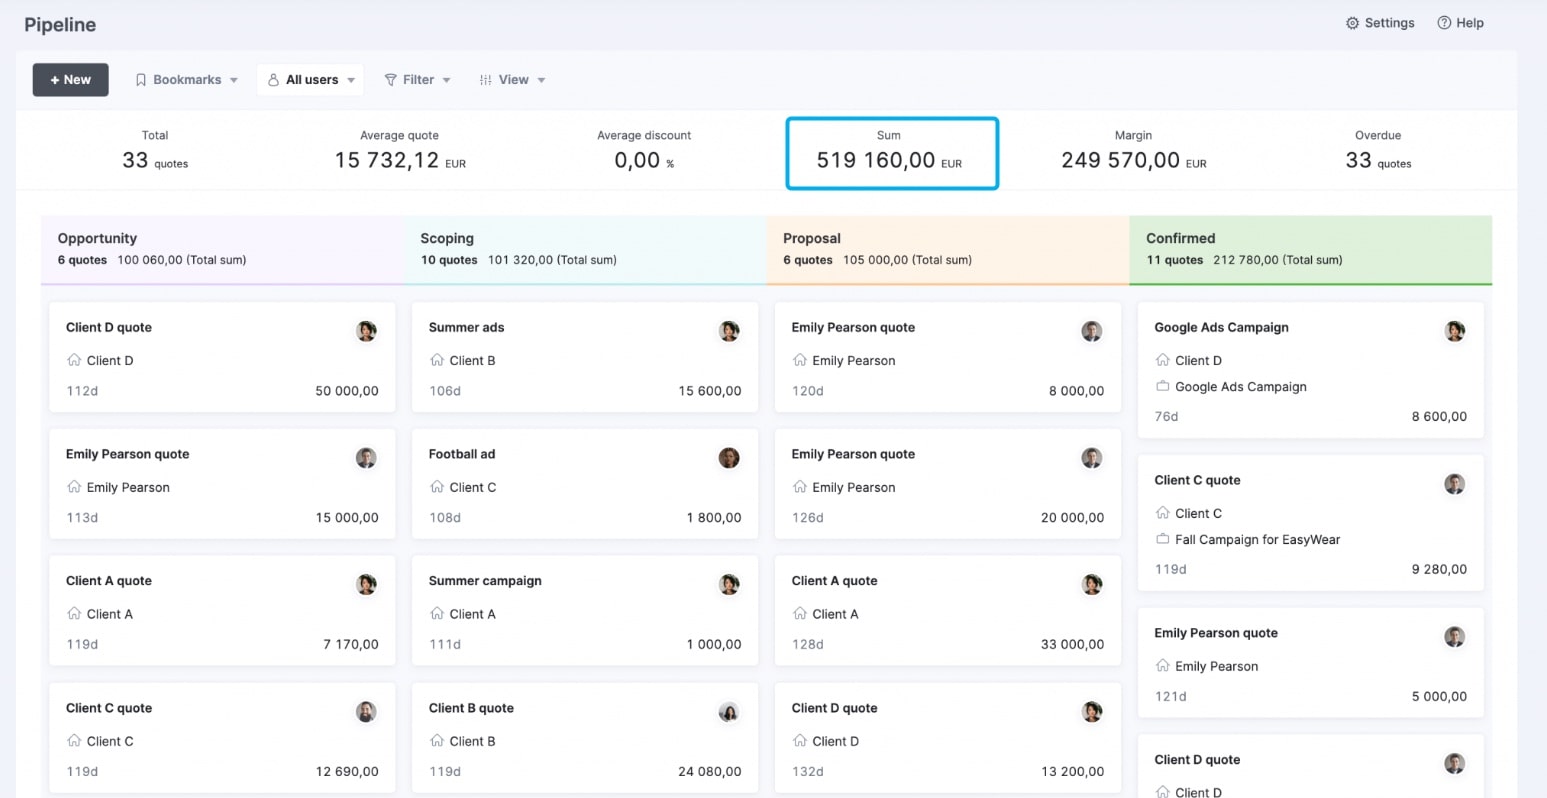
If you ever want to dig deeper to understand why your pipeline looks strong (or weak), Scoro also lets you inspect:
- The total number of active quotes (deals) in your pipeline
- The average deal value, so you know roughly how many opportunities you need to close
- Projected profit margin, to check how much you’d actually keep if all deals convert
But for most agency leaders, that single “sum”—your total pipeline value—is the only figure you need to keep front and center.
So how do you grow your pipeline?
Most agencies rely too heavily on referrals and repeat work—until those sources dry up, and panic sets in.
You need a repeatable, scalable sales engine.
Without a documented, repeatable engine, you’ll never achieve true scale, reliable forecasting, or long-term stability. Only with systemized process can you build a pipeline that consistently delivers.
If that’s where you are now, check out our podcast episode with Ryan Hall.
It’s a deep dive into building a sales process that actually works (even if you’re not a “sales” person).
2. Forecasted revenue
Revenue forecasting helps you see how much revenue is likely to come in over the next few weeks or months. Factoring in both confirmed contracts and high-probability pipeline deals
Knowing your forecasted revenue is essential for planning hiring, allocating resources, and managing cash flow with confidence.
Let’s say your confirmed revenue for next month is $120,000. But your forecast (including likely-to-close deals) shows $180,000.
That extra $60,000 might mean you can:
- Staff proactively instead of scrambling: Because you know you’ll likely bring in an extra $60,000, you can start tentatively booking team members or lining up freelancers now rather than waiting until the last minute and scrambling to fill seats.
- Hold off on low-margin projects: If your forecasted pipeline already covers your target, you can decline low-paying or marginal jobs you might have otherwise taken just to hit a revenue number.
- Avoid panic-hiring when a month starts: Instead of waking up on the first of the month wondering if you have enough work, a forecast showing that extra $60,000 lets you hire on your own schedule rather than scrambling.
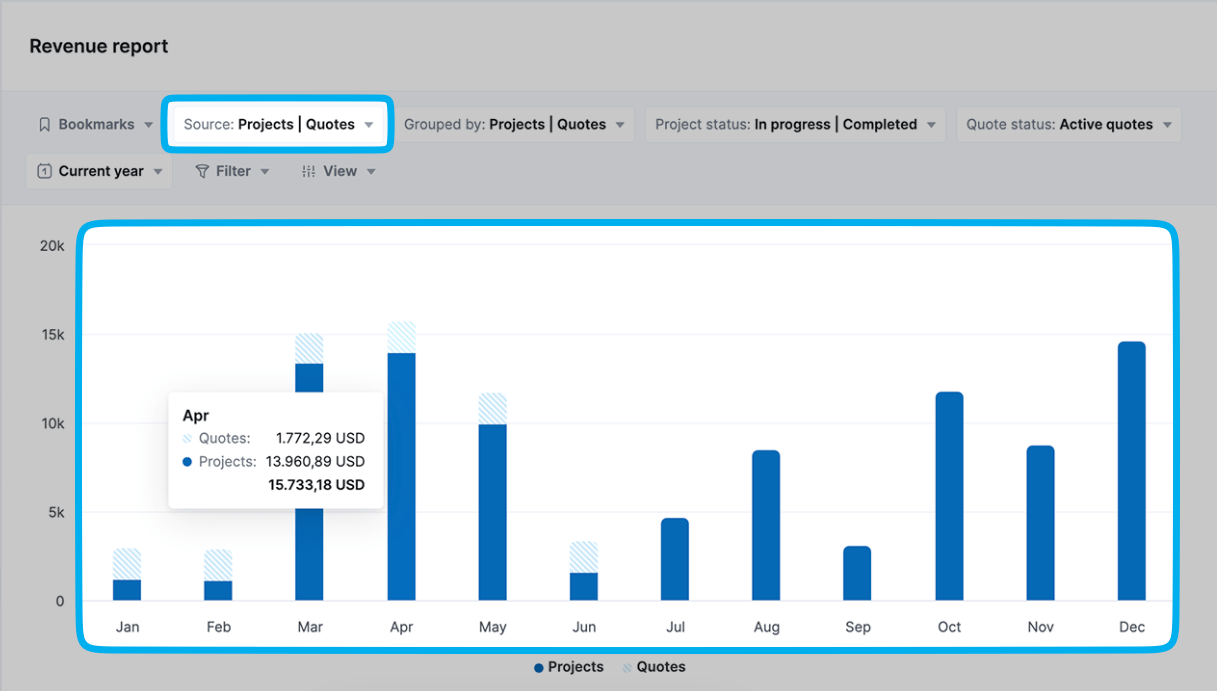
In Scoro, quotes added to your pipeline also feed into the revenue report, giving you a clear, forward-looking picture of what you’re likely to earn.
Your overall forecast is built from two sources:
- Confirmed revenue from signed projects
- Pipeline revenue from active quotes (based on their deal stage)
At the top of the report, make sure both “Projects” and “Quotes” are selected as data sources.
Then look at the bar for the month you care about—the total height of that bar (solid for confirmed projects + hatched for pipeline quotes) is your total forecasted revenue.
Here’s how to get the most out of it:
- Filter for late-stage deals: Hone in on quotes closest to closing so your forecast is realistic. Then you can decide confidently whether to onboard new hires or contract freelancers.
- Apply weighted probabilities: Assign confidence levels to each quote based on deal stage, giving you a truer forecast that you can use to allocate your team’s time to the right projects.
- Review weekly, not monthly: Check your forecast every week to spot surges or shortfalls early. So you can adjust hiring plans, shift resources, or tweak budgets before month-end stress sets in.
- Tie it into capacity planning: Share the forecast with project leads so they can assign staff based on expected workloads, preventing overstaffing or burnout.
- Use it to manage cash flow: Leverage projected cash inflows to schedule vendor payments, plan software renewals, and avoid unexpected budget gaps.
Ops: Are you using your team’s time wisely?
These metrics show how well that time is being used. And whether you’re overstaffed, underused, or simply not selling it right.
3. Billable utilization
Billable utilization shows the percentage of your team’s time that goes toward work you can invoice.
The formula is:
Billable Utilization = (Billable Hours ÷ Total Hours Worked) × 100
Low utilization means people don’t have enough billable work on their plate. Or they’re spending too much time on non-billable internal tasks or client work.
High utilization means you’re monetizing more of their time. But too-high utilization can cause burnout.
What to aim for:
| Role | Focus | Target |
|---|---|---|
| Producers / Freelancers | Client delivery | 75–80% |
| Managers | Overseeing projects and client relationships | 35–50% |
| Sales / Admin | Business operations and growth | >10% |
Understanding the right benchmarks for each role helps you staff smarter, manage expectations, and protect your margins.
And even a small shift in billable utilization can dramatically increase your revenue.
Let’s look at two agencies with the same team size, delivery costs, and hourly rate—but different billable utilization.
| Agency | Billable hours | Rate | Revenue | Delivery cost | Gross profit | Delivery margin |
|---|---|---|---|---|---|---|
| A | 5,000 | $100 | $500,000 | $300,000 | $200,000 | 40% |
| B | 6,000 | $100 | $600,000 | $300,000 | $300,000 | 50% |
That 10% increase in utilization gives Agency B an extra $100,000 in profit. Because the same team is billing more hours without adding headcount or raising delivery costs.
Top Tip
Don’t confuse billable utilization with resource utilization.
- Billable utilization = Time spent on work you can bill to clients
- Resource utilization = All assigned time, including internal and non-billable tasks
A team member can be fully utilized (100% scheduled), but still only 50% billable. That’s why it’s important to track both. One shows how busy your team is, the other shows their revenue-generating potential.
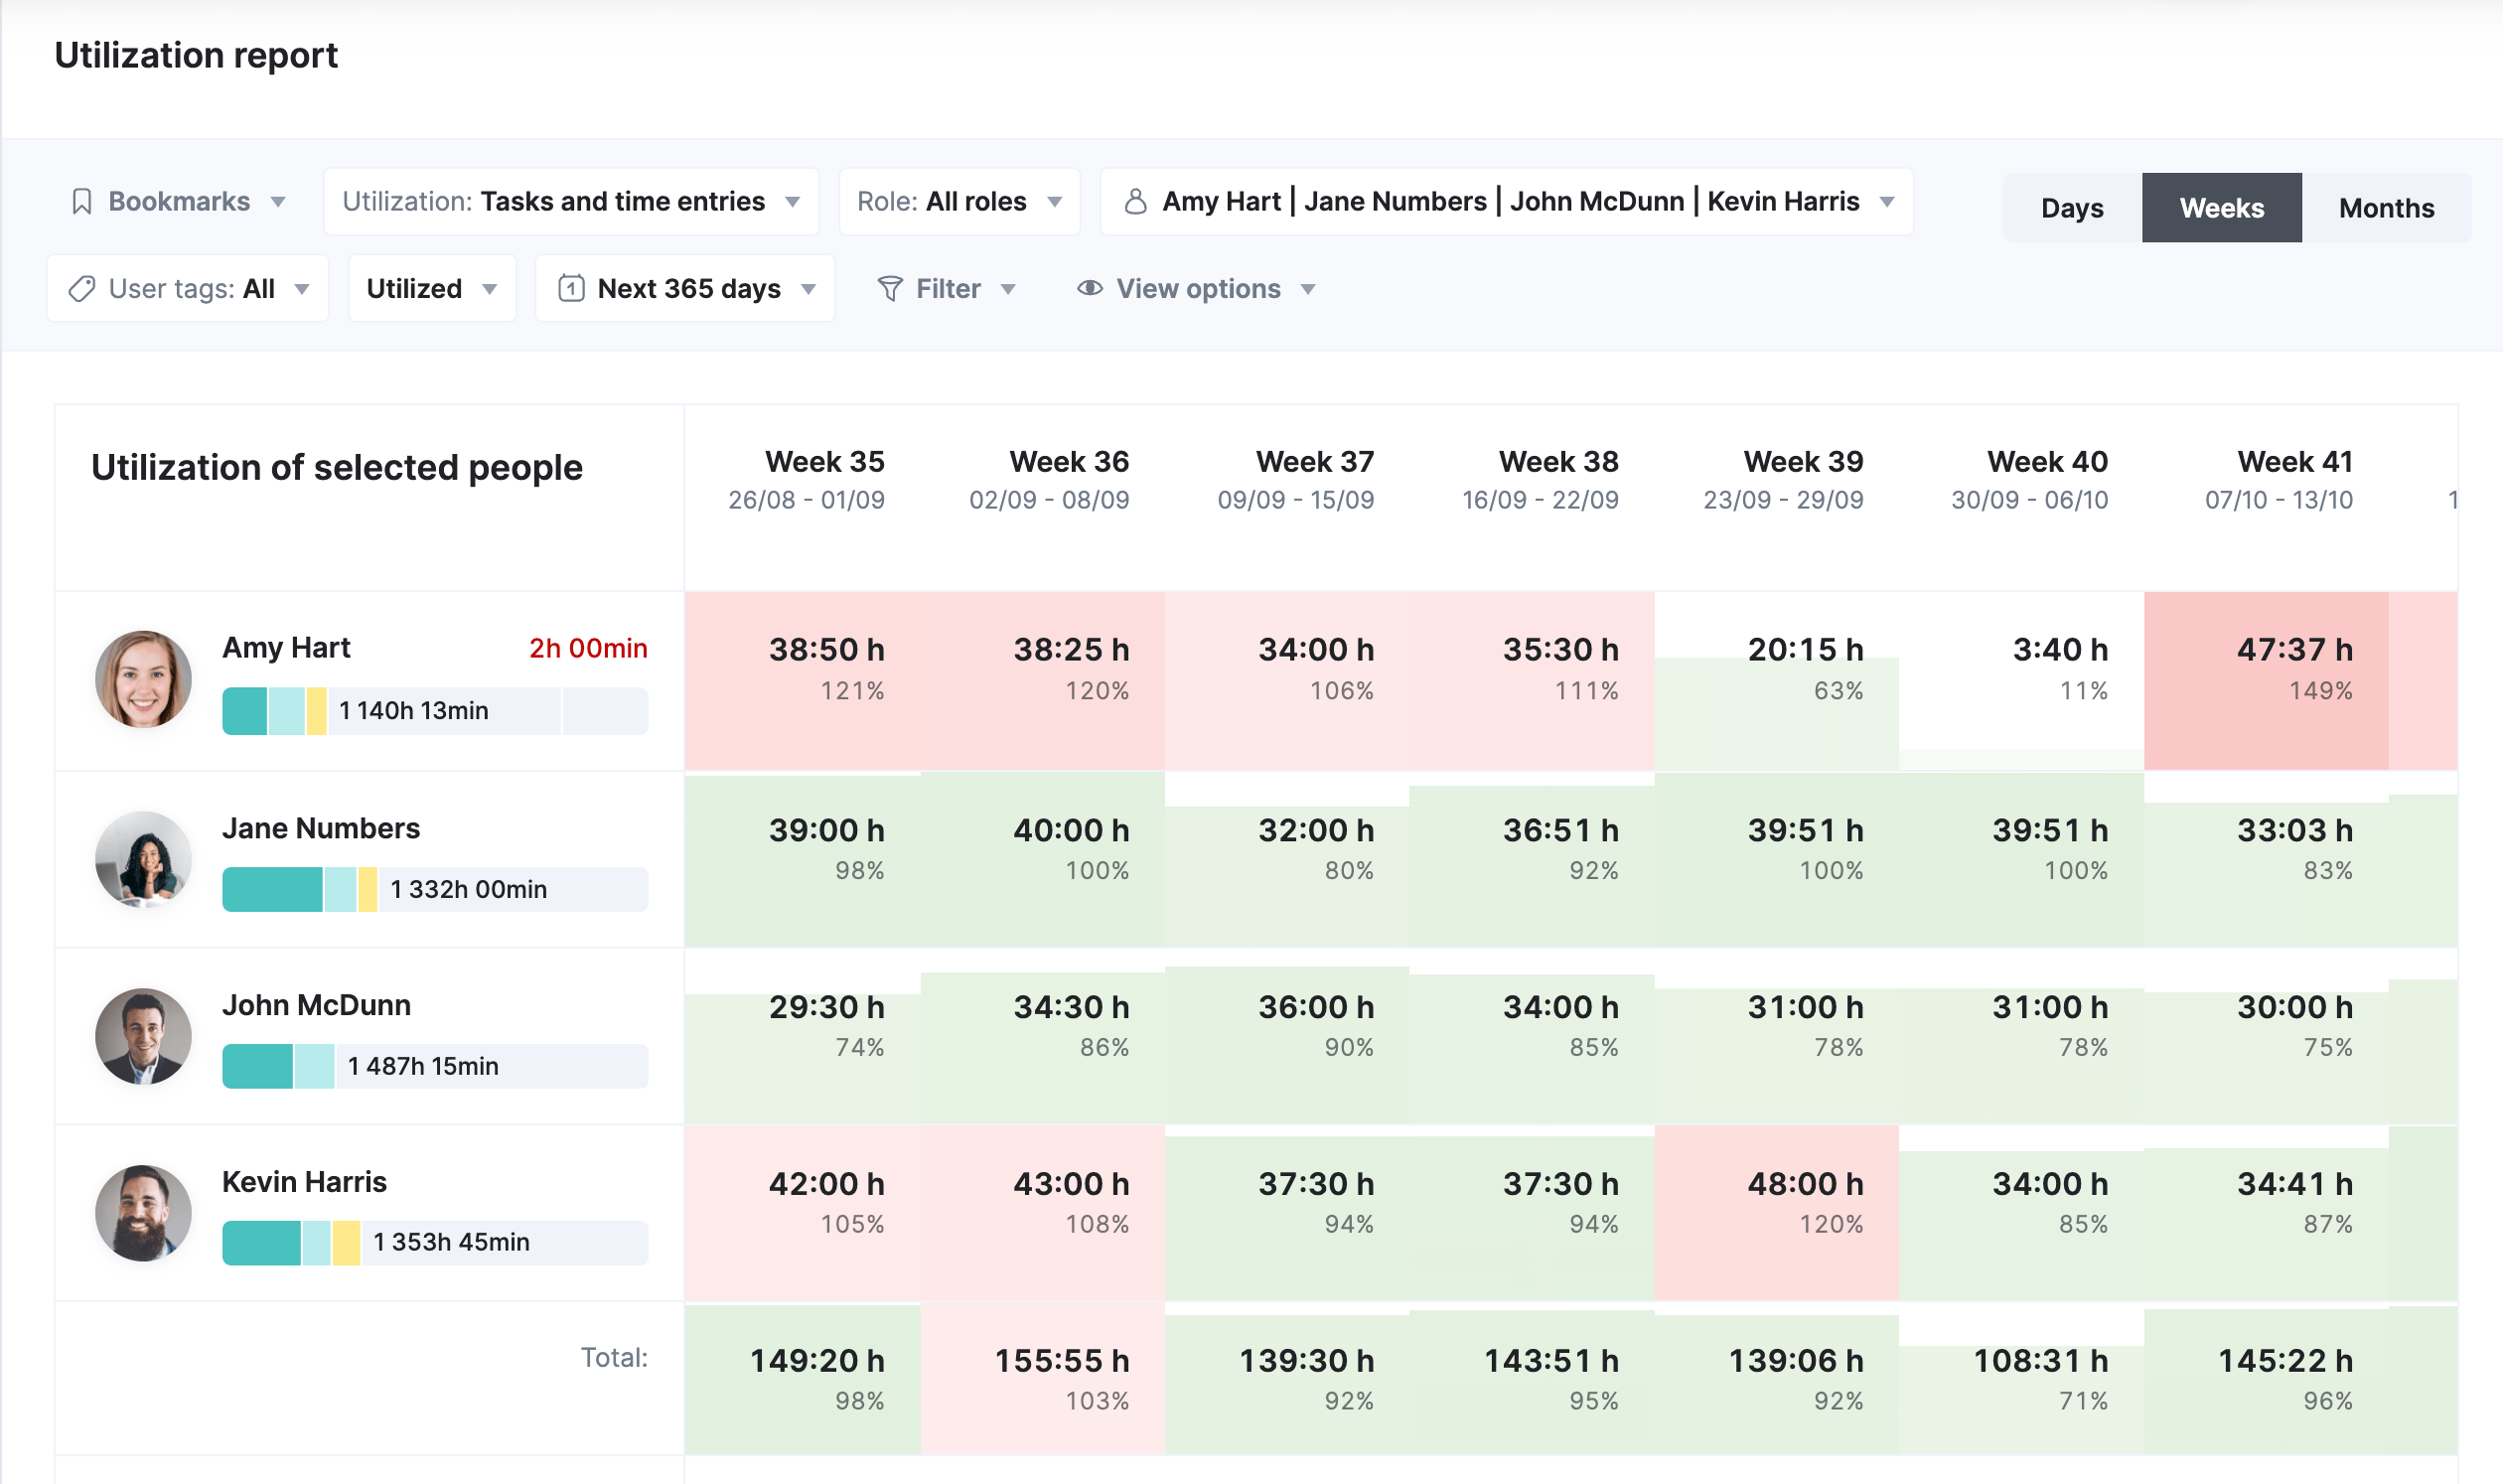
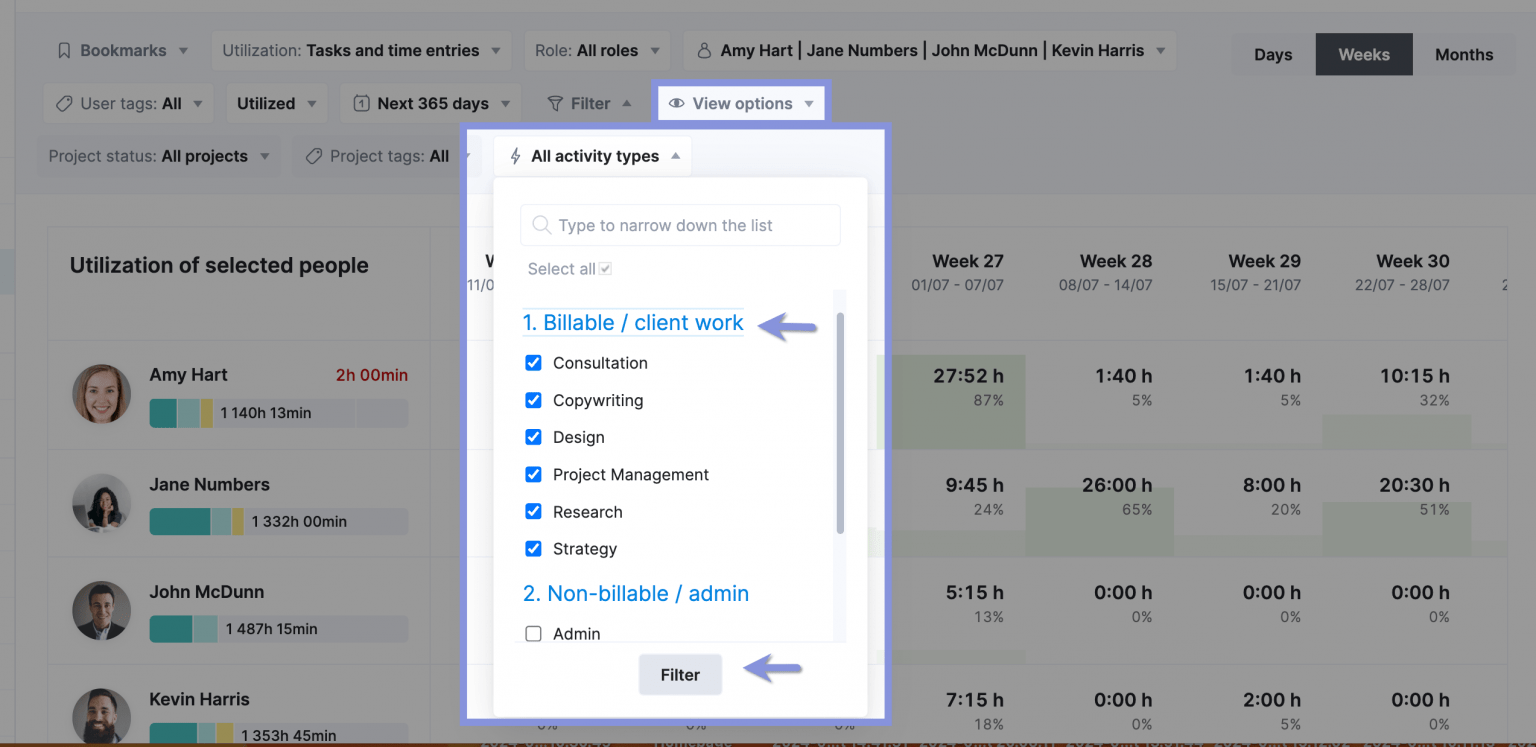
Scoro’s utilization report gives you a real-time view of both billable utilization (time directly generating client revenue) and resource utilization (all assigned hours, including internal work).
Each cell’s color shows how much of a person’s capacity is used:
- White (or empty): Indicates unused capacity—hours still available for assignment
- Green (filled): Shows billable or scheduled time that stays within that person’s capacity limit
- Red (filled): Signals over-allocation or backlog (tasks past their deadline), meaning they’ve exceeded capacity
In the drop-down menu next to “Activity types,” choose “Billable / client work.”
This will automatically select all activity types classified as billable. Click the “Filter” button to apply the selected filter.
Top Tip
Before using the utilization report, define your billable activity types. This ensures Scoro correctly flags billable vs. non-billable hours for accurate utilization tracking.
How do you increase billable utilization?
Start with these high-impact changes:
- Sell work that fits current capacity: Align your pipeline with who’s available. If your designers have bandwidth, sell more design work—not dev projects that overload an already busy team.
- Cut down non-billable time: Audit internal meetings and admin work. Use Scoro’s Non-Billable report to identify tasks that aren’t generating revenue and eliminate or streamline them.
At Ad Esse Consulting, Scoro helped each team member cut about 15 minutes of admin work per day—freeing up over 10 hours a week—while the Finance Manager now saves 5 hours weekly on invoicing and the directors save 3 hours weekly on reporting.
“Our Finance Manager feels much more involved. We’ve implemented notifications that alert her whenever new projects are initiated, serving as her cue to issue invoices. This has greatly streamlined and automated our invoicing process.”
4. Revenue per employee
Revenue per employee (RPE) measures how efficiently your team turns time into revenue.
If billable utilization tells you how much of your team’s time is spent on client work, RPE tells you how much that time is worth.
It’s one of the simplest ways to track overall productivity across your agency.
It’s calculated as:
RPE = Net Revenue (AGI) ÷ FTE (Full-Time Equivalents)
This metric helps you understand your agency’s staffing in relation to how much work is getting delivered.
What RPE to aim for:
A general agency benchmark is $150K–$200K AGI per FTE.
But this depends on:
- Your service model (project vs. retainer)
- Overhead structure
- Profit goals
- Regional salary benchmarks
A better way to set your own target is to work backward from your margin goals:
Required RPE = Average Salary ÷ (1 – Overhead % – Profit Margin %)
Example:
Average salary = $75,000
Overhead = 25%
Profit goal = 25%
→ $75,000 ÷ (1 – 0.25 – 0.25) = $150,000
So each team member needs to bring in $150K in AGI to hit target margins.
After calculating your target RPE, compare your actual RPE to see where you stand:
| Scenario | What it means | Why it matters |
|---|---|---|
| High utilization, low RPE | You’re billing lots of hours, but not earning enough for them. | If utilization is high but revenue per employee is low, you’re likely underpricing your services and working hard without generating enough revenue, which hurts overall profitability. |
| Low utilization, low RPE | Your team isn’t doing enough billable work and the work you are doing isn’t priced high enough. | When both utilization and revenue per employee are low, you’re overstaffed and undercharging. This double hit leads to weak margins and wasted capacity. |
| High utilization, high RPE | Your team is efficient and revenue per head is strong. | High utilization combined with strong revenue per employee indicates healthy performance, but you still need to watch for burnout and delivery risks if the team remains stretched too thin. |
And how do you improve RPE?
Try the following approaches:
- Delay hiring until it’s justified: Only add team members once your confirmed and forecasted income can cover their fully loaded cost—otherwise each new hire dilutes your per-head average.
- Improve billable utilization: Try to increase the percentage of time your team spends on client work. Use utilization reports to spot idle capacity and reassign time to client projects.
- Focus on high-margin clients: Start by identifying which existing clients or project types deliver the best profit percentage. Use Scoro’s profitability or client profitability reports to see which accounts consistently exceed your target margins.
Listen to our podcast episode with Freia Muehlenbein, where she breaks down qualifying leads, planning war-room sessions, and crafting ROI-driven proposals that will help you close the most profitable deals.
Further reading: How to Pitch a Client: A Strategic Framework for Agencies
Returns: Are you making money on the work you deliver?
These metrics show whether your agency is financially healthy. You’re not just working hard.
5. Average billable rate (ABR)
Your average billable rate (ABR) shows how much revenue you earn for every billable hour of client work.
It’s calculated as:
ABR = Total revenue (excluding pass-through costs) ÷ Total delivery hours
This metric reveals whether you’re:
- Protecting your margins
- Using your team’s time efficiently
- Charging enough to cover your labor costs and protect margins
Your ABR should always be higher than your internal cost per hour (i.e., your team’s labor rate) to maintain a healthy margin.
If ABR falls below that rate, you’re losing money on every billable hour.
Even smaller drops above your labor cost can erode your margins quickly.
Here’s how it plays out:
- Scenario: ABR just above labor cost → You’re barely breaking even. Any slight decrease in rates or efficiency will wipe out your margin.
- Scenario: ABR well above labor cost → You maintain a healthy buffer to cover overhead, invest in growth, and withstand pricing pressure.
By keeping ABR comfortably higher than your internal cost per hour, you ensure each hour billed contributes positively to your bottom line.
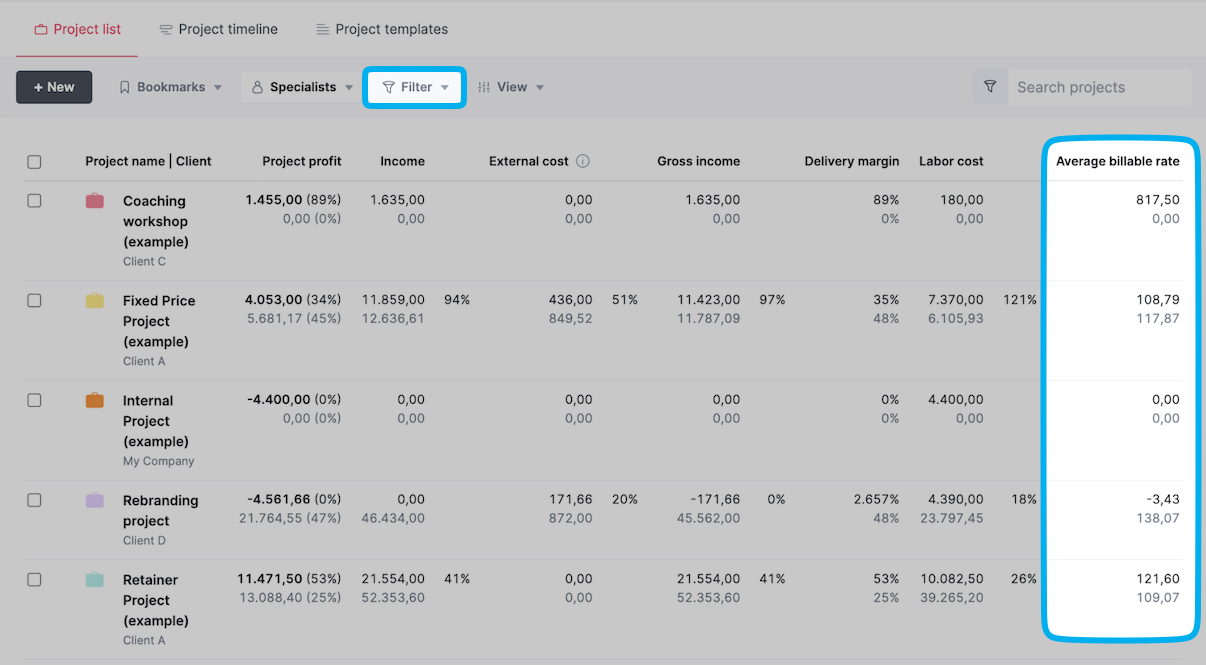
Use the “Project list” view in Scoro and make sure the ABR column is visible. Then filter by completed projects to see which ones met or missed your target ABR.
Improving your ABR isn’t just about charging more. It’s about earning more for the time your team puts in.
Here are some ways to do it:
- Streamline delivery: Try to reduce the number of hours it takes to complete a project by using SOPs, templates, and automation.
- Scope smarter: Build more accurate project estimates upfront to avoid underquoting and scope creep.
- Track costs closely: Monitor delivery hours and project expenses in real time to stay within budget and course-correct early
- Staff strategically: Allocate work to team members with lower labor rates where possible (without sacrificing quality)
- Raise rates (strategically): Increase your prices for underpriced services or legacy retainers. But only once you document and standardize your core delivery processes.
6. Delivery margin
Delivery margin shows how much profit is left after covering direct delivery costs.
Things like your team’s salaries, freelancer fees, subcontractor bills, and any project-specific expenses.
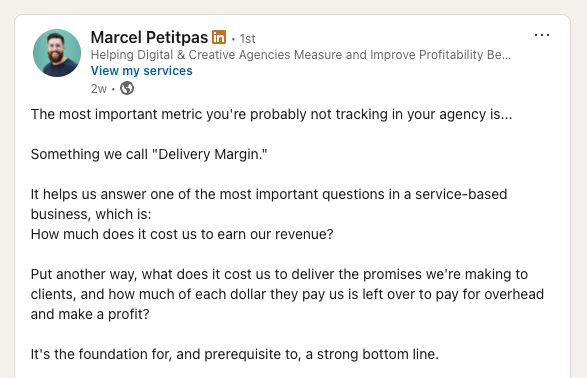
As Marcel Peptitpas—a digital agency profitability expert—explains in the post below, your delivery margin answers two of the most important questions in any service business:
Why delivery margin beats net profit (per project)?
Trying to calculate net profit per project can lead you down a rabbit hole. It’s messy, time-consuming, and often misleading.Net profit includes too many indirect variables (like overhead and utilization) that skew the real picture.Instead, focus on delivery margin.
The difference between what you earn and what it costs to deliver the work.
“Net profit per project is a precision trap. Delivery margin is what actually tells you if your work is profitable.” —Marcel Petitpas
Even if your agency is profitable overall, you might be losing money on individual projects.
For example:
- Project revenue: $60,000
- Delivery costs (labor + expenses): $30,000
- Delivery margin: $60,000–$30,000\$60,000 – \$30,000$60,000–$30,000 ÷ $60,000 = 50%
In this case, you’re keeping half of every dollar earned to cover overhead and profit.
If delivery costs rise—say to $36,000—your delivery margin would drop to ( $60,000 – $36,000 ) ÷ $60,000 = 40%, signaling potential underpricing or over-servicing.
A healthy delivery margin is typically 40–60%. Below 40%, you’re likely underpricing, over-servicing, or both.
By checking every project this way, you can quickly spot underperformers before they drag down your profitability.
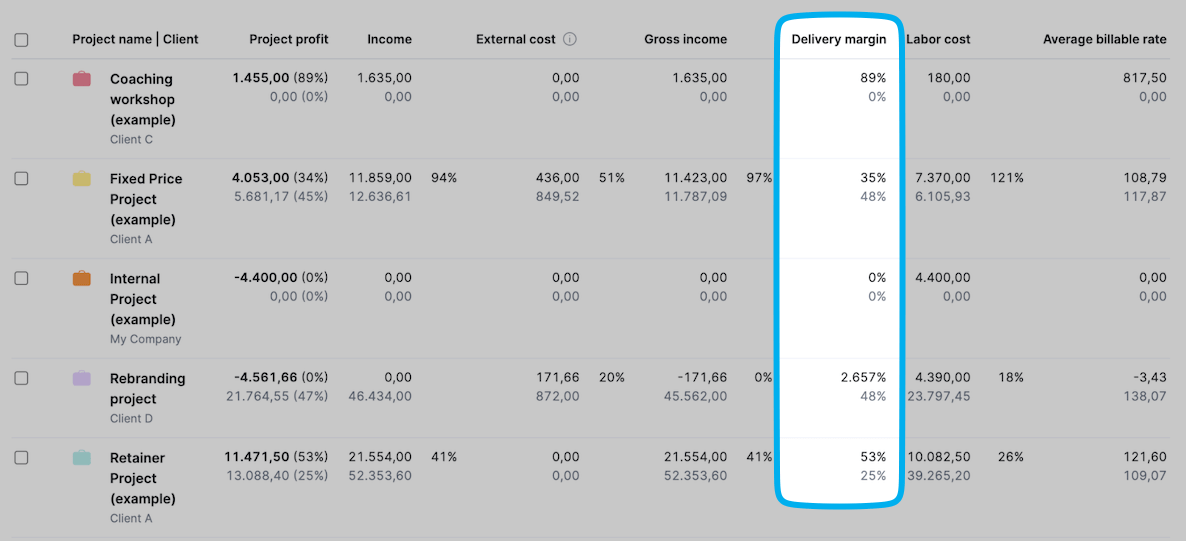
Again, the project list view can show you all of this in one place. Filter by completed projects to quickly spot where things went wrong.
If your margins are falling short, it’s usually a sign that something’s broken in how you price, plan, or deliver your projects.
Here’s how to turn it around:
- Increase your ABR so it stays above delivery costs. raise rates on underpriced work and improve efficiency (see earlier tips on utilization and high-margin clients).
- Lower your average cost per hour (ACPH) by assigning routine or straightforward tasks to junior team members (who cost less per hour) and reserve senior staff for the complex, high-value work that justifies their higher rate.
- Improve scoping by defining clear deliverables and building in buffers for change requests, so you prevent unbilled work from inflating costs and eroding your delivery margins.
- Monitor delivery costs as they accrue with live budget and time-tracking, so you can course-correct early and prevent overruns from eating into profit.
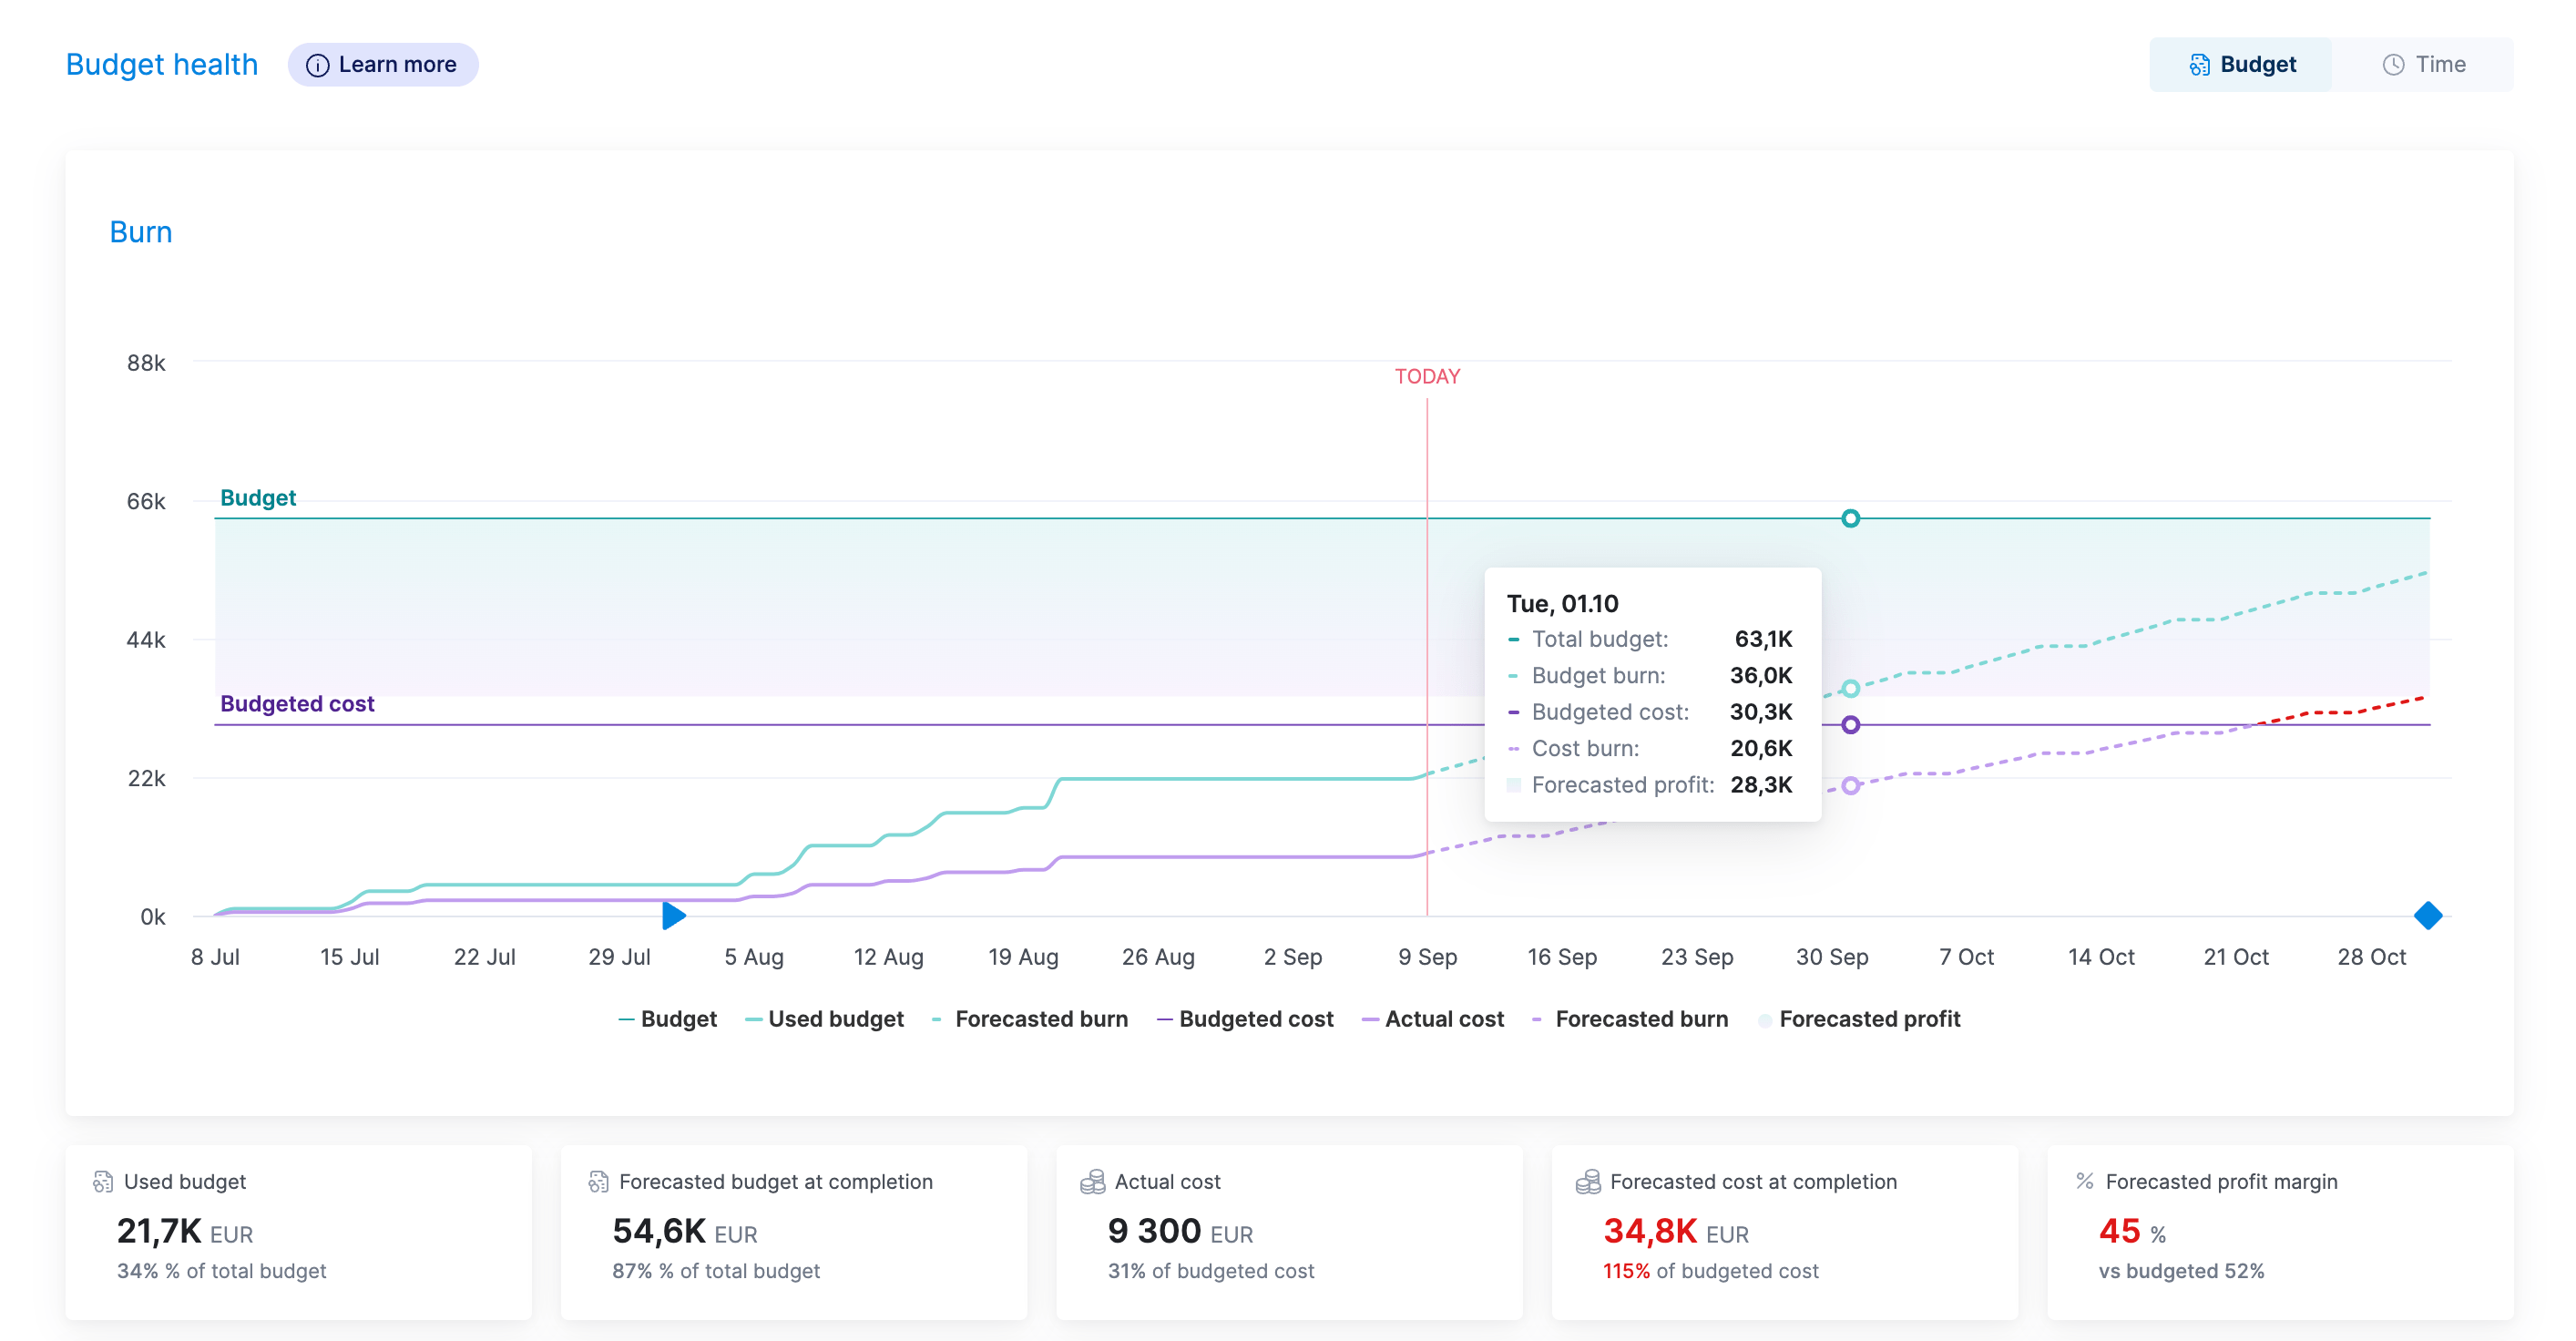
Once your team tracks their time in Scoro, you can keep an eye on forecasted costs using Scoro’s “Budget health” chart.
It displays a dotted cost-burn line projecting your remaining in-house and outsourced expenses so you can spot potential overruns before they happen.
Exposure: Are you managing hidden risks?
These are your agency’s early warning signals. They don’t always shout, but when they shift, they deserve your attention.
7. Client concentration
Client concentration tracks how much of your average gross income (AGI) depends on your biggest client.
No single client should drive more than 25% of your AGI.
Why?
Because if that client is late on paying or churns, your AGI will plummet. And you’ll have to scramble to recoup the losses or face tough cuts, layoffs, or closure altogether.
Reduce the risk by:
- Expand other accounts: Cross-sell or upsell existing clients to balance your revenue mix
- Convert projects to retainers: Try to convert one-offs into retainers by offering a post-project support package. Bundle routine services (like monthly check-ins or minor updates) into a flat-fee ongoing agreement to create predictable, recurring revenue.
- Deliberately reduce dependency: Make client diversification a goal, not a side effect. Proactively pursue smaller, high-margin clients to spread risk and protect cash flow.
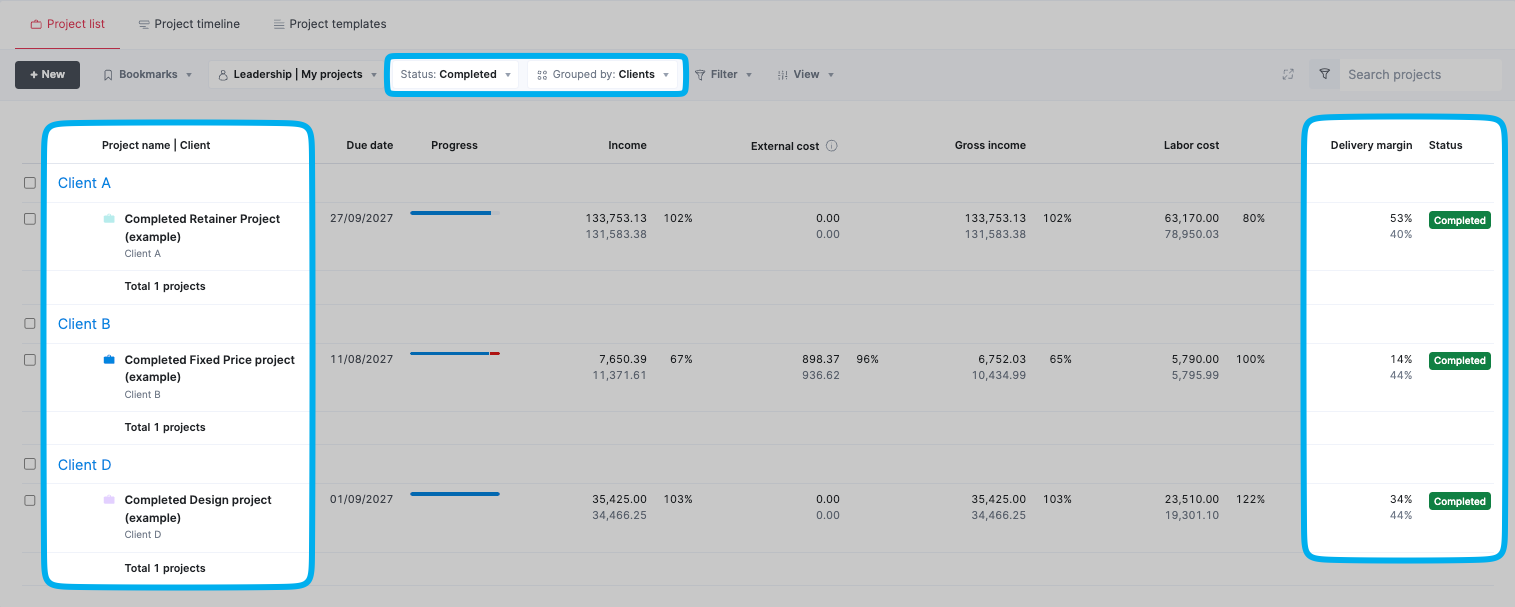
Using the “Project list” view you can filter for “Completed” projects and group by “Client” to spot which accounts deliver the strongest delivery margins.
Then use that insight to guide your cross-sell, retainer, and diversification efforts.
8. Days to payment
Your days to payment just means the average length of time it takes to get paid after sending an invoice.
Even profitable agencies can run into serious cash flow issues if payments are late. You can’t pay salaries, fund projects, or invest in growth with money that hasn’t hit your account.
What to aim for:
- Under 45 days is healthy
- Over 60 days is a warning sign
- Over 90 days means your cash flow is likely under pressure
For example, if you invoice $50,000 this month but don’t get paid for 75 days, you may need to dip into savings or delay expenses just to make payroll.
That’s not sustainable. Especially if it happens across multiple clients.
How to get a handle on outstanding invoices:
- Set clear payment terms upfront: State your terms clearly on every quote and invoice (e.g. “Net 14” or “Due on receipt”)
- Require deposits or upfront payments: For new clients or large projects, request 25–50% right away
- Offer early payment incentives: A small discount (e.g., 2% if paid within 7 days) encourages prompt payment. Especially for large invoices. But you’re trading off a bit of margin to gain faster cash flow and reduce the risk of late payments.
- Add late fees (and stick to them): Include a clear late fee policy in your contract (e.g., “1.5% per month on overdue balances”)
- Auto-charge retainers: For recurring clients, require a card on file and auto-invoice monthly through Stripe or other integrations
- Automate reminders: Use a tool like Scoro to send reminders. Send reminders before, on, and after the due date.