













Most firms know they’re paying for tools they don’t fully use. What they don’t know is how to fix it.
That’s why we created the Tech Stack Audit Workbook. It includes:
- A subscription log: Document every tool you’re paying for
- A “shadow stack” survey: A ready-to-send message for your team, plus a log for their answers, to find out which tools people actually use (including the unsanctioned ones)
- A workflow map with gap scoring: Identify the biggest problems with your tech and related processes (e.g., invoicing, project planning)
It also generates a leadership summary that suggests next steps based on the info you enter.
Best of all, the audit only takes about 90 minutes to finish.
Let’s walk through it.
Step 1: Fill out the subscription log
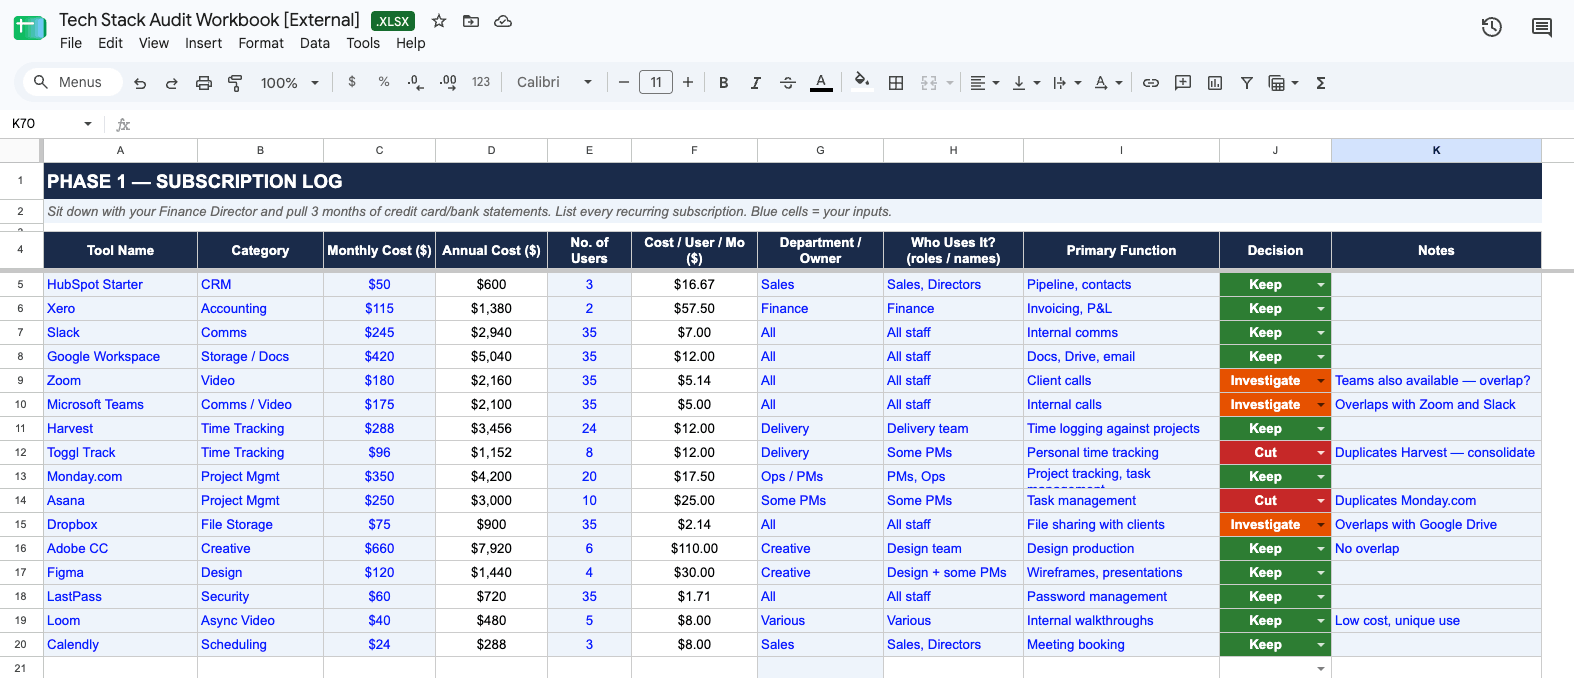
First, list every software subscription your firm pays for in the “Subscription Log” tab. Most firms have never seen every tool, its cost, and its users in one list, because subscriptions get added by different teams on different cards. Until it’s all in one place, you can’t spot duplicates or see what you’re really spending.
Start with the last three months of bank and credit card statements. Unless you work in finance, you probably won’t have access to these, so book 30 minutes with your Finance Director and go through them together. Ask about annual contracts too, since they won’t show up in a three-month window.
For every tool, fill in the:
- Tool Name (e.g., HubSpot Starter)
- Category (e.g., CRM)
- Monthly Cost (e.g., $50)
- No. of Users (e.g., 3)
- Department/Owner (e.g., Sales)
- Who Uses It (e.g., Sales, Directors)
- Primary Function (e.g., Pipeline, contacts)
The “Annual Cost” and “Cost/User/Mo” columns fill in automatically from what you enter.
Leave the “Decision” column blank for now.
Step 2: Surface your “shadow” stack
Just because you pay for a bunch of different tools doesn’t mean your team actually uses them all.
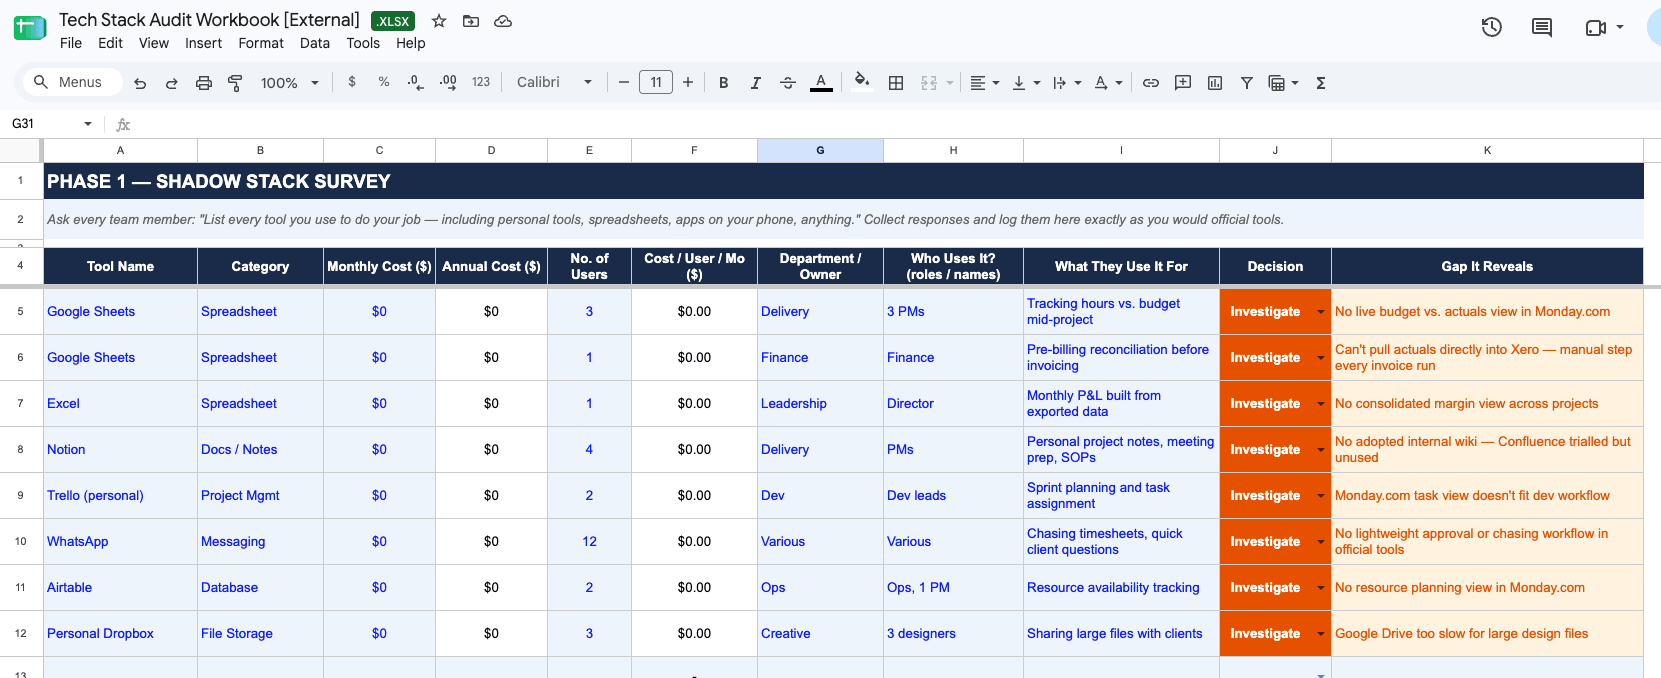
The workbook includes a short survey message you can paste into Slack, email, or a Google Form. You’ll find it at the bottom of the “Shadow Stack Log” tab. Send it to your team members (or team leads) a few days before you run the audit:
| Hi team, I’m doing a quick audit of the tools we use across the business. It won’t take more than 2 minutes. Please list every tool you personally use to do your job. Include anything: a personal spreadsheet, a Notion page you set up yourself, a WhatsApp group, an app on your phone. If it helps you do your work, I want to know about it. For each tool, tell me: – Tool name – What you use it for – Is there an official company tool you’re supposed to use instead? If yes, which one? |
As responses come in, log each tool in the “Shadow Stack Log” tab. It uses the same columns as the Subscription Log, with two differences: “Primary Function” becomes “What They Use It For,” and “Notes” becomes “Gap It Reveals,” which you fill in later.
Once responses are in, delete the tools that already appear in your Subscription Log. Whatever’s left is your “shadow” stack: the tools people use that the firm doesn’t officially pay for or sanction.
Then fill in the “Gap It Reveals” column for each shadow tool. Start with the “What They Use It For” answers. If an answer is vague (“project planning”), go back to that person or their lead and ask what the official tool can’t do. For example, why they’re planning in Google Sheets when you pay for Monday.
The answer is your gap. For example, project managers using Google Sheets because there’s no live budget vs. actuals view in Monday. Or finance using a manual Excel export because they can’t pull actuals directly into Xero.
Step 3: Map where your tech breaks down across your project workflow
Now that you’ve gathered all your tools, it’s time to evaluate how well they work. Partner with a PM and someone from finance to fill out the “Workflow Map” tab.
It walks you through your project lifecycle stage by stage:
Sale → Estimating → Planning → Delivery → Billing → Reporting
At each stage, you’ll note where your software causes problems, like manual steps or data being typed in twice.
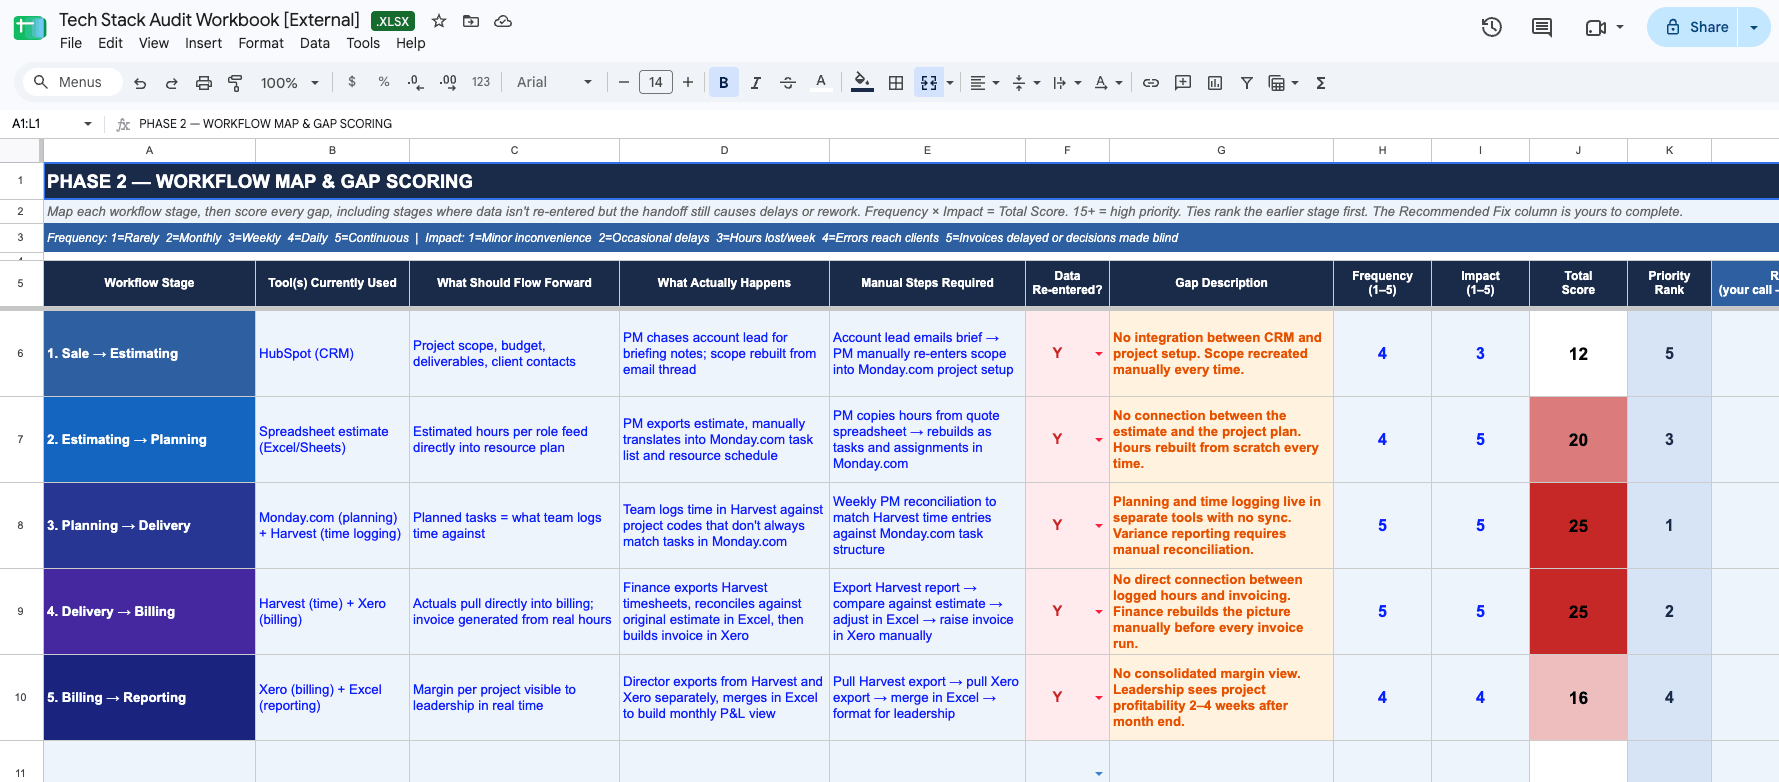
Here’s what a filled-in row looks like:
| Column | Example |
|---|---|
| Workflow Stage | Sale → Estimating |
| Tool(s) Currently Used | HubSpot (CRM) |
| What Should Flow Forward | Project scope, budget, deliverables, client contacts |
| What Actually Happens | PM chases account lead for briefing notes; scope rebuilt from email thread |
| Manual Steps Required | Account lead emails brief → PM manually re-enters scope into Monday.com project setup |
| Data Re-entered? | Y |
| Gap Description | No integration between CRM and project setup. Scope recreated manually every time. |
A quick note: whatever you enter for your top-scoring gap in “Gap Description” appears in your Leadership Summary, so be as specific as possible.
As you review workflows, focus on these common pain points:
- Sale → Estimating: Does the project scope from the proposal (deliverables, budget, contacts) carry over automatically? Or does someone have to rebuild it from an email thread every time a deal closes?
- Estimating → Planning: Do estimated hours automatically become a project plan and resource schedule? Or does a PM manually translate a quote into tasks in a separate tool?
- Planning → Delivery: Can people log time to specific tasks in one tool? Or do timesheets and tasks live in separate systems?
- Delivery → Billing: Can finance pull actuals to automatically create an invoice? Or does someone export timesheets, reconcile against the estimate in a spreadsheet, and then build the invoice?
- Billing → Reporting: Can leadership automatically see margins per project? Or do they have to dig through outdated spreadsheets or manual reports?
Further listening: Why your tools aren’t talking & what it’s costing you
Step 4: Score each gap on frequency and impact
Now that you know where your tech workflows break down, it’s time to rank those gaps in the “Frequency” and “Impact” columns.
A manual step that happens once a quarter is annoying. But one that happens daily across every project is where you’re losing money.
With clear scores, you have a ranked list you can put in front of leadership to decide on priorities objectively.
Score every row where you wrote a “Gap Description,” not only the rows marked “Y” for data re-entry. Re-entry is the most common symptom, but it isn’t the only one. A handoff can be a mess without anyone retyping data: people chasing approvals on WhatsApp, a PM waiting days for a brief, or a report nobody trusts. If a stage causes delays or rework, describe it and score it.
Only leave the scores blank when a stage genuinely runs clean. That’s useful too, because it narrows the problem to where the gaps cluster.
Use this scale:
| Score | Frequency | Impact |
|---|---|---|
| 1 | Rarely — once a quarter | Minor inconvenience, 15 min lost |
| 2 | Monthly — billing or reporting cycles | Occasional delays, some manual catch-up |
| 3 | Weekly — part of regular workflow | Hours lost per week, regular rework |
| 4 | Daily — affects most project activity | Errors reach clients or cause visible delays |
| 5 | Continuous — every project, every day | Invoices delayed or decisions made blind |
The “Total Score” column multiplies Frequency by Impact automatically (maximum 25). Anything scoring 15 or above is a high-priority gap.
When you’re done, look at the “Priority Rank” column. Rank 1 is your most urgent gap. If two gaps tie, the workbook ranks the one earlier in your project lifecycle higher, since fixing it means cleaner data for every stage after it.
Step 5: Decide which tools to cut, investigate, or keep
Now you’ve got the full picture: what you’re paying for, what people actually use, and where your tools fall short. It’s time to make decisions.
Go back to the “Subscription Log” tab and work through each tool using the “Decision” dropdown. Use these signals to guide you:
| Signal | Decision |
|---|---|
| Two tools in the same category, one has more active users. The other is redundant. | Cut |
| You pay for 20 seats, but the survey shows three people use it | Cut |
| Nobody in the survey mentioned this tool at all | Cut |
| A shadow tool covers the same function as an official tool, both have active users, and you need to decide which stays | Investigate |
| The tool is linked to a gap scoring 15+ in your Workflow Map. Either it can’t do the job, or it can and just isn’t configured to. | Investigate |
| You’re paying for a plan with more features than your team uses. A cheaper tier might cover what you need. | Investigate |
| The only tool handling its workflow stage, actively used, with no shadow tools competing and no high-scoring gaps | Keep |
Use the “Notes” column to record why, like “Duplicates Harvest, so we can consolidate.”
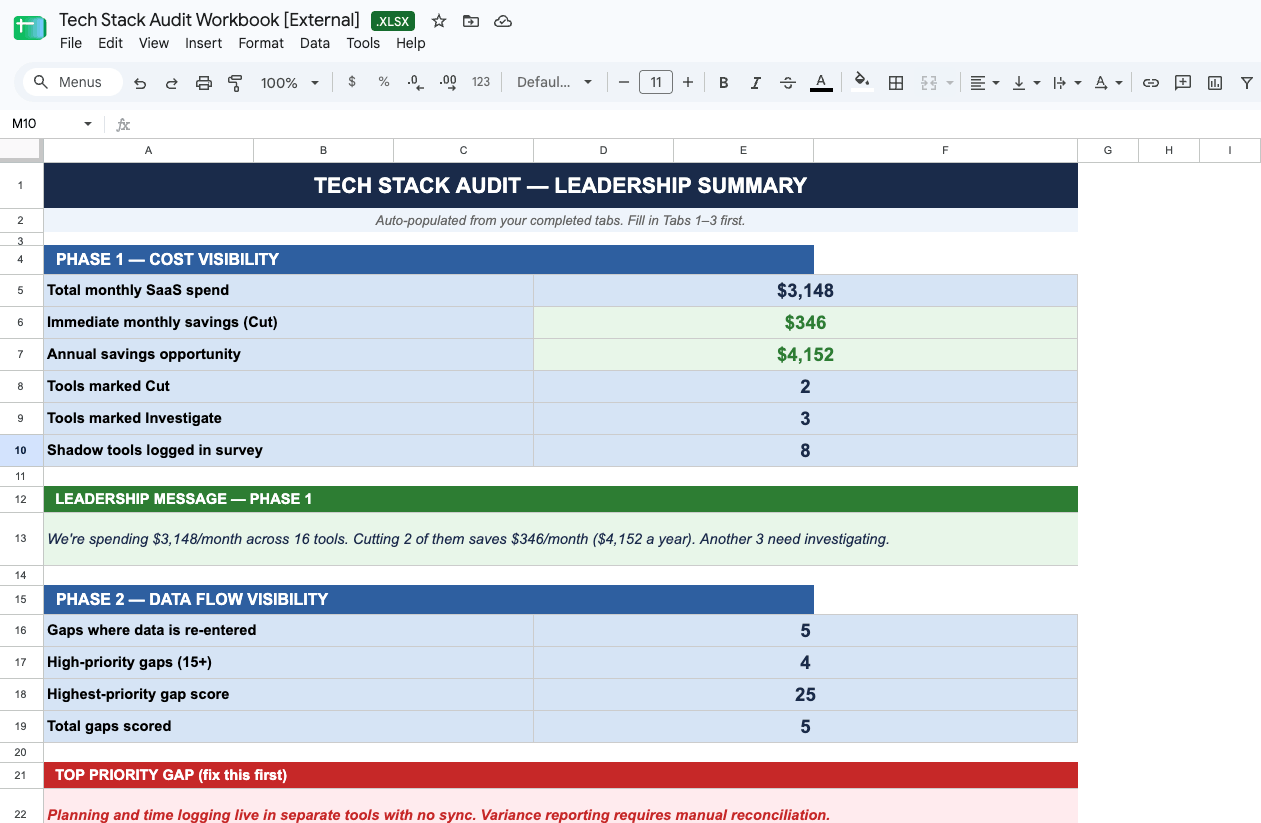
Once you’ve tagged everything, open the “Leadership Summary” tab. It shows your:
- Total monthly SaaS spend
- Savings from tools marked “Cut” (monthly and annually)
- Number of tools marked “Cut” and “Investigate”
- Number of shadow tools logged in the survey
- Top-priority gap from your Workflow Map
It also writes a ready-made leadership message from your data: “We’re spending $[X]/month across [Y] tools. Cutting [Z] of them saves [A]/month([B] a year). Another [C] need investigating.”
Agree the decisions with leadership
Your tags are a recommendation, not a final call. Before you cancel anything, take the Leadership Summary to your directors, your Finance Director, and the heads of any team that owns a tool you’ve tagged.
Walk them through the spend, the savings, the shadow tools, and your top-ranked gap. Then agree each “Cut” and “Investigate” decision together, and name an owner for each one. That way, nobody’s surprised when a tool disappears, and the fixes have someone accountable for them.
Keep: no action needed
These tools are doing their job. Leave them alone and check them again at your next audit.
Cut: retire tools without leaving your team stranded
Cutting is your fast win, but don’t just cancel with no warning. Someone relies on every tool on that list, even the redundant ones. For each tool you’re cutting:
- Check the contract. Find the renewal date and notice period. If it’s an annual plan, time the cancellation to the renewal so you don’t pay for months you can’t use.
- Tell the people who use it. Explain why it’s going, what replaces it, and the date it switches off. Give them at least two weeks.
- Move what matters. Export any data, files, or history worth keeping, and move live work into the tool that stays (e.g., time entries from Toggl into Harvest).
- Show them the replacement. A 15-minute walkthrough of how to do their job in the remaining tool prevents most complaints.
- Switch it off. Cancel the subscription, remove access, and update the Subscription Log.
Aim to have every “Cut” tool cancelled within one billing cycle.
Investigate: fix what you have before buying anything new
Start with your highest-ranked gap in the Workflow Map. Assign an owner, set a 30-day deadline, and note the baseline before you start (e.g., hours spent on each invoice run). The before-and-after is what makes the case for fixing the next one.
First, check with the team. Sometimes the person who logged the shadow tool just didn’t know the feature existed.
If the gap is real, search your provider’s help center for the specific feature the shadow tool is covering. If the capability exists, the fix is usually a setup or training issue.
If the help center comes up blank, contact support. As Ryan Piercy, founder of Digital Transformers, puts it:
“The number one thing that businesses don’t do is really hone in to maximise the software they’ve got. They tend to go, ‘This isn’t working for me, I’m going to jump ship’ rather than, ‘What can I do to change it?'”
If support confirms the feature genuinely isn’t there, the next step depends on how many gaps you have and where they sit:
| Where your gaps are | What it means | What to do |
|---|---|---|
| One high-scoring gap, at any stage (including the connection to your CRM or accounting software) | A single handoff is broken, but the rest of your workflow holds | Fix that one integration. Check each tool’s integration marketplace for a native connection first, then an automation tool like Zapier. |
| High-scoring gaps across two or more core stages: Estimating → Planning, Planning → Delivery, Delivery → Billing | Resourcing, time tracking, and margin visibility are all disconnected | Start evaluating a PSA (see below). |
Why individual integration’s break down across the core
The temptation is to fix each gap on its own. But the core stages all run on the same data. Estimated hours become the project plan. The plan becomes the tasks people log time against. Logged time becomes the invoice.
When something changes (scope grows, a deadline moves, someone gets reassigned), that change has to travel through every connection. Each integration only knows about its own handoff. So when one breaks, the others keep running on outdated data, and nobody notices until an invoice or margin report comes out wrong.
As Ryan Pearcy puts it:
Businesses pick problems in silos and fix them one at a time. But all you end up with is a stack of systems that don’t talk to each other and don’t give you clear visibility of the business.

That’s when it’s time to look at a professional services automation (PSA) tool: a platform built to run estimating, resource planning, time tracking, and billing as one connected workflow.
A PSA doesn’t replace the specialist tools at the edges. Your CRM still handles sales, and your accounting software still handles finance. The PSA holds the operational core together in the middle.
To start evaluating options:
- Use your Workflow Map as your requirements list. Every high-scoring gap is something the platform has to solve.
- Shortlist two or three PSAs that cover estimating, resourcing, time tracking, and billing, and that integrate with the CRM and accounting tools you’re keeping.
- Ask each vendor to demo your top-ranked gaps using an example from your own workflow, not their standard demo.
That’s what ITCH, a 70-person creative agency in London, did. They ran projects in Monday.com, time tracking in Harvest, and reporting in Google Sheets: the same stack as our example workbook. Time entries weren’t linked to quotes, project status didn’t feed into invoicing, and leaders spent hours pulling together reports that were out of date by the time they were ready.
After moving to Scoro, ITCH replaced Monday.com and Harvest, retired a 13-year-old sales spreadsheet, and kept Xero, which now syncs from Scoro. One person now plans the workload for roughly 50% more people in the same time. As Operations Director Craig Newton puts it, “Now, we just join the meeting and ask: how are we doing?”
Get AI recommendations from your completed workbook
To speed up your research on integration’s and tools, upload your completed workbook to Claude, ChatGPT, or Gemini (make sure the tool you choose can read .xlsx files) and paste in this prompt:
| You are an operations consultant who specializes in professional services tech stacks. I’m uploading a completed tech stack audit workbook for my firm. It contains: – A Subscription Log showing all tools we’re paying for, tagged as Keep, Cut, or Investigate – A Shadow Stack Survey showing tools the team uses that aren’t in our official stack – A Workflow Map showing where our Sale → Estimating → Planning → Delivery → Billing → Reporting workflow breaks down, with each gap scored on Frequency × Impact Based on what you find in the workbook, do the following: Integration check. For each gap in the Workflow Map, research whether a native integration exists between the tools listed. For each one, state what it does, whether it’s likely to close the gap fully, and any limitations. Investigate triage. For any tool I’ve marked “Investigate,” recommend whether to keep, replace, or consolidate it. Check whether a shadow tool is already covering the same function, whether the tool sits at a high-scoring gap in the Workflow Map, and whether the official tool has features that could close the gap if set up properly. PSA assessment. For any gap that scores 15 or above and involves a stage in the operational core (Estimating → Planning, Planning → Delivery, or Delivery → Billing), assess whether individual integrations are likely to hold, or whether a PSA (Professional Services Automation platform) would be a more durable fix. Base your reasoning on what’s in the workbook, not generic advice. Format your response as three clearly labeled sections matching the tasks above. Keep each recommendation to two or three sentences. |
Final thoughts
Ninety minutes ago, “our tools are a mess” was a feeling. Now you have a number for what you spend, a list of tools your team actually relies on, and a ranked view of where your workflow loses time and margin.
That’s what turns a vague complaint into a decision leadership can sign off on. And because the workbook is reusable, run it again in six months to check whether the fixes held and what’s moved up the list.
If you want to go deeper, we’ve written about the most common tech stack mistakes firms make, what PSA software actually does, and how to implement one without disrupting your team.
And if your audit points to the operational core, see how firms like yours made the switch in our customer stories, or book a demo to see how Scoro could work for your firm.