


The Gantt chart is one of the most enduring project management tools in history, owing mainly to its versatility, ease of use, and wide scope of application. In fact, a recent survey reported that for 45% of project team members, it is their most used software feature, while for 22% of respondents in a similar survey, it is the most desired project management tool.
But at the same time, it’s also one of the most ignored project management tools, with 34% of users failing to make use of it, even when it’s included in their project management platform. This suggests that teams simply aren’t realizing the full potential of this handy tool.
In this article, we explore the features of the Gantt chart, as well as three specific use cases in different sectors, illustrating just how versatile it is.
What is a Gantt chart?
Essentially, a Gantt chart is a horizontal bar chart representing a project schedule. The horizontal axis shows time in intervals, while the vertical axis displays the project’s tasks. Each task is depicted as a horizontal bar (usually color-coded), the length of which is the task’s estimated duration. This overview neatly portrays the beginning and end dates of all tasks, plus those of the overall project.
The Gantt chart has retained all of its basic components since its introduction to manufacturing in the 1890s. But thanks to its use in project management, and the switch to digital software, modern-day Gantt charts have accrued an array of additional features. These include the ‘Today’ line, more detailed information in project elements, and discussion threads for team members. To learn more about the history, features and benefits of the Gantt chart, read our article: The Gantt Chart: What is It and Why Does It Matter?
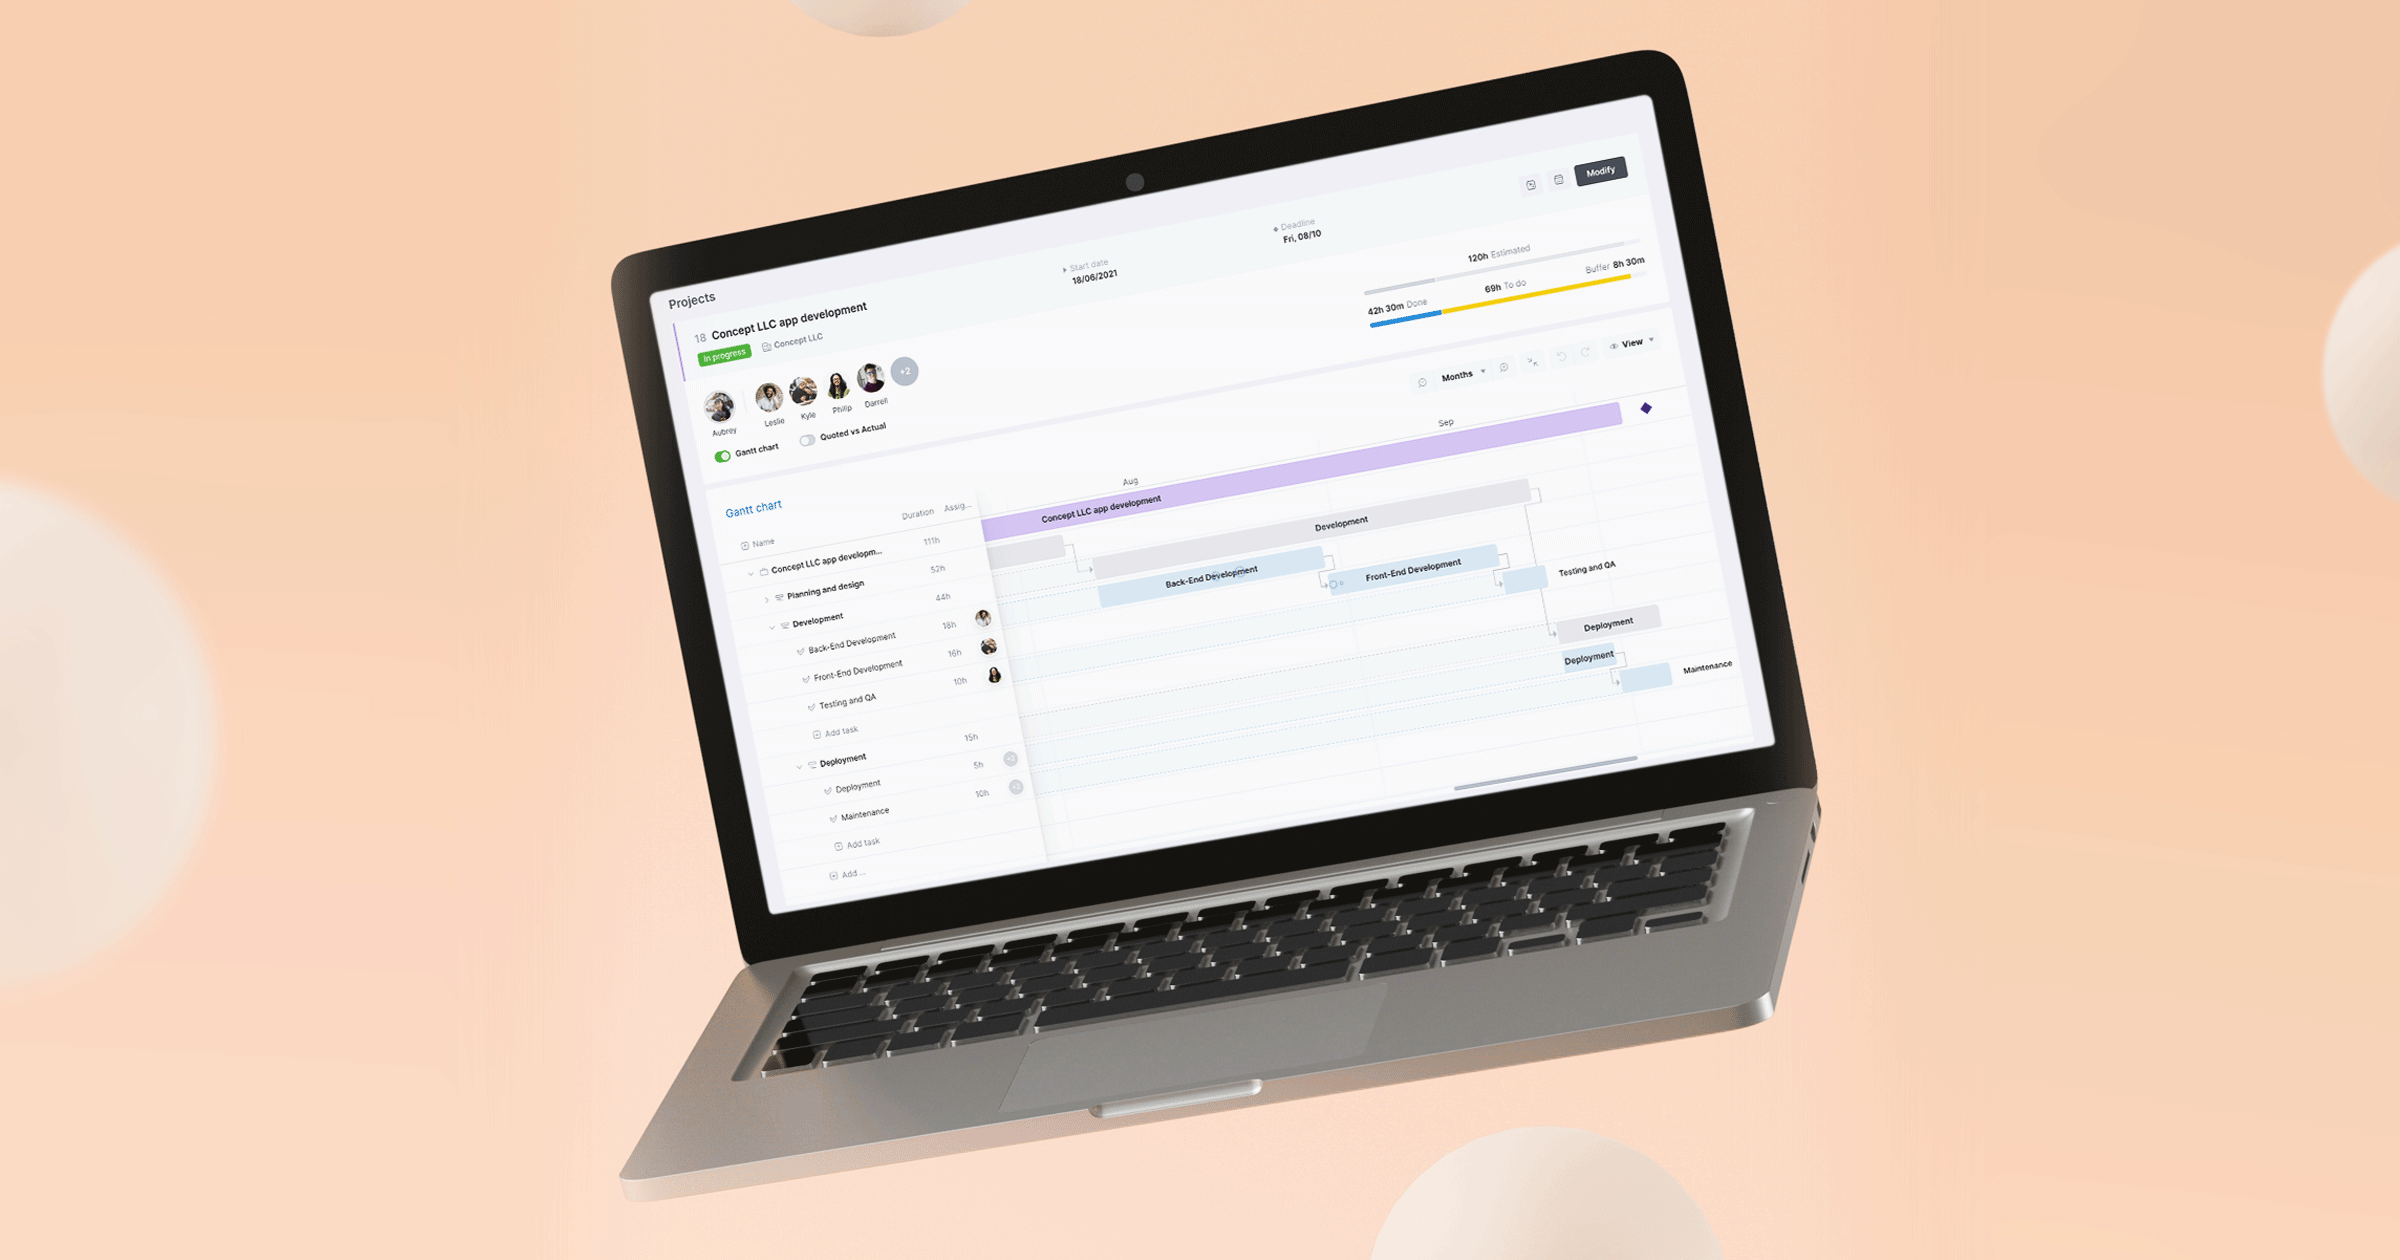
The first real-time Gantt chart from Scoro Software
Gantt chart examples
1. Software development
Most software developers use the Agile method of project management because it makes it easier to create and iterate on a product. However, even if you iterate rapidly, it’s still important to keep the big picture in mind so that the product remains on schedule for a successful delivery. Using a Gantt chart for software development ensures you don’t lose track of important milestones, such as approval dates or launch dates.
Gantt charts also make it easier to communicate progress with stakeholders. While Agile metrics, such as burndown, velocity, and lead time, are useful for your team, management and external stakeholders are usually more concerned about top-level performance metrics, (i.e. that the project is on track according to its timeline). This is automatically portrayed via the Gantt chart and easily shared among teams.
Even Agile projects, which are typically more circular than traditional linear projects, have distinct phases, which can be implemented in a Gantt chart. Software development typically has the following:
- Project management activities
- Initiation/planning
- Requirements analysis
- Design
- Development
- Quality assurance
- Implementation
- Operations and maintenance
- Disposition
Using a formal schedule doesn’t mean you have to sacrifice flexibility. Plans are meant to be adjustable, and the Gantt chart can easily accommodate changes while retaining dependencies. Nor do you need to sacrifice the advantages of Agile – although the Gantt chart is a traditional project management tool, you can combine it with Agile to create synergistic benefits.
For example, sprints can be built into your Gantt chart. These are constituted by stages such as planning, feature creation, testing, and deployment. Consider the following process:
- For the first sprint, you can assign each software feature a single task with a start-to-finish dependency (where one stage must finish before the next stage can) on the testing stage. Other start-to-finish dependencies may be assigned, although normally a there’s a technical reason for including more than one.
- Team meetings throughout the iteration can help you determine which features need to be moved to later sprints.
- When you move the feature’s corresponding task to a later sprint, the dates move automatically.
- Now you just need to rearrange any dependencies.
As well as simply being used to guide the team through the software development process, Gantt charts can also help alleviate common project management issues. A widely reported problem in the software industry is burnout. The explicit layout of the chart clearly shows dependencies between tasks and phases, as well as how work stacks up across different projects. This information enables you to prevent team members from becoming overloaded (or underloaded).
2. Marketing campaigns
Marketing departments require a comprehensive plan to operate a campaign efficiently. Your marketing strategy will depend on the current socio-economic climate, political backdrop, and analysis of clients and competitors. Accordingly, your marketing plan will include goals which can achieve the desired objective, such as improving client retention rates, gaining new customers, or increasing revenue. A Gantt chart enables you to easily generate ongoing tasks based on these goals, which can then be assigned to the relevant specialist.
Some examples include:
- Create infographics based on research and statistics (market research specialist)
- Create banners and slides for the website (graphic designer)
- Craft blog content (copywriter)
- Analyze backlinks and build new links (SEO specialist)
- Create social media posts (SMM specialist)
Once you’ve generated the tasks, you can set start dates and durations. End dates will be calculated automatically. In this way, Gantt charts provide an easy way to plan and schedule marketing tasks according to the project deadline. As well as ongoing tasks, a Gantt chart can also be used to plot specific activities throughout the year, such as product launches, or events such as annual trade shows.
Marketing campaigns are large, multi-faceted projects that require coordination between different departments. In addition to various teams, you would typically add in multiple marketing channels to your chart. Therefore, a high-level view of the project timeline is essential, so that you can track every part and monitor progress. This view also provides effortless communication between teams, since the intuitive user interface is easily understood by those in diverse departments, such as HR, marketing, or sales.
Gantt charts keep everything together: offline and online marketing, content marketing, social media publication schedules, SEO campaigns, and online ads. A convenient and user-friendly interface makes it easy to brainstorm ideas and link them together. For example, if you plan to email newsletters to your customers, you’ll need to design them and compile relevant content. But you’ll also need to gather email addresses, for example by using a prompt when a customer makes a purchase. Naturally, these two tasks are interdependent: If no newsletters are ready, then no emails can be sent, and vice versa. Gantt charts let you view these tasks in one place, so you can consider their importance and cost as a whole before you decide how to proceed.
3. Construction
Time is one of the most critical aspects of a construction project. When building physical assets, any delay can be a serious setback or even jeopardize your project’s success. Project lifecycles are typically quite long in this industry, so it’s important to ensure every aspect is properly connected. Gantt charts help you hit deadlines by providing clear visualization of all your team’s tasks, their sequence, progress, and goals. They also facilitate the critical path method, which can help you identify the most important tasks.
Here are the three major phases typically found in construction (although you may need to break down each of these phases further as the project plan progresses):
- Pre-construction. This usually includes project approvals, planning and formulation of existing facilities, capital, schedules, scope and budgets, design, and the bidding process.
- Construction process. This is where construction is implemented according to the contract documents. However, this phase also includes budget management, meetings between stakeholders, notification of milestones, shutdown of certain utilities, and clearance for hazardous materials.
- Project close-out. Stakeholders review the project with the project manager (often using the Gantt chart) to check for any incomplete or incorrect work, which is added to the ‘punch list’. To ensure you don’t overlook any items on the punch list, you can create a task group for it and assign each task to the worker responsible. To keep all your paperwork in one place, you could also create a task group for close-out documents and add a digital copy of each one to its respective task.
Construction projects usually involve substantial financing and therefore require careful planning and documentation of expenses. Gantt charts can easily track both the estimated cost and actual cost, enabling you to stay within budget. You can also manage your resources more effectively by assigning tasks to employees and contractors, who can then report their progress. By following progress and comparing this to the planned duration and budget, you can measure performance and anticipate any obstacles.
These are just some examples of the power of the Gantt chart in project management. Its versatility means that regardless of your industry, using the right project management software you can build a bespoke Gantt chart to guide you and your team through any project.